Marketing teams today face a common challenge: data lives everywhere. Your ad platforms report one set of numbers, your CRM tells a different story, and your website analytics paint yet another picture. The result? Hours wasted reconciling reports and second-guessing which campaigns actually drive revenue.
The right analytics tool cuts through this noise, connecting your marketing data into a single source of truth. We evaluated dozens of platforms based on attribution accuracy, ease of use, integration capabilities, and value for marketing teams. Here are the top tools that stand out in 2026.
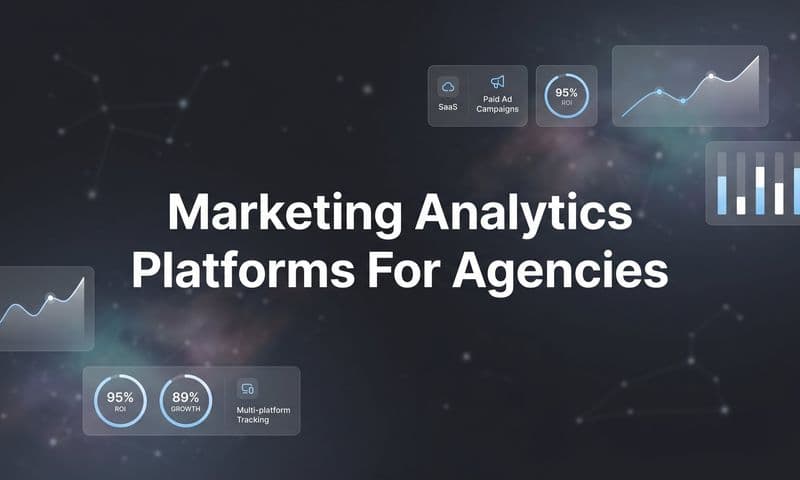
1. Cometly
Best for: Marketing teams running paid campaigns who need accurate attribution and AI-powered optimization insights.
Cometly is a marketing attribution platform that tracks the complete customer journey from first ad click to final revenue conversion.
 7 Best Analytics Tools for Marketing Teams in 2026
Where This Tool Shines
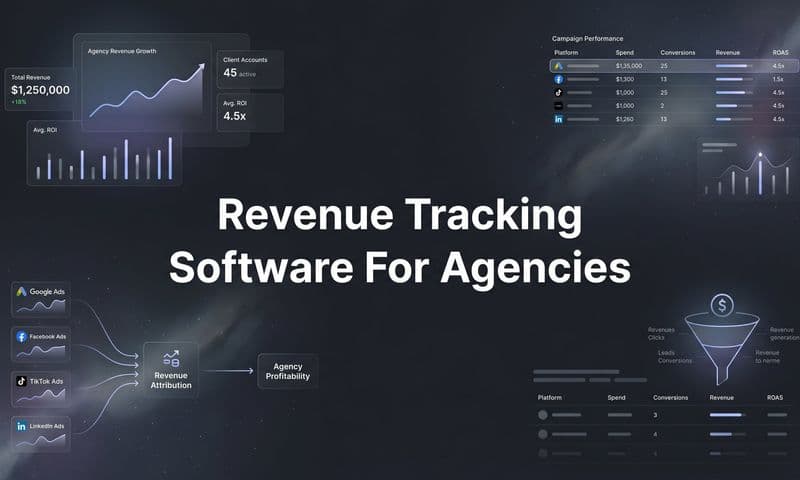
Cometly solves the attribution puzzle that most marketing teams struggle with daily. When you're running campaigns across Meta, Google, TikTok, and other platforms simultaneously, each platform claims credit for the same conversion. Cometly connects all these touchpoints into one unified view.
The platform's server-side tracking addresses the iOS 14+ tracking limitations that have plagued marketers since 2021. Instead of relying solely on browser pixels that get blocked, Cometly captures data server-side for significantly more accurate attribution. This means you actually know which campaigns drive revenue, not just which ones get last-click credit.
Key Features
Multi-Touch Attribution: Compare first-click, last-click, linear, time-decay, and custom attribution models to understand the full customer journey across all marketing channels.
Server-Side Tracking: Bypass browser-based tracking limitations with server-side data collection that captures conversions even when pixels fail.
AI Ads Manager: Get AI-powered recommendations on which campaigns to scale, pause, or optimize based on actual revenue performance rather than platform-reported metrics.
Conversion Sync: Feed enriched conversion data back to Meta, Google, and other ad platforms to improve their algorithm targeting and optimization.
Real-Time Analytics Dashboard: Monitor campaign performance, attribution breakdowns, and revenue metrics in a single dashboard that updates as conversions happen.
Best For
Cometly works best for marketing teams and agencies spending $10,000+ monthly on paid advertising across multiple platforms. If you're struggling to understand which campaigns actually drive revenue or need to justify your ad spend with accurate attribution data, this platform delivers clarity.
Pricing
Custom pricing based on ad spend volume. Demo available to see the platform in action with your data.
2. Google Analytics 4
Best for: Teams needing free, comprehensive website and app analytics with Google Ads integration.
Google Analytics 4 is an event-based analytics platform that tracks user behavior across websites and apps.
 11 Best Conversion Optimization Tools to Boost Your ROI in 2026
Where This Tool Shines
GA4 represents Google's complete reimagining of web analytics for the privacy-first era. Unlike Universal Analytics, which relied heavily on cookies and sessions, GA4 uses an event-based model that adapts better to cookieless tracking and cross-device user journeys.
The platform's native integration with Google Ads makes it invaluable for teams heavily invested in Google's advertising ecosystem. You can import GA4 audiences directly into Google Ads for remarketing and similar audience targeting without additional setup.
Key Features
Event-Based Data Model: Track any user interaction as an event with custom parameters, providing flexibility that the old pageview model couldn't match.
Cross-Platform Tracking: Combine website and mobile app data into unified user journeys when users interact across multiple properties.
Predictive Metrics: Machine learning models predict purchase probability, churn probability, and potential revenue for user segments.
Native Google Integration: Seamless connection with Google Ads, Search Console, and BigQuery for teams using Google's marketing stack.
Free Tier: The standard GA4 version covers the needs of most small to mid-sized marketing teams without any cost.
Best For
GA4 suits marketing teams of any size who need comprehensive website analytics and run Google Ads campaigns. The learning curve is steeper than the old Universal Analytics, but the free tier makes it accessible to teams with limited budgets.
Pricing
Free for standard implementation. GA4 360 for enterprise starts at $50,000 annually with higher data limits and SLA guarantees.
3. Mixpanel
Best for: Product-led companies needing deep user behavior analysis and funnel optimization.
Mixpanel is a product analytics platform focused on tracking user actions, analyzing conversion funnels, and understanding behavioral cohorts.
 7 Best Analytics Tools for Marketing Teams in 2026
Where This Tool Shines
Mixpanel excels at answering "why" questions about user behavior. While most analytics tools tell you how many users converted, Mixpanel helps you understand what specific actions led to conversion and which user segments behave differently.
The platform's funnel analysis goes beyond basic conversion tracking. You can identify exactly where users drop off, compare different user cohorts side-by-side, and test hypotheses about what drives retention. This makes it particularly valuable for SaaS companies and digital products where user engagement drives revenue.
Key Features
Advanced Funnel Analysis: Build multi-step funnels with unlimited steps, analyze drop-off points, and compare conversion rates across user segments.
User-Level Tracking: Follow individual user journeys from first visit through conversion and retention, seeing every action they took.
Cohort Analysis: Group users by shared characteristics or behaviors, then compare metrics like retention and lifetime value across cohorts.
A/B Testing Integration: Connect experiment results to behavioral data to understand not just which variant won, but why users responded differently.
Self-Serve Exploration: Non-technical team members can build custom reports and explore data without SQL knowledge or developer help.
Best For
Mixpanel works best for product-led SaaS companies, mobile apps, and digital platforms where understanding in-app user behavior matters more than traditional marketing attribution. Marketing teams at these companies use it to optimize onboarding flows and activation campaigns.
Pricing
Free up to 20 million events monthly. Growth plan starts at $20 per month with increased limits and additional features.
4. HubSpot Marketing Analytics
Best for: Marketing teams already using HubSpot who need attribution tied to CRM data.
HubSpot Marketing Analytics provides campaign attribution and performance reporting built into HubSpot's marketing automation platform.
 10 Best Enterprise Channel Analytics Software To Maximize Marketing ROI
Where This Tool Shines
HubSpot's analytics shine when your marketing and sales teams need a shared view of the customer journey. Because the analytics live within the same platform as your CRM, email marketing, and automation workflows, you get attribution that connects marketing touchpoints directly to closed deals.
The platform automatically tracks every interaction a contact has with your marketing—email opens, website visits, content downloads, ad clicks—and attributes revenue to campaigns without manual data stitching. This makes it significantly easier to prove marketing ROI to leadership.
Key Features
Native CRM Integration: Marketing attribution connects directly to deal records, showing which campaigns influenced closed revenue without integration headaches.
Multi-Touch Attribution: Choose from first-touch, last-touch, or custom attribution models to understand how different touchpoints contribute to conversions.
Custom Report Builder: Create tailored reports combining marketing metrics, sales data, and custom properties without technical skills.
Campaign Performance Dashboards: Pre-built dashboards for email, social media, ads, and website performance with drill-down capabilities.
Contact Journey Tracking: View the complete timeline of every contact's interactions with your marketing in chronological order.
Best For
HubSpot Analytics makes sense for teams already using HubSpot for marketing automation or CRM. If you're not in the HubSpot ecosystem, the cost of entry just for analytics is hard to justify.
Pricing
Included with Marketing Hub subscriptions. Marketing Hub Professional starts at $800 monthly, which includes the analytics features along with automation and other marketing tools.
5. Amplitude
Best for: Enterprise teams needing behavioral analytics with built-in experimentation capabilities.
Amplitude is an enterprise behavioral analytics platform designed for product and marketing teams requiring deep user insights and experimentation.
 7 Best Analytics Tools for Marketing Teams in 2026
Where This Tool Shines
Amplitude takes behavioral analytics to an enterprise scale that few platforms match. The platform handles billions of events without performance degradation, making it suitable for high-traffic products with millions of users.
What sets Amplitude apart is how it combines analytics with experimentation. You can identify behavioral patterns in your analytics, form hypotheses, launch A/B tests, and measure results—all within the same platform. This closed loop between insight and action accelerates optimization cycles significantly.
Key Features
Behavioral Cohort Analysis: Build sophisticated user segments based on any combination of actions, properties, and sequences, then track their behavior over time.
Built-In Experimentation: Launch and analyze A/B tests without separate tools, with statistical significance calculations and automatic winner detection.
Customer Journey Mapping: Visualize the paths users take through your product, identifying common routes to conversion and unexpected drop-off points.
Predictive Analytics: Machine learning models predict which users are likely to convert, churn, or take specific actions based on behavioral patterns.
Enterprise Data Governance: Role-based access controls, data validation rules, and audit logs meet enterprise security and compliance requirements.
Best For
Amplitude targets enterprise product and marketing teams at high-growth companies with sophisticated analytics needs. The platform's complexity and pricing make it overkill for small teams or simple use cases.
Pricing
Free tier available up to 10 million events monthly. Growth and Enterprise tiers with custom pricing based on event volume and features needed.
6. Tableau
Best for: Teams needing custom marketing dashboards that combine data from multiple sources.
Tableau is a data visualization platform that connects to virtually any data source to create interactive dashboards and reports.
 7 Best Analytics Tools for Marketing Teams in 2026
Where This Tool Shines
Tableau excels when your marketing data lives in multiple systems and you need a unified view. Unlike analytics platforms that only show their own data, Tableau connects to everything—your ad platforms, CRM, analytics tools, databases, spreadsheets—and lets you build custom dashboards combining all these sources.
The drag-and-drop interface makes it accessible to non-technical users, while the underlying calculation engine supports sophisticated analysis for data analysts. This flexibility means marketing teams can start with simple reports and grow into complex multi-source dashboards as their needs evolve.
Key Features
Universal Data Connections: Native connectors for hundreds of data sources including ad platforms, databases, cloud storage, and web services.
Visual Dashboard Builder: Drag-and-drop interface for creating charts, graphs, and dashboards without coding or SQL knowledge.
Advanced Calculations: Build custom metrics, calculated fields, and complex formulas to derive insights beyond what source systems provide.
Interactive Dashboards: Create dashboards with filters, drill-downs, and parameter controls that let viewers explore data themselves.
Enterprise Security: Row-level security, user authentication, and permission controls meet enterprise data governance requirements.
Best For
Tableau suits marketing teams with data spread across multiple platforms who need custom reporting that standard analytics tools can't provide. It requires more setup than purpose-built marketing analytics platforms, but offers unmatched flexibility.
Pricing
Creator license starts at $75 per user monthly for full dashboard creation capabilities. Explorer license at $42 per user monthly for viewing and limited editing.
7. Supermetrics
Best for: Teams needing automated data extraction from marketing platforms into reporting tools.
Supermetrics is a marketing data pipeline that pulls data from 100+ advertising and analytics platforms into spreadsheets, data warehouses, and visualization tools.
 7 Best Analytics Tools for Marketing Teams in 2026
Where This Tool Shines
Supermetrics solves the manual data export problem that wastes hours of marketing team time every week. Instead of logging into each ad platform, downloading CSV files, and copying data into spreadsheets, Supermetrics automates the entire process with scheduled data refreshes.
The platform acts as a bridge between your marketing tools and wherever you want to analyze the data. Whether you prefer working in Google Sheets, building dashboards in Looker Studio, or running analysis in a data warehouse, Supermetrics handles the data movement automatically.
Key Features
100+ Platform Connectors: Pull data from major ad platforms, analytics tools, social media networks, and marketing automation systems through pre-built integrations.
Automated Refresh Scheduling: Set up data pulls to run hourly, daily, or weekly, ensuring reports always show current data without manual updates.
Multiple Destinations: Send data to Google Sheets, Excel, Looker Studio, Power BI, Tableau, BigQuery, Snowflake, and other destinations.
Data Warehouse Support: Build marketing data warehouses by automatically syncing data from all platforms into BigQuery, Snowflake, or Redshift.
Pre-Built Templates: Start with ready-made report templates for common use cases, then customize to match your specific needs.
Best For
Supermetrics works best for marketing teams that already have a preferred reporting environment—whether spreadsheets, BI tools, or data warehouses—and need automated data collection. It's a connector, not a standalone analytics platform.
Pricing
Starts at $39 monthly for a single data source connector. Pricing scales based on number of connectors, destinations, and data volume needed.
Finding Your Perfect Analytics Match
The right analytics tool depends entirely on what you're trying to solve. If you're running paid campaigns across multiple platforms and struggling with attribution accuracy, Cometly delivers the clarity you need with server-side tracking and AI-powered optimization insights. For teams already embedded in the HubSpot ecosystem, their built-in analytics connects marketing directly to revenue without additional integration work.
Google Analytics 4 remains the default choice for website analytics, especially when you're running Google Ads campaigns. The free tier covers most team needs, though the learning curve requires investment. Product-focused teams benefit more from Mixpanel or Amplitude, which excel at behavioral analysis and user journey mapping rather than traditional marketing attribution.
Consider Tableau when your data lives across multiple systems and you need custom dashboards that standard platforms can't provide. Supermetrics fits teams that have already chosen their reporting environment and simply need automated data collection from marketing platforms.
Most marketing teams end up using multiple tools in combination. A common setup pairs an attribution platform like Cometly with Google Analytics for website behavior and Supermetrics for automated reporting. The key is choosing tools that integrate well together rather than trying to force one platform to do everything.
Ready to elevate your marketing game with precision and confidence? Discover how Cometly's AI-driven recommendations can transform your ad strategy—Get your free demo today and start capturing every touchpoint to maximize your conversions.