
Marketers today face a critical choice: do you need tools that transform complex data into compelling visual stories, or platforms that track and analyze website traffic patterns? The answer often depends on your specific goals—and sometimes you need both.
Data visualization tools help you present insights to stakeholders and spot trends in campaign performance, while traffic analytics tools reveal how visitors find and interact with your site. This guide breaks down the top tools in both categories, helping you choose the right solution for your marketing stack.
We've evaluated each tool based on ease of use, integration capabilities, pricing, and real-world marketing applications. Here are the top tools that combine powerful analytics with actionable insights.
1. Cometly
Best for: Marketers who need attribution tracking with AI-powered optimization across all ad platforms
Cometly is a marketing attribution platform that connects your ad performance directly to revenue with AI-powered analytics and visualization built specifically for paid advertising.
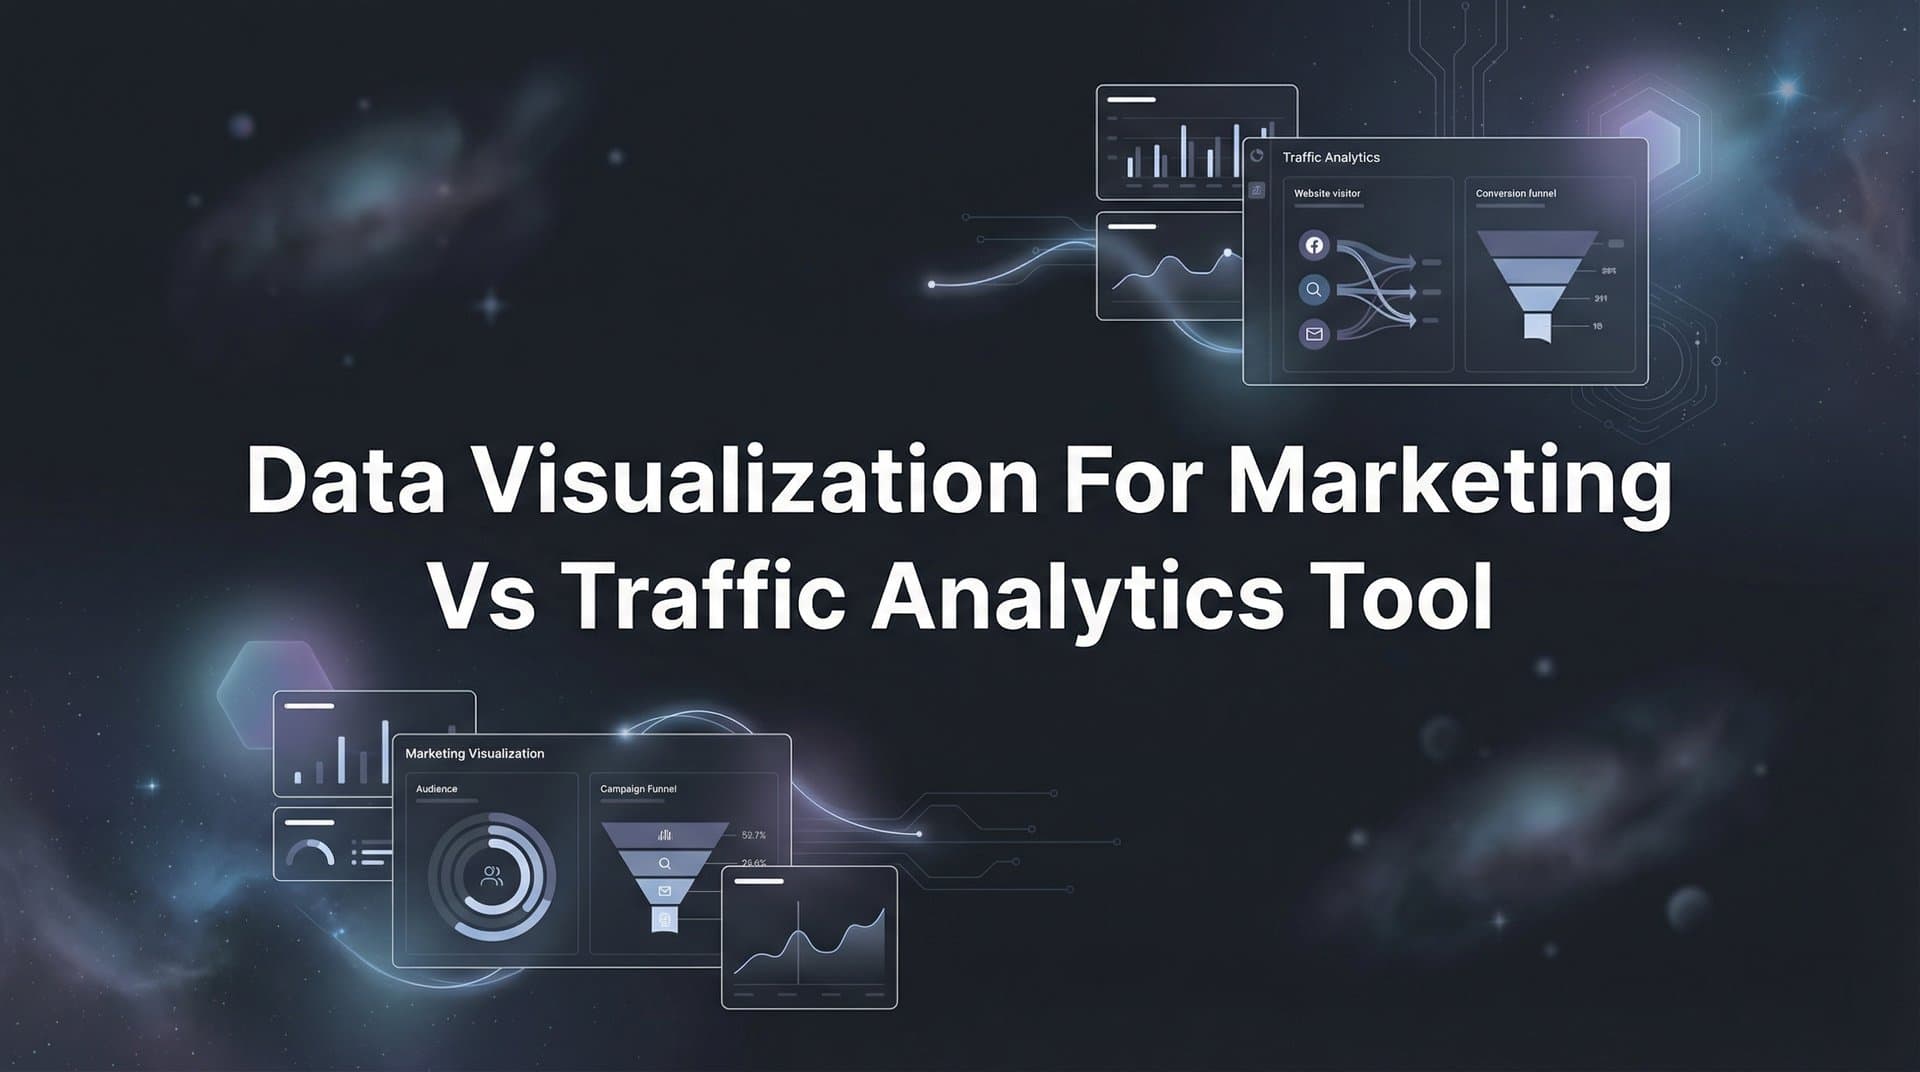
 9 Best Data Visualization and Traffic Analytics Tools for Marketers in 2026
Where This Tool Shines
Cometly bridges the gap between traffic data and revenue outcomes. Instead of just showing you pageviews or sessions, it tracks the entire customer journey from first ad click through CRM events to final purchase.
The platform's AI analyzes your attribution data to surface optimization opportunities you might miss manually. It identifies which ads, campaigns, and channels actually drive conversions—not just traffic—so you can confidently scale what works and cut what doesn't.
Key Features
Multi-Touch Attribution: Track every touchpoint across all ad platforms to see the complete customer journey.
AI Ads Manager: Get AI-powered recommendations on which campaigns to scale based on actual revenue data.
Server-Side Tracking: Capture accurate conversion data even with iOS privacy restrictions and ad blockers.
Conversion Sync: Feed enriched conversion data back to Meta, Google, and other platforms to improve their algorithm optimization.
Real-Time Dashboard: Monitor campaign performance and attribution insights as they happen with customizable visualizations.
Best For
Marketing teams and agencies running multi-channel paid advertising campaigns who need to prove ROI and make data-driven budget decisions. Particularly valuable for businesses spending over $10K monthly on ads across multiple platforms.
Pricing
Custom pricing based on monthly ad spend. Demo available to explore features and discuss pricing tailored to your campaign volume.
2. Tableau
Best for: Enterprise teams needing highly customizable dashboards with advanced analytics capabilities
Tableau is an enterprise data visualization platform that turns complex datasets into interactive dashboards through an intuitive drag-and-drop interface.
 11 Best Marketing Analytics Tools to Track and Optimize Campaign Performance in 2026
Where This Tool Shines
Tableau excels at handling massive datasets and creating publication-quality visualizations. The platform connects to virtually any data source—from marketing automation tools to CRMs to databases—and lets you blend data from multiple sources in a single view.
The calculated fields feature allows marketers to create custom metrics without SQL knowledge. You can build sophisticated analyses like cohort performance, attribution modeling, or campaign ROI calculations directly within your visualizations.
Key Features
Drag-and-Drop Builder: Create complex visualizations without coding through an intuitive visual interface.
Data Source Connectors: Connect to 100+ data sources including Google Ads, Salesforce, and custom databases.
Calculated Fields: Build custom metrics and KPIs with a formula language designed for business users.
Collaborative Sharing: Publish dashboards to Tableau Server or Tableau Cloud for team access with permission controls.
Mobile Optimization: Automatically optimized layouts for viewing dashboards on phones and tablets.
Best For
Enterprise marketing teams with diverse data sources who need pixel-perfect visualizations for executive presentations. Works best when you have dedicated analytics resources or data-savvy marketers.
Pricing
Tableau Creator starts at $75 per user monthly. Explorer and Viewer licenses available at lower price points for team members who only need dashboard access.
3. Google Analytics 4
Best for: Comprehensive website and app traffic tracking with machine learning insights
Google Analytics 4 is Google's event-based analytics platform that tracks user behavior across websites and apps with predictive metrics powered by machine learning.
 11 Best Conversion Optimization Tools to Boost Your ROI in 2026
Where This Tool Shines
GA4 represents a fundamental shift from session-based to event-based tracking. Every interaction becomes an event—page views, clicks, video plays, form submissions—giving you granular control over what you measure.
The platform's predictive metrics use machine learning to forecast purchase probability and churn likelihood for different user segments. This helps marketers identify high-value audiences before they convert, enabling proactive targeting strategies.
Key Features
Event-Based Tracking: Flexible measurement model that tracks any user interaction as a customizable event.
Cross-Platform Measurement: Unified tracking across websites and mobile apps to see the complete user journey.
Predictive Audiences: Machine learning identifies users likely to purchase or churn within the next seven days.
BigQuery Integration: Export raw event data to BigQuery for advanced analysis and custom reporting.
Privacy Controls: Built-in consent mode and data retention settings to comply with privacy regulations.
Best For
Any business with a website or app that needs free, comprehensive traffic analytics. Essential for understanding how users find and interact with your digital properties.
Pricing
Free for most businesses. GA4 360 for enterprise starts at $50,000 annually with higher data limits and SLA guarantees.
4. Looker Studio
Best for: Creating shareable marketing reports that connect to Google's ecosystem
Looker Studio is Google's free data visualization tool that transforms data from multiple sources into customizable, shareable reports and dashboards.
 9 Best Data Visualization Tools for Marketing Analytics in 2026
Where This Tool Shines
Looker Studio's native integration with Google products makes it effortless to visualize Google Ads, GA4, Search Console, and YouTube data. You can build a comprehensive marketing performance dashboard in minutes using pre-built connectors.
The platform updates reports in real time, so stakeholders always see current data without manual refreshes. The sharing model works like Google Docs—send a link and control view or edit permissions for different team members.
Key Features
Native Google Connectors: One-click connections to Google Ads, GA4, Search Console, and other Google properties.
Real-Time Data Refresh: Reports update automatically as new data flows into connected sources.
Interactive Reports: Recipients can filter and explore data within shared reports without editing the original.
Community Templates: Access hundreds of pre-built report templates from the Looker Studio community.
Data Blending: Combine data from multiple sources to create unified views of campaign performance.
Best For
Marketing teams heavily invested in Google's advertising and analytics ecosystem who need to create client-facing or stakeholder reports quickly without design skills.
Pricing
Completely free for standard use. Advanced features available through Looker (separate product) with enterprise pricing.
5. Mixpanel
Best for: Product-focused marketers tracking user behavior, funnels, and retention
Mixpanel is a product analytics platform that tracks how users interact with your website or app, with powerful funnel and retention analysis tools.
 9 Best Data Visualization and Traffic Analytics Tools for Marketers in 2026
Where This Tool Shines
Mixpanel specializes in understanding user behavior at a granular level. Rather than just knowing someone visited your pricing page, you can track exactly which features they explored, how long they spent on each section, and what path led them there.
The funnel analysis shows exactly where users drop off in conversion paths. You can segment these funnels by traffic source, device type, or any custom property to identify which marketing channels deliver the highest-quality traffic.
Key Features
Funnel Analysis: Visualize conversion paths and identify exactly where users abandon the journey.
Retention Reports: Track how often users return and what behaviors correlate with long-term engagement.
User Journey Mapping: See the actual paths users take through your site or app, not just isolated pageviews.
Behavioral Cohorts: Group users by actions they've taken to analyze and target specific behavior patterns.
Real-Time Processing: Data appears in reports within seconds of user actions for immediate insights.
Best For
SaaS companies and digital product teams who need to understand feature adoption and user engagement beyond basic traffic metrics.
Pricing
Free plan covers up to 20 million events monthly. Growth plan starts at $20 per month with increased limits and advanced features.
6. Hotjar
Best for: Visual behavior insights through heatmaps, recordings, and on-site feedback
Hotjar is a behavior analytics tool that shows how visitors actually interact with your website through heatmaps, session recordings, and feedback widgets.
 11 Best Conversion Optimization Tools to Boost Your ROI in 2026
Where This Tool Shines
Hotjar answers the "why" behind your traffic data. While analytics platforms tell you bounce rate increased, Hotjar's session recordings show you watching actual visitors struggle with your navigation or miss your call-to-action button.
The heatmap visualizations reveal which page elements attract attention and which get ignored. Scroll maps show how far down the page visitors actually read, helping you optimize content placement and page length for better engagement.
Key Features
Interaction Heatmaps: See aggregate click, scroll, and mouse movement patterns across your pages.
Session Recordings: Watch individual user sessions with filtering by traffic source, device, or behavior.
Feedback Widgets: Collect on-site feedback with customizable surveys and polls at key moments.
Funnel Visualization: Combine recordings and heatmaps to understand drop-off points in conversion funnels.
User Recruitment: Identify and invite specific users for interviews based on their behavior patterns.
Best For
Marketers optimizing landing pages and conversion rates who need qualitative insights to complement quantitative analytics data.
Pricing
Free basic plan with limited sessions. Plus plan starts at $39 monthly with increased session limits and advanced filtering.
7. Power BI
Best for: Organizations using Microsoft ecosystem with complex data modeling needs
Power BI is Microsoft's business intelligence platform that connects to hundreds of data sources with deep Excel and Azure integration.
 9 Best Data Visualization Tools for Marketing Analytics in 2026
Where This Tool Shines
Power BI feels immediately familiar to Excel users, making the transition to professional business intelligence tools less intimidating. You can import Excel workbooks directly and transform them into interactive dashboards without rebuilding calculations.
The natural language Q&A feature lets stakeholders ask questions in plain English—"What was our best performing campaign last month?"—and get instant visualizations. This democratizes data access beyond just the analytics team.
Key Features
Natural Language Queries: Ask questions about your data in plain English and get instant visual answers.
Excel Integration: Import existing Excel models and transform them into interactive Power BI reports.
AI-Powered Insights: Automatic detection of anomalies, trends, and patterns in your marketing data.
Embedded Analytics: Integrate reports directly into applications or internal portals with white-label options.
Enterprise Security: Row-level security, encryption, and compliance certifications for regulated industries.
Best For
Marketing teams in Microsoft-centric organizations who need enterprise-grade analytics with familiar tools and strong governance controls.
Pricing
Power BI Desktop is free for individual use. Power BI Pro costs $10 per user monthly for sharing and collaboration features.
8. Amplitude
Best for: Advanced product analytics with experimentation and predictive capabilities
Amplitude is a product analytics platform focused on behavioral analysis, experimentation, and customer journey mapping with enterprise-grade data governance.
 9 Best Data Visualization and Traffic Analytics Tools for Marketers in 2026
Where This Tool Shines
Amplitude's behavioral cohort engine goes beyond simple segmentation. You can create audiences based on complex behavior patterns—users who completed action A but not action B within seven days—and track how these cohorts perform over time.
The built-in experimentation framework connects directly to your analytics, so you can run A/B tests and immediately see impact on retention, revenue, and other key metrics without switching tools or reconciling data.
Key Features
Behavioral Cohorts: Create sophisticated user segments based on action sequences and timing patterns.
Built-In Experimentation: Run A/B tests with statistical significance calculations and automatic winner detection.
Journey Mapping: Visualize the most common paths users take and identify successful conversion patterns.
Predictive Analytics: Machine learning models forecast user behavior and lifetime value.
Data Governance: Taxonomy management and data quality monitoring to ensure consistent tracking.
Best For
Growth teams at product-led companies who need sophisticated behavioral analysis and want to run experiments based on deep user insights.
Pricing
Free plan available up to 10 million events monthly. Growth plan pricing provided on request based on volume and features needed.
9. Databox
Best for: Marketers who need quick dashboards pulling data from multiple marketing tools
Databox is a marketing dashboard platform that connects to 70+ tools with pre-built templates for common marketing reports and KPI tracking.
Where This Tool Shines
Databox solves the "dashboard fatigue" problem where marketers constantly switch between Google Analytics, Facebook Ads, HubSpot, and other tools. Everything consolidates into a single view with pre-built templates that work out of the box.
The goal tracking feature lets you set targets for any metric and receive alerts when performance drifts off track. The mobile app means you can check campaign performance from anywhere without logging into multiple platforms.
Key Features
70+ Native Integrations: Pre-built connectors to major marketing, analytics, and CRM platforms.
Dashboard Templates: Hundreds of ready-to-use templates for common marketing reports and KPIs.
Goal Tracking: Set targets for any metric and receive alerts when performance deviates from goals.
Mobile App: Full-featured iOS and Android apps for monitoring performance on the go.
Benchmark Data: Compare your performance against anonymous peer data from similar companies.
Best For
Marketing agencies and small teams who need consolidated reporting across multiple clients or campaigns without building custom integrations.
Pricing
Free plan supports up to three data sources. Starter plan begins at $47 monthly with 10 data sources and additional users.
Making the Right Choice for Your Marketing Stack
The best tool depends on what you're trying to accomplish. If you're primarily focused on understanding where your traffic comes from and how visitors behave, GA4 provides comprehensive free tracking. Pair it with Hotjar to see the qualitative "why" behind the quantitative data.
For teams that need to prove marketing ROI and connect ad spend to revenue, attribution platforms like Cometly bridge the gap between traffic data and business outcomes. The AI-powered recommendations help you optimize campaigns based on actual conversions rather than vanity metrics.
Enterprise teams with complex data needs will find Tableau or Power BI offer the customization and scalability required for sophisticated analysis. Choose Tableau for best-in-class visualization capabilities, or Power BI if you're already invested in the Microsoft ecosystem.
Product-focused marketers should consider Mixpanel or Amplitude for deep behavioral analysis and retention tracking. These platforms excel at understanding user engagement beyond basic traffic metrics.
If you just need quick dashboards without technical complexity, Looker Studio offers powerful free reporting for Google ecosystem data, while Databox provides pre-built templates across 70+ marketing tools.
Most successful marketing teams use a combination of tools—traffic analytics to understand acquisition, visualization platforms for reporting, and attribution tools to connect everything to revenue. Start with your most pressing question: Do you need to understand where traffic comes from, visualize performance for stakeholders, or prove which campaigns drive actual revenue?
Ready to elevate your marketing game with precision and confidence? Discover how Cometly's AI-driven recommendations can transform your ad strategy—Get your free demo today and start capturing every touchpoint to maximize your conversions.


