
To get a real grip on your advertising effectiveness, you first need to decide what success actually looks like for each campaign. It’s about matching the right metrics, like Return on Ad Spend (ROAS) or Cost Per Acquisition (CPA), to the goals you set from the very beginning. This way, you're measuring against a benchmark that matters to your business, not just chasing generic numbers.
Defining Success Before You Spend a Dollar
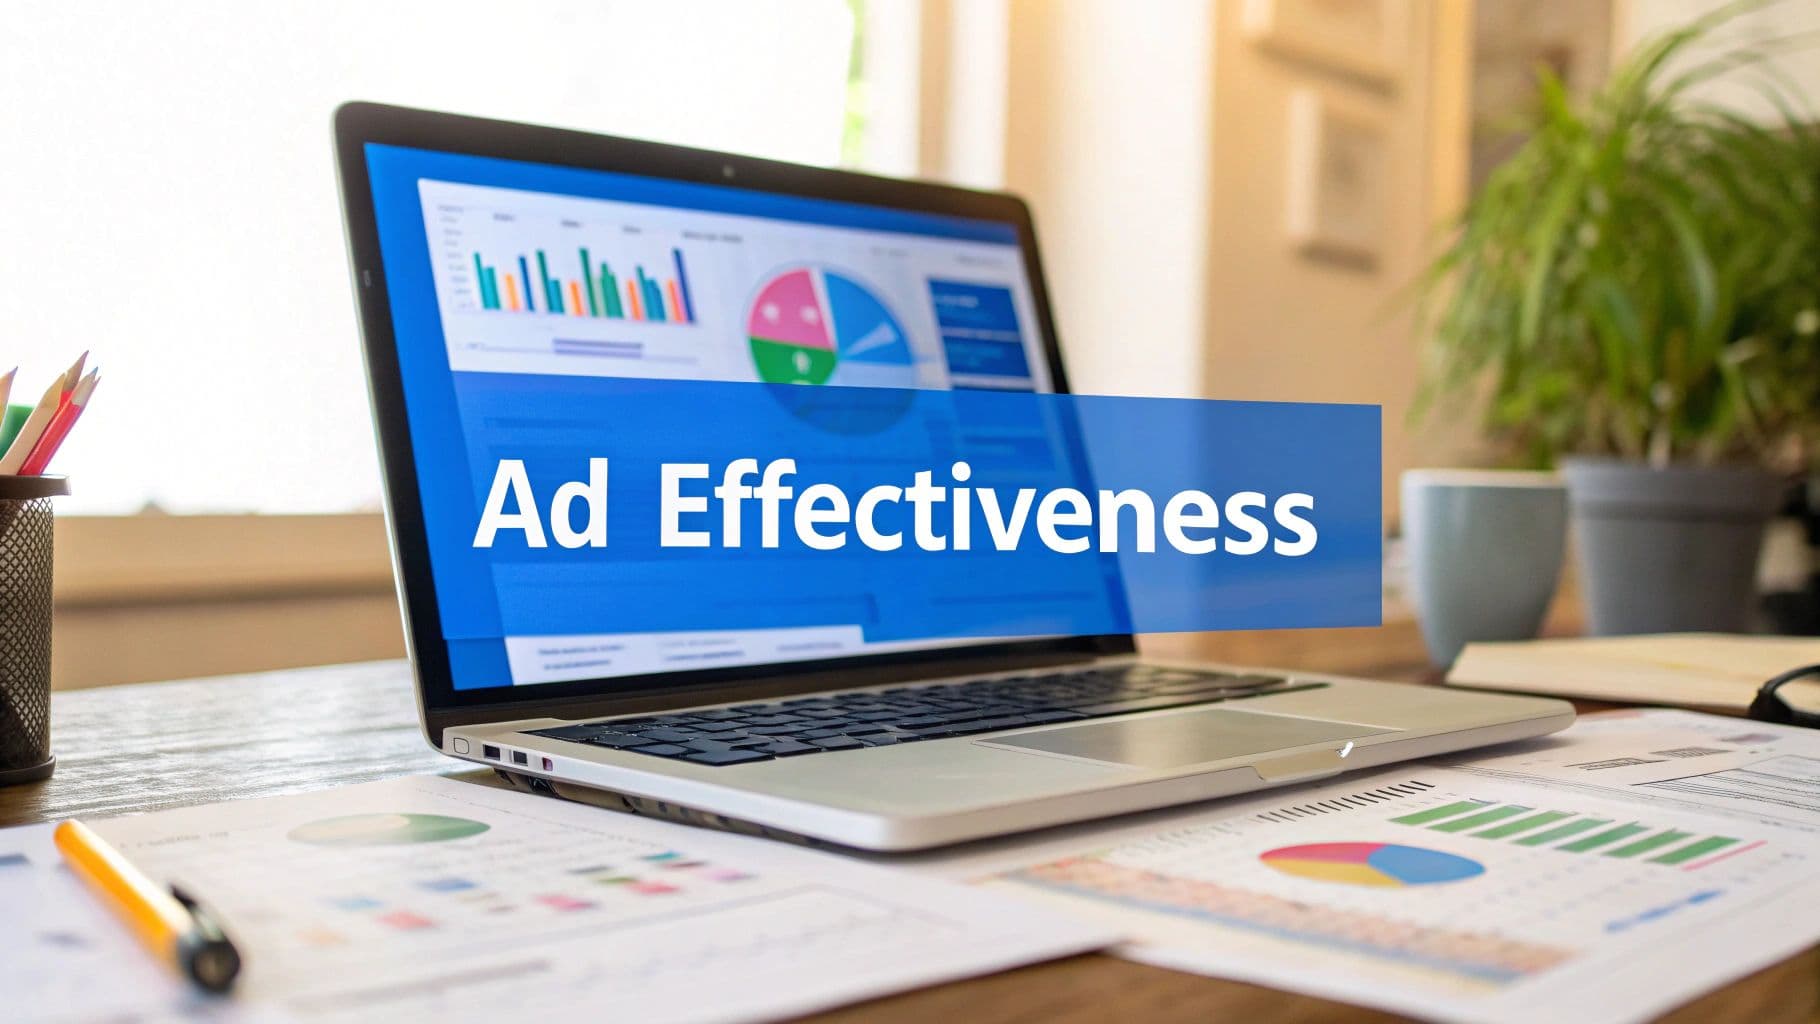
Before a single dollar goes into an ad, the most important question to ask is: "What does a win look like?" Without a clear answer, you're just throwing money into the wind and hoping for the best. Measuring ad effectiveness isn't about tracking clicks and impressions; it's about seeing how your ads perform against specific, pre-defined business goals.
Forget vague objectives like "getting more traffic." Those are useless. You need to get specific and make your goals quantifiable.
This all starts with knowing which of two primary campaign types you're running.
Brand Awareness vs. Direct Response
Are you trying to get your name out there or are you trying to drive immediate sales? The answer completely changes how you measure success.
- Brand Awareness Campaigns: The goal here is simple: get your brand in front of as many relevant eyeballs as possible. Success is measured by metrics like impressions, reach, and video view duration. You're playing the long game, building familiarity and trust that will pay off down the road.
- Direct Response Campaigns: These campaigns are all about action. You want someone to click, sign up, or buy something right now. The metrics here are tied directly to revenue and customer acquisition, like ROAS and CPA, making them much easier to evaluate.
A classic mistake is judging a brand awareness campaign with direct response metrics. If you run a YouTube ad just to introduce your brand to a new audience, don't get discouraged by a low immediate ROAS. Its job was to plant a seed, not to harvest the entire crop on day one.
Setting Quantifiable Goals and KPIs
Once you've nailed down your main objective, you have to attach a number to it. This is how a vague goal becomes a concrete Key Performance Indicator (KPI) that you can actually track.
For example, an e-commerce store running a direct response campaign isn't just "aiming for sales." They're aiming for a specific 4:1 Return on Ad Spend (ROAS). For every $1 they spend, they need to generate $4 in revenue. A SaaS company might have a different goal, like setting a target of a $150 Cost Per Demo Booked.
Your choice of campaign goal directly dictates which metrics you should be watching. If you're focusing on the wrong numbers, you'll end up making the wrong decisions.
Matching Campaign Goals to Key Metrics
Campaign GoalPrimary MetricExample ScenarioIncrease Brand RecognitionImpressions & ReachA new beverage company runs video ads on social media to introduce its product to a cold audience.Drive Immediate SalesReturn on Ad Spend (ROAS)An online clothing store runs a flash sale campaign on Meta, aiming for $5 in revenue for every $1 spent.Generate Qualified LeadsCost Per Acquisition (CPA)A B2B software company runs LinkedIn ads to get professionals to sign up for a free trial.Boost Website EngagementClick-Through Rate (CTR)A content publisher promotes its latest article with Google Ads to drive more readers to its blog.
Ultimately, a truly comprehensive measurement strategy uses a mix of these metrics. You need to understand both the immediate financial impact and the long-term brand value your ads are creating. By tracking metrics like Click-Through Rate (CTR), Conversion Rate, CPA, and ROAS together, you get a full picture of performance.
This process transforms your advertising from a blind cost center into a predictable engine for growth. By setting these benchmarks first, every metric you track has context and purpose. You can even model different scenarios before launch with our advertising ROI calculator.
This initial planning is what separates the campaigns that feel successful from those that demonstrably are.
Building Your Measurement and Tracking Toolkit
 How to Measure Advertising Effectiveness: The Complete Guide
Once your goals are crystal clear, it’s time to assemble the tools that will actually collect the data. Without a solid tracking infrastructure, you’re basically flying blind, making big budget decisions based on feelings rather than facts. Honestly, building this toolkit is a non-negotiable step.
The foundation of any good tracking setup starts with the native tools provided by the ad platforms themselves. Think of these as the absolute basics you need in place before spending your first ad dollar.
- Meta Pixel (for Facebook & Instagram Ads): This little snippet of code is a workhorse. It tracks website visitors and the actions they take, like adding an item to their cart or making a purchase. It’s absolutely essential for optimizing ad delivery and, more importantly, for retargeting users who’ve already shown interest.
- Google Ads Tag: Just like the Meta Pixel, this tag is designed to track conversions from your Google Ads campaigns. It lets you see which keywords, ads, and campaigns are driving valuable actions on your site.
These platform-native tools are a great start, but they have a major flaw: they operate in silos. Each one is busy telling its own version of the story, which is where things get messy and expensive.
Creating a Single Source of Truth
Relying solely on platform data is a recipe for disaster. It’s common to see Facebook claim full credit for a sale while Google Ads reports the exact same conversion, leading to inflated numbers and terrible budget decisions. This is precisely why a central, unbiased system is so important.
An attribution tool acts as an impartial referee between your ad platforms. It de-duplicates conversions and stitches together the entire customer journey, showing you every touchpoint that contributed to a sale—not just the last one.
This unified view is what allows for true, intelligent optimization. For a deeper dive, our guide on how to measure marketing attribution breaks down exactly how to connect these dots.
A third-party tool like Cometly, for example, gives you a centralized dashboard to track performance across all your channels without the headache.
How to Measure Advertising Effectiveness: The Complete Guide
The screenshot above shows how a unified platform pulls all your data into one place. This gives you a clear, honest view of performance without having to constantly switch between a dozen ad manager tabs.
The Critical Role of UTM Parameters
If you want to make your tracking even more precise—and you definitely should—you have to master Urchin Tracking Module (UTM) parameters. These are just simple tags you add to the end of your URLs that tell your analytics tools exactly where a visitor came from.
A properly structured UTM can identify the nitty-gritty details:
- Source: The platform that sent you the traffic (e.g.,
google,facebook). - Medium: The specific marketing channel (e.g.,
cpc,email,social). - Campaign: The name of your campaign (e.g.,
summer-sale-2024).
Using UTMs consistently ensures your data is clean and organized. It lets you trace every dollar you spend back to its origin and its impact. This granular detail is the key to building a data infrastructure that definitively answers the question, "Where are my sales really coming from?"
Understanding How Attribution Models Work
Let's imagine a pretty typical customer journey. Someone sees your ad on Facebook, gets curious, and a week later, they Google your brand name to learn more. Finally, a retargeting ad on a news site catches their eye, and they click it to make a purchase.
So, who gets the credit? The Facebook ad that started it all? The final retargeting ad? This is the exact problem that attribution models solve. Think of them as the set of rules that decides how to assign credit for a sale across all the different touchpoints that led to it.
Getting this right is absolutely critical. The model you choose directly influences which campaigns you think are working and where you decide to put your ad dollars. In the old days, measuring ad effectiveness was a lot of guesswork. But as a 2013 study pointed out, the shift to digital gave us an unprecedented ability to connect ads to specific actions. We can now track with a level of precision that was once impossible.
Comparing Common Attribution Models
So how would different models interpret that customer journey we talked about? Your choice here will completely change which ad you see as the "winner."
- Last-Click Attribution: This is the default for many platforms and arguably the simplest. It gives 100% of the credit to the very last touchpoint—in our scenario, the retargeting ad. It's easy to track, but it's dangerously misleading because it completely ignores all the earlier interactions that built brand awareness and nurtured interest.
- First-Click Attribution: This is the exact opposite. It gives 100% of the credit to the first ad the customer ever saw—the Facebook ad. This model is great for rewarding channels that bring in new people, but it overlooks everything that happens later to actually push them over the finish line.
One of the biggest mistakes I see marketers make is relying only on a last-click model. You might kill a top-of-funnel Facebook campaign because it shows zero direct sales, even though it's single-handedly filling your pipeline with new prospects.
Embracing a More Balanced View
First-click and last-click are simple, but they don't give you the full story. To really understand what’s driving growth, you need a more balanced and accurate view that advanced models can provide.
A Linear model, for example, splits the credit evenly across all touchpoints. In our scenario, the Facebook ad, the organic Google search, and the final retargeting ad would each get 33.3% of the credit. This approach acknowledges that every single step played a part in the final conversion.
The infographic below shows how a unified digital analytics dashboard helps you keep an eye on these crucial metrics all the way through the customer's journey.
 How to Measure Advertising Effectiveness: The Complete Guide
The real takeaway here is that a centralized dashboard lets you see the entire path to purchase, not just a single, isolated click.
Even better is Data-Driven Attribution. This model uses machine learning to analyze every conversion path and figure out which touchpoints are actually the most influential in driving a purchase. It then assigns credit accordingly. It’s by far the most accurate model, but it's also the most complex to set up unless you have the right tools.
To dive deeper into these concepts, check out our guide to multi-touch attribution. Once you understand how each model works, you can pick the one that truly reflects your customer's journey and start making much smarter, more profitable advertising decisions.
Turning Your Data Into Actionable Growth
Collecting data is just the first step. Where the real growth happens is when you turn those numbers into smart, decisive actions.
It's not enough to just report on metrics. The magic lies in asking why the numbers look the way they do. This is how you start to peel back the layers and truly understand what’s driving your advertising performance—or holding it back.
Imagine a classic scenario: you launch a new ad campaign and the Click-Through Rate (CTR) is fantastic. People are definitely interested. But when you check your Conversion Rate, it's a huge letdown.
Raw data just tells you what happened. Smart analysis helps you figure out why. Is there a disconnect between your ad and your landing page? Did you promise a massive discount in the ad that's buried or hard to find on your site? Answering these questions is what turns a mediocre campaign into a profitable one.
From Insights to Optimization
Once you've sniffed out a potential problem, it's time to start testing. This isn't about throwing spaghetti at the wall to see what sticks; it's about running controlled experiments to discover what truly resonates with your audience. We often call this A/B testing or split testing, and it’s a non-negotiable for improving performance.
You can methodically test almost any part of your campaigns:
- Ad Creative: Pit different images or videos against each other. Does a clean product shot outperform a lifestyle photo?
- Ad Copy: Experiment with different headlines or calls to action. Is “Shop Now” pulling better than “Learn More”?
- Audience Targeting: Test two different audience segments to see which one delivers a lower Cost Per Acquisition (CPA).
By changing just one variable at a time, you can confidently attribute any performance shift to that specific change. It takes the emotion and guesswork out of the equation and lets the data lead the way.
The point of testing isn't just to find one "winning" ad. It's to build a deep, institutional knowledge of what your audience responds to. This creates a library of insights that makes all your future advertising smarter and more effective.
Creating a Clear View of Performance
To make sense of all this testing data, you need a way to monitor key trends without getting lost in the weeds. Complex spreadsheets are great, but they can be a nightmare for quick, day-to-day decisions. A simple, well-designed dashboard is often far more practical.
Your dashboard should zero in on the handful of KPIs that actually matter to your business goals. For an e-commerce brand, that might be ROAS, CPA, and Average Order Value.
Tracking these metrics over time helps you spot trends, pounce on opportunities, and catch problems before they become catastrophes. This disciplined approach connects your ad spend directly to real business outcomes. It helps you explain not just how much you spent, but how that spend drove tangible growth.
For more strategies on this, you can learn how to improve your marketing ROI and make every dollar work harder. By shifting from just reporting data to actively interpreting and acting on it, you build a powerful engine for sustainable growth.
Measuring Performance on Specialized Channels
 How to Measure Advertising Effectiveness: The Complete Guide
Most marketers live and breathe search and social media analytics, but what happens when your audience isn't there? As people spend more time in niche environments like mobile apps, podcasts, and connected TV, our measurement strategies have to follow them. These channels aren't just new places to put ads; they demand a completely different way of thinking about performance.
A click on a Google or Meta ad is pretty straightforward. But an ad that pops up inside a mobile game? The goal isn't just a click. Success might be an app download, a first-time in-app purchase, or even just reaching a new level in the game. The user’s context completely flips the script on what a valuable interaction looks like.
Shifting Metrics for In-App Advertising
The in-app advertising world is exploding, and for good reason. It works. A 2023 survey from Statista found a huge chunk of app users have downloaded another app they saw advertised within a different one. This is direct-response gold, proving we need to measure outcomes far beyond simple ad views.
To really understand what’s working, you have to track what users do after they install. The metrics that matter here are different:
- Install Rate: The raw percentage of users who install your app after seeing the ad.
- Cost Per Install (CPI): Your total ad spend divided by the number of new installs. Simple, but crucial.
- In-App Purchase (IAP) Rate: The percentage of those new users who actually spend money.
- User Retention: A big one. How many users stick around and keep using your app days or even weeks later?
Your focus has to shift from top-of-funnel clicks to bottom-of-funnel actions. An ad that drives thousands of installs but zero paying users isn't a win—it's a money pit. This is why deeper tracking is non-negotiable.
The Role of Attribution in Niche Channels
So, how do you connect those in-app actions back to a specific ad creative or campaign? It can get messy, fast. This is where a rock-solid attribution setup becomes your best friend. Tools like Mobile Measurement Partners (MMPs) are built specifically to bridge this gap, linking installs and post-install events back to the ads that drove them.
Just like with your web campaigns, this involves different attribution models to assign credit correctly. Getting this right helps you see which ad networks, creatives, and targeting strategies are delivering not just installs, but high-value, long-term users.
For a full deep dive into how these frameworks operate, check out our guide on marketing attribution models.
By mastering these specialized metrics, you can invest confidently in these high-growth channels, adapting your measurement strategy to wherever your audience is most engaged.
Of course. Here is the rewritten section, crafted to sound like it was written by an experienced human expert, following all the provided guidelines and examples.
Answering Your Toughest Ad Measurement Questions
Even when you have the best tools and a solid strategy, questions are going to pop up. Measuring ad effectiveness is a detailed process, and it’s completely normal to hit a few confusing spots along the way. Let's tackle some of the most common questions I hear from marketers trying to get a clear picture of their ad performance.
Getting these answers right can be the difference between making a costly mistake and unlocking a new level of reliable growth.
How Often Should I Actually Check My Ad Metrics?
The right answer really depends on your campaign's scale and goals. If you're running active, high-spend campaigns, you absolutely need to be checking in daily. This is the only way to quickly spot problems—like a sudden spike in your Cost Per Acquisition (CPA)—and make real-time adjustments before you burn through a significant chunk of your budget.
For lower-spend or brand awareness campaigns, a weekly review is usually enough to track trends without overreacting to minor daily ups and downs. The key, no matter what, is consistency.
Don’t fall into the trap of making drastic changes based on just a few hours of data. Ad performance can fluctuate wildly throughout the day. Give your campaigns at least 24-48 hours to stabilize after a change before you start drawing any firm conclusions.
Why Don't My Ad Platform and Analytics Match?
This is one of the most frustrating and common issues out there. You see 10 sales reported in your Google Ads account, but your analytics tool is only showing 7. What gives?
The discrepancy almost always boils down to two things:
- Attribution Models: Like we've covered, different platforms use different rulebooks. Google Ads might use a data-driven model that gives credit to multiple touchpoints, while your analytics tool could be set to last-click. Each one assigns credit differently, which naturally creates a mismatch.
- Tracking Differences: Ad platforms often count "view-through" conversions (when someone sees your ad but doesn't click, then converts later on their own). Most analytics tools, on the other hand, only track click-based conversions.
This is precisely why having a single source of truth is so critical. It’s designed to reconcile these differences and give you one reliable number you can actually trust.
What Is a “Good” Return on Ad Spend (ROAS)?
There’s no magic number here. A "good" ROAS is completely dependent on your profit margins, industry, and business model. It's not a one-size-fits-all metric.
A business selling high-margin digital products might be thrilled with a 3:1 ROAS ($3 in revenue for every $1 spent). But a company selling low-margin physical goods might need a 10:1 ROAS just to break even after factoring in the cost of goods, shipping, and all the other overhead.
The best approach? Calculate your break-even ROAS first. Any number above that is pure profit.
Ready to get a truly accurate, unified view of your ad performance and answer these questions with confidence? Cometly is the all-in-one attribution platform that acts as your single source of truth. Stop guessing and start knowing exactly what's driving your growth. Get started with Cometly today!


