
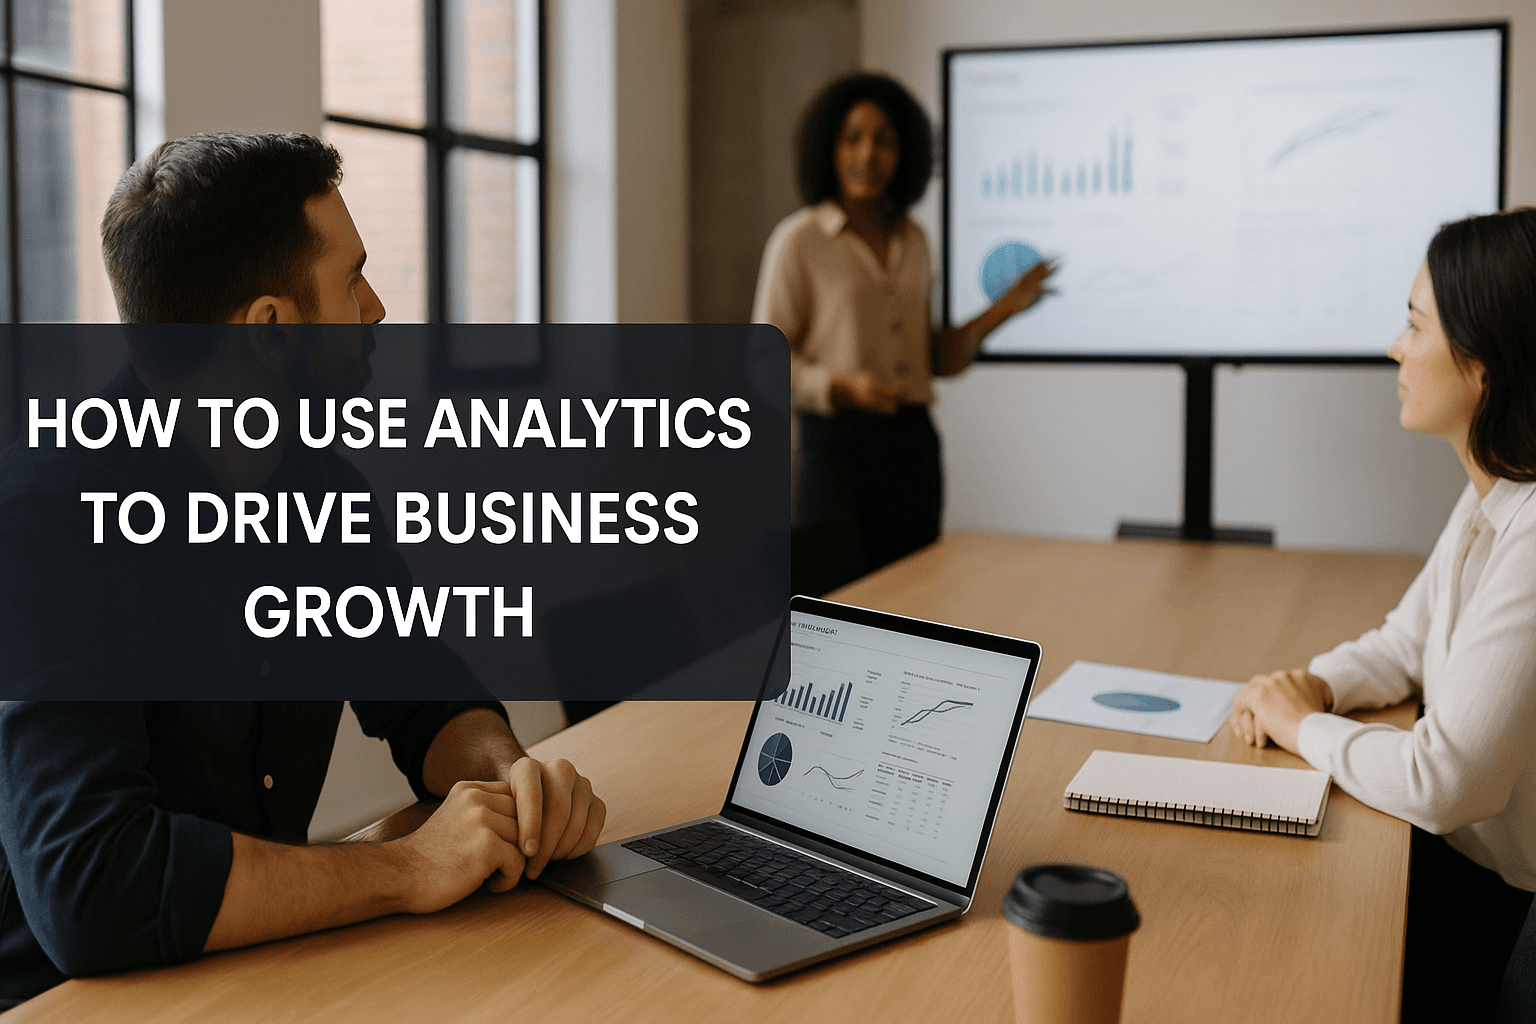
Unlocking Growth Potential Through Analytics
Imagine spending thousands on marketing campaigns, only to wonder if they’re truly effective. You're not alone. Many businesses face the challenge of measuring their marketing effectiveness, leaving them in the dark about what truly drives growth. Without a clear understanding of performance, opportunities for improvement can slip through the cracks. Analytics serves as the beacon in this fog, transforming raw data into actionable insights that can inform your business decisions.
Consider this: a recent study by McKinsey found that companies leveraging data-driven insights saw a 20% increase in their revenue. That’s the power of analytics! By mastering analytics, you can uncover insights that propel growth, enabling you to make informed decisions that optimize performance and maximize ROI.
As we explore the steps to leverage analytics, you'll discover how to truly drive business growth. Let's walk through how to do this step-by-step.
Preparing for Analytics Success
Essential Analytics Tools
To harness the power of analytics, you need the right tools. Choosing the right analytics tools is crucial for success. Popular options include marketing analytics, Google Analytics and Cometly, which provide functionalities like real-time data tracking and comprehensive reporting.
Many businesses have found that investing in these tools leads to better outcomes. For instance, a mid-sized business successfully utilized Google Analytics to track website performance, allowing them to optimize their user experience and significantly increase conversion rates.
Having the right tools simplifies data collection and analysis, making it easier to derive valuable insights. You can start by evaluating your needs and selecting tools that align with your business objectives.
Setting Up Your Analytics Account
Proper account setup is foundational for accurate data. A well-set account ensures seamless data tracking. Follow these steps to set up your Google Analytics account:
1. Go to the Google Analytics website and click on "Start for free."
2. Sign in with your Google account or create a new one.
3. Set up a property by entering your website’s name, URL, industry category, and reporting time zone.
4. Configure data sharing settings based on your preferences.
5. Get your tracking ID and implement it on your website to start tracking.
Make sure to test your setup to confirm that data is being collected accurately.
Data Accessibility Requirements
Ensuring data accessibility is a critical component that lays the groundwork for comprehensive analytics and effective decision-making. This process involves integrating various data sources that are necessary for thorough analysis and insights. By prioritizing the connection of your Customer Relationship Management (CRM) data with web analytics tools, you can achieve a holistic view of customer interactions. For instance, when organizations integrate their CRM systems with Google Analytics, they unlock valuable insights into customer behavior across multiple touchpoints. This integration allows businesses to track how customers interact with their brand at different stages of their journey, from initial awareness to post-purchase engagement.
Such insights enhance your analytics capabilities significantly, enabling more informed decision-making that can lead to improved customer experiences and increased conversion rates.
Moreover, many businesses find that integrating these data sources helps in identifying trends and patterns that may not be visible when data is siloed. By combining CRM data with web analytics, you can assess customer journeys and identify which marketing channels are driving the most engagement and sales. This understanding can inform your marketing strategies, allowing you to allocate resources more effectively and tailor your efforts to meet the needs of your target audience.
To successfully implement this integration, consider utilizing tools such as Zapier or Segment, which can facilitate the seamless flow of data between your CRM and analytics platforms. Additionally, it's crucial to ensure that your data privacy policies comply with regulations such as GDPR or CCPA when integrating and analyzing customer data. By prioritizing data accessibility and integration, you position your business for better insights and ultimately, greater growth.
Crafting Your Success Blueprint with KPIs
What Are KPIs and Why They Matter
Key Performance Indicators (KPIs) are critical metrics that serve as essential tools for measuring business success and effectiveness. They play a pivotal role in tracking the performance of various strategies and initiatives, helping organizations make informed adjustments to optimize their operations. Understanding and defining the right KPIs is crucial for targeted growth strategies, as they provide a clear framework for assessing business performance. Below is a list of some of the most important KPIs and an explanation of why they matter:
- Customer Acquisition Cost (CAC): This KPI measures the total cost of acquiring a new customer, including marketing expenses, sales team costs, and any other associated expenditures. Understanding CAC is vital as it helps businesses evaluate the efficiency of their marketing strategies and determine whether their customer acquisition efforts are sustainable in the long term.
- Conversion Rate: The conversion rate indicates the percentage of visitors to a website or users of an app that complete a desired action, such as making a purchase or signing up for a newsletter. A higher conversion rate often reflects effective marketing and user experience strategies, which can lead to increased revenue.
- Customer Lifetime Value (CLV): CLV estimates the total revenue a business can expect from a customer over the course of their relationship. This KPI is crucial for understanding the long-term value of acquiring customers and helps in making strategic decisions about marketing budgets and customer retention efforts.
- Return on Investment (ROI): ROI measures the profitability of an investment relative to its cost. This KPI is essential for assessing the effectiveness of marketing campaigns and other business initiatives, allowing companies to allocate resources efficiently.
- Churn Rate: The churn rate calculates the percentage of customers who stop using a product or service during a specific timeframe. A high churn rate can indicate dissatisfaction among customers and signal the need for improvement in product offerings or customer service.
- Net Promoter Score (NPS): NPS gauges customer loyalty and satisfaction by asking customers how likely they are to recommend a company’s products or services. This KPI can provide valuable insights into customer sentiment and potential areas for improvement.
For instance, a company that defined clear KPIs for its marketing campaigns was able to pinpoint underperforming areas and optimize their efforts based on the insights gained. By focusing on improving their conversion rates and reducing customer acquisition costs, they successfully increased their ROI, demonstrating the tangible benefits of effective KPI management. Ultimately, leveraging KPIs allows businesses to drive growth through informed decision-making and strategic adjustments.
Collecting and Integrating Your Data for Insight
Methods of Data Collection
Diverse data collection methods enhance insights. Businesses often utilize website tracking, surveys, and social media analytics to gather data. For example, a company improved customer insights significantly through customer feedback surveys, allowing them to adapt their offerings to better meet consumer needs.
Integrating Data Sources for a Unified View
Integration is key for comprehensive analytics. Techniques like ETL (Extract, Transform, Load) can help connect different data sources, providing a unified view of all relevant metrics. This integration allows for more accurate analysis and better-informed decisions.
Uncovering Insights: Analyzing Your Data
Overview of Data Analysis Techniques
Various techniques provide different insights from data. Methods like cohort analysis, trend analysis, and segmentation can reveal critical insights into customer behavior. For instance, a business that applied
Diverse data collection methods are essential for enhancing insights that drive business growth. Businesses often utilize various techniques such as website tracking, surveys, and social media analytics to gather meaningful data. For instance, a company that implemented customer feedback surveys was able to significantly improve its customer insights, allowing it to adapt its offerings to better meet consumer needs. This approach exemplifies how direct customer feedback can lead to actionable changes in product development and marketing strategies.
Moreover, organizations are increasingly turning to data lakes and data warehouses to store and analyze their data comprehensively. Data lakes allow businesses to store vast amounts of unstructured data, which can be beneficial for exploratory analysis and machine learning applications. In contrast, data warehouses provide structured data storage optimized for query performance and reporting, making them ideal for business intelligence and analytics tasks. By leveraging both data lakes and data warehouses, companies can create a robust data architecture that supports diverse analytical needs and enhances decision-making capabilities.
As an alternative to traditional methods, platforms like Cometly offer integrated solutions that streamline data collection and analysis. Cometly combines the functionalities of various data sources, enabling businesses to track performance metrics in real-time and derive actionable insights efficiently. By utilizing Cometly, companies can enhance their data-driven strategies, ensuring that they respond effectively to changing market demands and optimize their overall business performance.
 Cometly vs HubSpot Marketing Hub: The Real-Time Data Performance Marketers Can’t Ignore
was able to identify patterns in customer retention, significantly improving their engagement strategies.
Tools for Data Analysis
Analysis tools streamline the process of deriving insights. Platforms like Cometly facilitate advanced data analysis, allowing companies to extract actionable insights quickly. Using the right tools enhances the efficiency of data analysis, leading to better decision-making.
Advanced Strategies for Optimization
Refining Your Marketing Strategies
Analytics can significantly enhance marketing effectiveness. Data informs adjustments to marketing campaigns, ensuring that resources are allocated to the most effective channels. A business that refined its strategies based on performance metrics was able to increase its overall marketing ROI.
Navigating Challenges: Troubleshooting Analytics Issues
Identifying Common Analytics Issues
Knowing common pitfalls helps in proactive management. Frequent problems include data discrepancies and poor integration, which can lead to misleading insights. Awareness of potential issues allows for better preparation, ensuring that analytics efforts yield accurate results.
Validating Success: Measuring ROI and Growth
Key Metrics to Measure Success
Identifying the right metrics is essential for evaluating growth. Metrics such as conversion rates, customer acquisition costs, and lifetime value provide valuable insights into performance. A business that successfully tracked these metrics was able to optimize its marketing strategy and achieve substantial growth.
Bringing It All Together: Your Analytics Roadmap
Recap of the Process
In summary, the process of using analytics to drive business growth involves several key steps:
1. Identify the right tools and ensure proper setup.
2. Define KPIs that align with your business objectives.
3. Collect and integrate your data effectively.
4. Analyze your data to uncover actionable insights.
5. Optimize your marketing strategies based on findings.
Time Estimates for Implementation
Realistic timeframes for each step can vary based on business size and complexity:
1. Tool selection and setup: 1-2 weeks
2. KPI definition: 1 week
3. Data collection and integration: 2-4 weeks
4. Data analysis: Ongoing
5. Optimization: Continuous
Encouraging Future Exploration
Analytics is an evolving field, and continuous learning is key. Consider exploring advanced techniques and tools such as machine learning for deeper insights. Joining webinars or taking courses on analytics can further enhance your understanding and application of these concepts.
By following these steps, you will be well on your way to effectively using analytics to drive business growth. Don't wait—start harnessing the power of analytics today!
If you're ready to take the next step in optimizing your marketing strategies with confidence, get your free demo of our powerful analytics tools now!


