
In today's digital age, marketing professionals rely heavily on data-driven insights to make informed decisions and measure the success of their marketing efforts. One crucial tool in their arsenal is the marketing analytics dashboard. This comprehensive guide will provide you with a thorough understanding of marketing analytics dashboards, their components, setup process, data interpretation, and maintenance.
Understanding Marketing Analytics Dashboard
Marketing analytics dashboard refers to a visual representation of key marketing metrics and data points, designed to provide marketers with real-time insights into their campaigns' performance. By consolidating multiple data sources into a single interface, marketers can track and analyze various aspects of their marketing activities, ultimately improving decision-making and driving results.
When delving into the realm of marketing analytics dashboards, it's essential to grasp the intricate web of data visualization and interpretation that underpins their functionality. These dashboards act as a compass for marketers, guiding them through the vast sea of information to pinpoint valuable insights that can steer their strategies towards success. With customizable features and interactive elements, these dashboards offer a dynamic platform for marketers to navigate the complexities of modern marketing landscapes.
Defining Marketing Analytics Dashboard
A marketing analytics dashboard is a customizable tool that allows marketers to monitor, measure, and analyze the performance and effectiveness of their marketing strategies. It provides a centralized hub for data visualization, enabling marketers to gain valuable insights into crucial metrics such as conversions, website traffic, social media engagement, and more.
Within the intricate framework of a marketing analytics dashboard lies a treasure trove of information waiting to be unearthed. Marketers can harness the power of data visualization to transform raw numbers into actionable strategies, unlocking the potential for targeted campaigns and enhanced customer engagement. By leveraging the capabilities of these dashboards, marketers can navigate the ever-evolving digital landscape with precision and agility, adapting their tactics in real-time to stay ahead of the curve.
Importance of Marketing Analytics Dashboard
The importance of a marketing analytics dashboard cannot be overstated. It empowers marketers to make data-driven decisions by providing them with real-time data and actionable insights. With a dashboard, marketers can quickly identify trends, uncover opportunities, and optimize their marketing efforts to maximize ROI. Moreover, it facilitates effective communication and collaboration among team members, aligning everyone towards common marketing goals.
 The Ultimate Guide to Marketing Analytics Dashboard
As the heartbeat of modern marketing strategies, analytics dashboards serve as the nerve center where creativity meets data-driven precision. They enable marketers to not only measure the impact of their campaigns but also to fine-tune their approaches based on real-time feedback. By fostering a culture of continuous improvement and innovation, these dashboards empower marketing teams to navigate the complexities of the digital landscape with confidence and clarity.
Key Components of a Marketing Analytics Dashboard
A well-designed marketing analytics dashboard consists of various key components that collectively provide a comprehensive overview of marketing performance. Let's examine these components in detail.
Metrics to Track
The first essential component of a marketing analytics dashboard is the metrics to track. These metrics vary depending on the individual marketing goals and objectives. Common metrics include website traffic, conversion rate, customer acquisition cost (CAC), customer lifetime value (CLV), click-through rate (CTR), social media engagement, email open rate, and more. By closely monitoring these metrics, marketers can gauge the effectiveness of their campaigns and make data-driven adjustments as needed.
Moreover, it is crucial to differentiate between leading and lagging indicators when selecting metrics to track. Leading indicators, such as email open rates and social media engagement, provide insights into future performance trends. On the other hand, lagging indicators, like customer acquisition cost and customer lifetime value, offer a retrospective view of past marketing efforts. By incorporating a mix of leading and lagging indicators, marketers can better anticipate outcomes and optimize their strategies.
Custom Visual Elements in Dashboard
 The Ultimate Guide to Marketing Analytics Dashboard
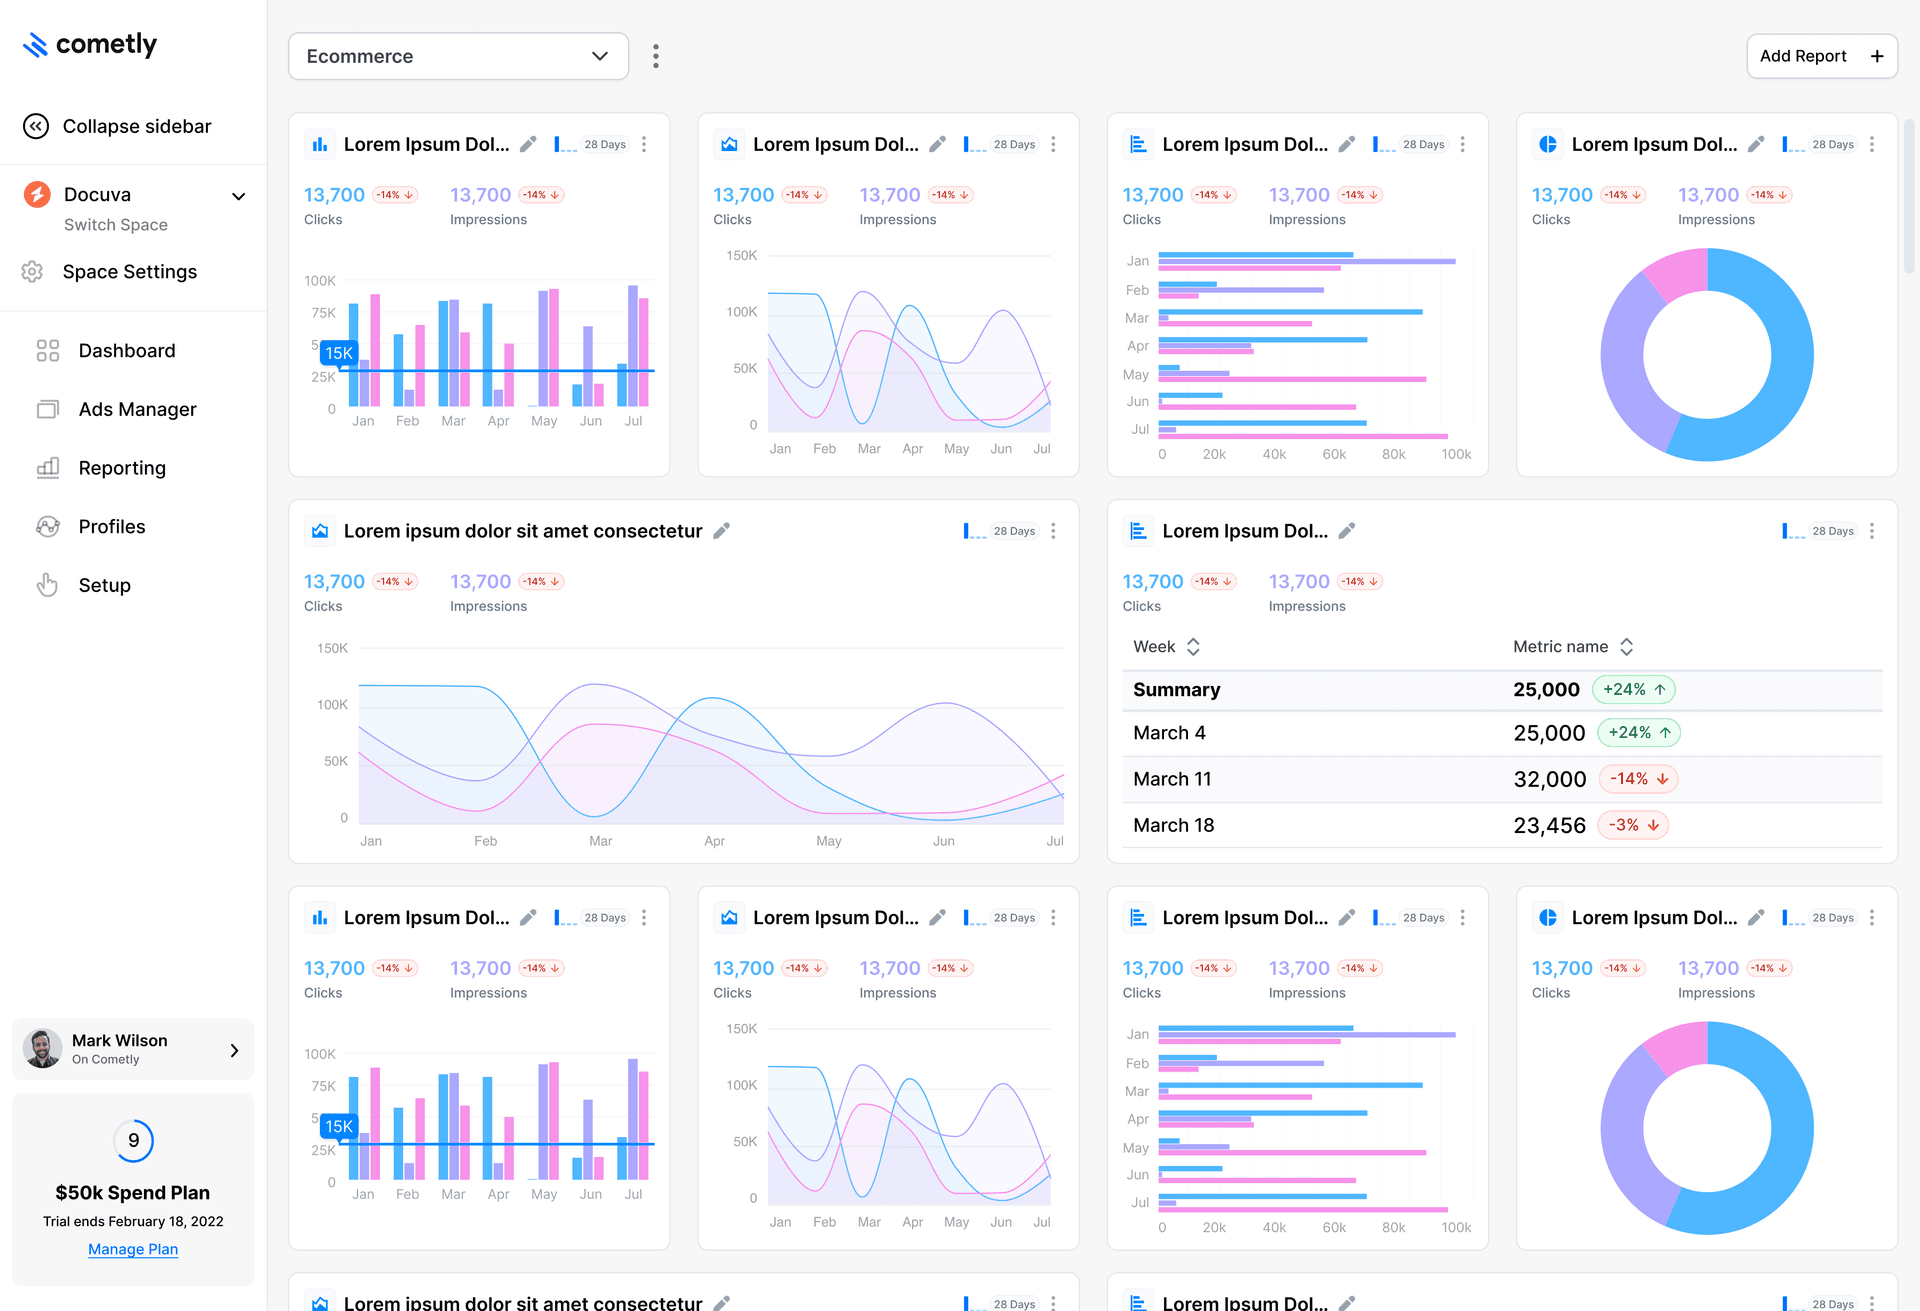
Cometly Report Builder Marketing Analytics Options
Visual elements play a crucial role in making a marketing analytics dashboard informative and easily digestible. Graphs, charts, and tables should be used to present data in a visually appealing and intuitive manner. By leveraging different visualization techniques, marketers can quickly identify patterns, compare performance across different channels, and identify areas for improvement.
In addition to traditional graphs and charts, heat maps and infographics can also enhance the visual appeal of a marketing analytics dashboard. Heat maps visually represent data using color gradients, allowing marketers to spot trends and anomalies at a glance. Infographics, on the other hand, combine text and visuals to convey complex information in a simplified and engaging format. By incorporating a variety of visual elements, marketers can create a dynamic and interactive dashboard that facilitates better decision-making.
Setting Up Your Marketing Analytics Dashboard
Now that we understand the importance and components of a marketing analytics dashboard, let's explore the steps involved in setting up your own dashboard.
Having a well-structured marketing analytics dashboard is crucial for making informed decisions and optimizing marketing strategies. It serves as a centralized hub for monitoring key performance indicators (KPIs), tracking campaign performance, and identifying areas for improvement. By setting up a customized dashboard, you can streamline data analysis processes, enhance collaboration among team members, and drive data-driven decision-making within your organization.
Choosing the Right Dashboard Software
The first step in setting up your marketing analytics dashboard is to select the right dashboard software. There are numerous options available in the market, each offering varying levels of customization, integration capabilities, and pricing structures. Consider factors such as data sources, ease of use, scalability, and compatibility with your existing marketing tools before making a decision.
It's essential to choose a dashboard software that aligns with your organization's goals and objectives. Look for features such as real-time data updates, customizable dashboards, and user-friendly interfaces to ensure a seamless user experience. Conduct thorough research, read reviews, and even request demos to evaluate the software's suitability for your specific marketing analytics needs.
Customizing Your Dashboard
Once you have chosen the dashboard software, it's time to customize your dashboard according to your specific needs and goals. Identify the key metrics you want to track and determine the visualization techniques that best represent the data. Additionally, consider the needs of different stakeholders within your organization and tailor the dashboard to accommodate their requirements.
Customization is key to creating a dashboard that provides actionable insights and facilitates data-driven decision-making. Experiment with different layouts, color schemes, and data visualization formats to find the most effective way to present information. By involving key stakeholders in the customization process, you can ensure that the dashboard meets the diverse needs of your marketing team, executives, and other relevant parties.
Interpreting Data from Your Dashboard
Having a marketing analytics dashboard is only valuable if you can effectively interpret the data it presents. Let's explore the best practices for reading and understanding dashboard data.
Understanding the nuances of the data displayed on your marketing analytics dashboard is crucial for making informed decisions. Beyond just looking at the numbers, delve deeper into the patterns and insights that can be gleaned from the data. Consider conducting A/B tests to measure the impact of different marketing strategies and campaigns, allowing you to refine your approach based on empirical evidence.
Reading and Understanding Dashboard Data
When interpreting data from your marketing analytics dashboard, it's important to go beyond surface-level observations. Look for trends, anomalies, and correlations between different metrics. Analyze the data within the context of your marketing goals and objectives. Additionally, consider the impact of external factors such as seasonality, industry trends, and changes in customer behavior.
Furthermore, leverage data visualization tools within your dashboard to enhance your understanding. Graphs, charts, and heat maps can provide a visual representation of complex data sets, making it easier to identify patterns and outliers at a glance. Utilizing these visual aids can help you communicate insights more effectively to stakeholders and team members.
Making Data-Driven Decisions
One of the primary purposes of a marketing analytics dashboard is to facilitate data-driven decision-making. Use the insights gained from the dashboard to optimize your marketing strategies, allocate resources, and identify areas for improvement. Regularly review and update your marketing tactics based on the data trends and performance indicators observed on the dashboard.
Remember that data is only as valuable as the actions you take based on it. Continuously track the outcomes of your decisions and measure their impact on key performance indicators. By iterating on your strategies and refining your approach based on data-driven insights, you can drive continuous improvement and achieve greater success in your marketing efforts.
Maintaining and Updating Your Dashboard
Maintaining and updating your marketing analytics dashboard is crucial for ensuring its effectiveness in the long run. Let's explore some essential practices in this regard.
Regular Dashboard Review
Regularly review your marketing analytics dashboard to ensure it remains relevant and aligned with your marketing goals and objectives. As your marketing strategies evolve, update the metrics and visualizations accordingly. Engage your team members in the review process to gather valuable insights and fine-tune the dashboard to meet their needs.
Adapting Your Dashboard to Changing Marketing Goals
Marketing goals and objectives change over time, and your dashboard should reflect these changes. As you set new marketing goals or adjust existing ones, reevaluate the metrics and visualizations on your dashboard. Ensure that it continues to provide meaningful insights and guides your decision-making process effectively.
In conclusion, a marketing analytics dashboard is a powerful tool that enables marketers to visualize, track, and analyze their marketing efforts. By leveraging the components discussed in this guide and adopting best practices in setup, interpretation, and maintenance, you can gain valuable insights and drive better marketing outcomes. Remember, accurate marketing attribution is crucial for effective data analysis. Consider using Cometly, a leading marketing attribution platform, to ensure you have the most accurate picture of your marketing performance.
Ready to elevate your marketing analytics and drive unparalleled growth? Cometly's AI-driven attribution platform is your key to unlocking precise marketing attribution, proving ROI, and slashing customer acquisition costs. With Cometly, you gain instant clarity on ad campaign performance, deep insights into customer journeys, and the power to feed ad platform AI for optimal ad optimization. Embrace a unified marketing and sales dataset with Cometly and truly understand the source of your conversions and revenue. Don't miss this opportunity to transform your marketing strategy. Book A Demo today and witness the Cometly advantage firsthand!


