In today's hyper-competitive landscape, guesswork is a luxury no marketer can afford. The difference between a breakout campaign and a wasted budget often comes down to one thing: how well you understand your data. But with a sea of metrics and endless dashboards, where do you even begin? The answer lies in mastering specific marketing analytics techniques that transform raw data into strategic, revenue-driving decisions.
This article moves beyond surface-level metrics to provide a definitive roundup of the 10 most impactful marketing analytics techniques you need to know. We will break down what each technique is, why it matters, and how to implement it with practical, real-world examples, ensuring you can select the right tools for the right job. To truly transform data into your most powerful asset, it is essential to understand how various fields leverage analytics, for instance, by extracting valuable insights from higher education data analytics to improve student engagement and outcomes. Similarly, marketers can use these powerful methods to enhance customer engagement and drive business growth.
From predicting customer lifetime value and precisely attributing sales to the right channels, to segmenting your audience for hyper-personalized campaigns, this guide provides the clarity you need. Whether you're a startup founder optimizing ad spend or a CMO requiring sophisticated reporting, this is your roadmap to unlocking data-driven growth. We will cover:
- Customer Lifetime Value (CLV) Analysis
- Attribution Modeling
- Cohort Analysis
- Marketing Mix Modeling (MMM)
- Customer Segmentation Analysis
- A/B and Multivariate Testing
- Predictive Analytics
- Social Media Analytics
- Cross-Channel Analytics
- Real-Time Analytics and Dashboard Reporting
1. Customer Lifetime Value (CLV) Analysis
Customer Lifetime Value (CLV) is a powerful predictive metric that forecasts the total net profit a business can expect from a single customer over the entire duration of their relationship. Rather than focusing on a single transaction, this marketing analytics technique shifts the perspective to the long-term value of each customer, providing a crucial benchmark for strategic decisions. It helps marketers justify investments in customer acquisition and retention by clarifying how much a customer is truly worth.
 10 Key Marketing Analytics Techniques for 2025
This forward-looking analysis allows businesses to identify their most valuable customer segments and tailor experiences to maximize loyalty and profitability. Understanding CLV is fundamental to building a sustainable growth model. If you want to dive deeper into how analytics drives sales, you can learn more about using marketing analytics to boost sales on cometly.com.
Why It's a Top Technique
CLV analysis directly connects marketing efforts to long-term revenue. It moves beyond short-term metrics like click-through rates or even single-purchase conversion rates. By knowing what a customer is worth, you can confidently set your Customer Acquisition Cost (CAC) limits, ensuring profitability for every dollar spent on advertising. For instance, Starbucks uses CLV to structure its famous rewards program, offering personalized incentives that encourage repeat purchases and increase the overall value of each loyalty member. Similarly, Netflix's massive content investments are guided by CLV models that predict how new shows will impact subscriber retention and acquisition.
How to Implement CLV Analysis
Getting started with CLV doesn't require a data science team. You can begin with a simple, historical model and advance from there.
- Start Simple: Calculate a basic historical CLV by multiplying the Average Purchase Value by the Average Purchase Frequency and then by the Average Customer Lifespan. This provides an immediate baseline.
- Segment Your Customers: Don't treat all customers as a single group. Analyze CLV for different segments based on acquisition channel, first product purchased, or demographic data to uncover high-value groups.
- Set Acquisition Thresholds: Use your CLV calculation to define your maximum allowable CAC. If the average CLV is $500, you know you can spend up to that amount to acquire a similar customer and still break even over their lifetime.
- Update Regularly: Customer behavior changes. Refresh your CLV models with new data quarterly or semi-annually to ensure your marketing strategies are based on current trends, not outdated assumptions.
2. Attribution Modeling
Attribution modeling is a marketing analytics technique used to determine how credit for sales and conversions is assigned to touchpoints along a customer's journey. Instead of giving 100% of the credit to the final click, this methodology analyzes the entire conversion path to understand which channels, campaigns, and interactions contribute most effectively to desired outcomes. It enables marketers to move beyond simplistic, last-touch reporting and make smarter budget allocation decisions based on a holistic view of performance.
 10 Key Marketing Analytics Techniques for 2025
This analytical framework is crucial for optimizing complex, multi-channel marketing strategies. It provides the data-driven clarity needed to justify spend on upper-funnel activities that build awareness, not just bottom-funnel actions that capture conversions. If you're looking to master this concept, you can learn more about how to measure marketing attribution on cometly.com.
Why It's a Top Technique
Attribution modeling provides a more accurate and fair assessment of marketing ROI. It prevents the common pitfall of overvaluing channels like branded search or direct traffic while undervaluing introductory touchpoints like social media or display ads. For example, Adobe’s Attribution IQ helps companies like Home Depot understand cross-channel performance, revealing how a blog post view might influence a future in-store purchase. Likewise, Facebook's attribution tools have shown major retailers how social media ads drive offline sales, proving the value of channels that don't always generate immediate clicks but significantly influence later conversions.
How to Implement Attribution Modeling
Implementing attribution modeling involves choosing a model that fits your business and then using its insights to guide your strategy.
- Test Multiple Models: Don't stick to the default last-click model. Compare it against others like linear, time-decay, or data-driven models to see how channel credit shifts. This reveals different perspectives on your marketing mix's effectiveness.
- Align the Attribution Window: Set your attribution or lookback window to match your typical sales cycle. A B2B SaaS company with a 90-day sales cycle needs a longer window than an e-commerce brand selling low-cost consumer goods.
- Combine with Incrementality: Use attribution data alongside incrementality testing (e.g., lift tests). While attribution assigns credit, incrementality proves causality, validating that your marketing efforts are truly driving additional business.
- Account for Offline Touchpoints: Whenever possible, integrate offline data from events, direct mail, or store visits into your model using CRM data or custom tracking to get a complete picture of the customer journey.
3. Cohort Analysis
Cohort analysis is a behavioral analytics technique that breaks down data into groups of people with common characteristics over time. Instead of looking at all users as one massive group, this method segments them into related "cohorts" based on a shared experience, such as their sign-up date, first purchase month, or acquisition channel. By tracking these distinct groups over time, marketers can uncover critical patterns in behavior, engagement, and retention.
 10 Key Marketing Analytics Techniques for 2025
This powerful marketing analytics technique helps you understand how specific events or product changes affect user behavior long-term. For example, did users acquired during a major Q2 campaign retain better than those from Q1? Cohort analysis provides the answers, allowing for more precise, data-driven strategy adjustments.
Why It's a Top Technique
Cohort analysis isolates variables to provide clear cause-and-effect insights that are often hidden in aggregate data. It helps you understand if customer retention is genuinely improving or if positive metrics are just a byproduct of acquiring more new users. For instance, Spotify uses cohort analysis to compare the long-term engagement and subscription rates of users who signed up via a student discount versus a standard trial. Similarly, Airbnb can analyze cohorts of hosts who joined in different years to see how platform changes have impacted their listing activity and success over time. This technique is fundamental to the Lean Startup methodology, helping businesses validate product changes and marketing strategies quickly.
How to Implement Cohort Analysis
You can start performing cohort analysis using tools like Google Analytics, Mixpanel, or even a spreadsheet with customer data.
- Define Meaningful Cohorts: Group users based on events that matter to your business. The most common is an acquisition cohort (e.g., all users who signed up in January), but you can also use behavioral cohorts (e.g., users who first used a specific feature).
- Track Key Metrics Over Time: Don't stop at just retention. Track metrics like repeat purchase rate, average revenue per user (ARPU), or feature adoption for each cohort over subsequent weeks or months to get a complete picture.
- Validate Product and Marketing Changes: Before and after a major website redesign or a new feature launch, compare the behavior of the "pre-launch" cohort with the "post-launch" cohort. This shows the true impact of your changes on user engagement.
- Visualize the Data: Use heatmaps or line graphs to visualize your cohort data. A "triangle" chart showing declining retention over time is a classic and highly effective way to spot trends and compare cohort performance at a glance.
4. Marketing Mix Modeling (MMM)
Marketing Mix Modeling (MMM) is a statistical analysis technique that uses regression modeling to quantify the impact of various marketing activities on sales or other key performance indicators. This top-down approach examines aggregated historical data to determine the incremental contribution of each channel, from TV and radio to digital ads and public relations. MMM helps marketers answer the critical question: "What is the return on investment for each dollar I spend?"
 10 Key Marketing Analytics Techniques for 2025
By providing a holistic view of the entire marketing ecosystem, this powerful marketing analytics technique enables businesses to optimize their budget allocation and strategic planning. It moves beyond last-click attribution to understand how offline and online channels work together to drive business outcomes.
Why It's a Top Technique
MMM offers a comprehensive, high-level view that is essential for strategic budget allocation. While other techniques focus on granular user-level data, MMM excels at measuring the impact of broad-reach, non-digital channels that are difficult to track individually. For example, consumer goods giant Procter & Gamble uses MMM to optimize its massive annual advertising spend across its portfolio of brands. Similarly, Coca-Cola employs MMM to understand the combined effectiveness of its TV campaigns, digital media, and major sponsorship investments, ensuring its marketing mix is perfectly balanced for maximum impact.
How to Implement MMM
Implementing Marketing Mix Modeling is a data-intensive process, but it provides unparalleled strategic insights into budget effectiveness.
- Gather Comprehensive Data: Collect consistent, aggregated time-series data for all marketing activities (e.g., weekly ad spend by channel) and business outcomes (e.g., weekly sales). Ensure high data quality and consistency.
- Incorporate External Factors: Include variables beyond your control, such as competitor spending, seasonality, economic indicators, and even weather patterns. This helps isolate the true impact of your marketing efforts.
- Validate Your Model: Whenever possible, validate the results of your MMM with controlled experiments or incrementality testing. This confirms that the correlations found by the model represent actual causation.
- Update and Refine: The market is constantly changing. Your MMM is not a one-time project. Update your models regularly, ideally quarterly or semi-annually, to reflect new channels, changing consumer behaviors, and current market dynamics.
5. Customer Segmentation Analysis
Customer Segmentation Analysis is the practice of dividing a broad customer base into distinct, smaller groups of consumers with similar needs, characteristics, or behaviors. Instead of a one-size-fits-all approach, this marketing analytics technique allows businesses to tailor their strategies, messaging, and product offerings to resonate deeply with specific subsets of their audience. It transforms generic marketing into a personalized conversation, driving higher engagement and conversion rates.
By understanding the unique profiles of different segments, marketers can allocate resources more effectively, focusing their efforts where they will have the greatest impact. This method is fundamental to developing relevant and efficient marketing campaigns that speak directly to the motivations and pain points of each customer group.
Why It's a Top Technique
Segmentation analysis is powerful because it bridges the gap between raw data and actionable strategy. It moves beyond broad market assumptions and provides a clear roadmap for personalization at scale. By grouping customers, you can answer critical questions like "Who are our most loyal customers?" or "Which group is most likely to churn?" For example, Sephora's celebrated Beauty Insider program segments members into tiers (Insider, VIB, Rouge) based on their annual spending. This allows the company to offer increasingly valuable perks and personalized product recommendations, fostering loyalty and encouraging higher spend. Likewise, Nike segments its audience by activity (running, basketball) and commitment level (casual enthusiast, serious athlete) to deliver hyper-targeted content and gear.
How to Implement Customer Segmentation Analysis
Implementing this technique is an iterative process that refines your understanding of your audience over time. You can start with basic methods and build complexity as you gather more data.
- Combine Segmentation Variables: Don't rely on a single data type. Combine demographic data (age, location), psychographic data (lifestyle, values), and behavioral data (purchase history, engagement) for richer, more accurate customer profiles.
- Leverage the RFM Model: A great starting point is Recency, Frequency, and Monetary (RFM) analysis. This method segments customers based on how recently they purchased, how often they purchase, and how much they spend, quickly identifying your best customers.
- Ensure Segments Are Actionable: A segment is only useful if you can act on it. Ensure each group is distinct, measurable, accessible, and large enough to be profitable. Avoid creating segments that are too niche to target effectively.
- Test and Validate: After defining your segments, test them. Run A/B tests with different messaging, offers, or channels for each group to validate your assumptions and measure the uplift in performance. Regularly refresh your models to adapt to changing customer behaviors.
6. A/B Testing and Multivariate Testing
A/B testing, along with its more complex counterpart multivariate testing, is a core experimental methodology in marketing analytics. These techniques involve comparing two or more versions of a single marketing element, like an email subject line or a landing page headline, to determine which one performs better against a specific goal. By systematically testing variables in a controlled environment, marketers can make data-driven decisions that incrementally but powerfully optimize campaign performance.
These controlled experiments are fundamental to continuous improvement. Instead of relying on guesswork or intuition, A/B testing provides empirical evidence of what resonates most with an audience. This scientific approach to optimization is a cornerstone of modern marketing analytics techniques, enabling teams to refine every touchpoint of the customer journey for maximum impact.
Why It's a Top Technique
A/B testing provides clear, causal links between changes and outcomes, eliminating ambiguity. When you test a single variable, you can confidently attribute any uplift in performance, like higher click-through rates or conversions, directly to that change. This granular level of insight allows for rapid, iterative improvements. For example, Booking.com famously runs thousands of simultaneous A/B tests to optimize every aspect of its user experience, from button colors to search filter layouts. Similarly, HubSpot continuously tests its email subject lines, which has led to a reported 22% increase in open rates by identifying the most effective wording and formats.
How to Implement A/B and Multivariate Testing
Effective testing is about discipline and process, not just running random experiments.
- Test One Variable at a Time: In a classic A/B test, isolate a single change (the "variable") between your control (version A) and your variation (version B). This ensures you can attribute the performance difference directly to that specific change.
- Calculate Statistical Significance: Before launching a test, determine the required sample size and run duration to achieve statistical significance. This prevents you from making decisions based on random chance rather than true user preference.
- Run Tests for Full Business Cycles: To avoid misleading results caused by daily or weekly fluctuations, run tests long enough to capture a full business cycle. For many B2C companies, this means running a test for at least one full week.
- Document and Share Learnings: Create a repository of all test results, including both wins and losses. Sharing these insights across teams prevents redundant tests and builds a collective intelligence about what works for your audience.
7. Predictive Analytics and Machine Learning
Predictive Analytics and Machine Learning are advanced marketing analytics techniques that use historical data, statistical algorithms, and AI models to forecast future outcomes. Instead of only reporting on past events, these methods identify the likelihood of future customer behaviors, market trends, and campaign results. This allows marketers to move from reactive to proactive strategies, making data-driven decisions that anticipate customer needs and optimize for future success.
This forward-looking capability empowers businesses to automate and refine critical marketing functions, from personalizing user experiences to optimizing ad spend. If you want to explore this topic further, you can learn more about predictive analytics in marketing on cometly.com.
Why It's a Top Technique
Predictive analytics and machine learning represent the frontier of data-driven marketing, enabling a level of personalization and efficiency previously unattainable. These models can sift through vast datasets to uncover subtle patterns that inform high-stakes decisions. For example, Amazon’s legendary recommendation engine, which reportedly drives over a third of its revenue, uses predictive algorithms to suggest products customers are likely to buy. Similarly, Uber employs predictive models for demand forecasting and dynamic pricing, ensuring driver availability aligns with rider demand in real time.
How to Implement Predictive Analytics and Machine Learning
Integrating these advanced techniques is an iterative process that can start small and scale. You don't need a massive data science department from day one.
- Start with Simple Models: Begin with foundational models like lead scoring or churn prediction. These offer clear business value and can be built using common tools and platforms before graduating to more complex algorithms.
- Ensure High-Quality Data: The mantra "garbage in, garbage out" is paramount here. Your models are only as good as the data they are trained on. Prioritize clean, accurate, and comprehensive data collection and preparation.
- Validate Model Performance: Regularly test your models against real-world business outcomes to ensure they remain accurate and relevant. Performance can degrade over time as customer behavior or market conditions change.
- Maintain Human Oversight: Always keep a human in the loop. Models can develop biases or produce unexplainable results. Human oversight is critical for interpreting outputs, detecting anomalies, and ensuring ethical application.
8. Social Media Analytics
Social Media Analytics is the practice of collecting and analyzing data from social platforms to measure performance, understand audience behavior, and inform marketing strategy. More than just counting likes and followers, this marketing analytics technique involves diving into engagement metrics, sentiment analysis, and social listening to track brand perception and emerging trends. It transforms raw social data into actionable business intelligence.
This analysis provides direct feedback on what content resonates with your audience, how your brand is perceived, and where conversations are happening. By systematically tracking these metrics, marketers can optimize their content strategy, improve customer service, and even uncover new product ideas. For SaaS companies, this is especially crucial, as you can learn more about social media marketing for SaaS on cometly.com.
Why It's a Top Technique
Social Media Analytics offers a real-time pulse on your market and brand health. It’s one of the most direct ways to hear the "voice of the customer" at scale, providing immediate insights that can guide everything from creative campaigns to crisis management. For example, Wendy's famously uses Twitter analytics to refine its witty, viral tone and engage directly with customers, boosting brand affinity. Similarly, Airbnb actively monitors social sentiment across platforms to quickly identify and address customer experience issues before they escalate, protecting its brand reputation.
How to Implement Social Media Analytics
Effective social analytics goes beyond the native tools offered by each platform. A strategic approach is required to turn data into decisions.
- Combine Metrics: Don't just track quantitative metrics like reach and engagement rate. Combine them with qualitative insights from sentiment analysis and comment monitoring to understand the context and feeling behind the numbers.
- Benchmark Competitors: Track the social performance of your direct competitors. Analyze their top-performing content, engagement rates, and audience growth to set realistic benchmarks and identify opportunities they may be missing.
- Inform Broader Strategy: Use insights from social media to fuel other marketing efforts. If a certain topic or angle performs exceptionally well on Instagram, consider developing it into a blog post, email campaign, or even a video ad.
- Set Up Automated Alerts: Use social listening tools like Mention or Brandwatch to create automated alerts for your brand name, key products, and executive names. This allows for rapid response to both positive and negative mentions, helping manage your reputation proactively.
9. Cross-Channel Analytics
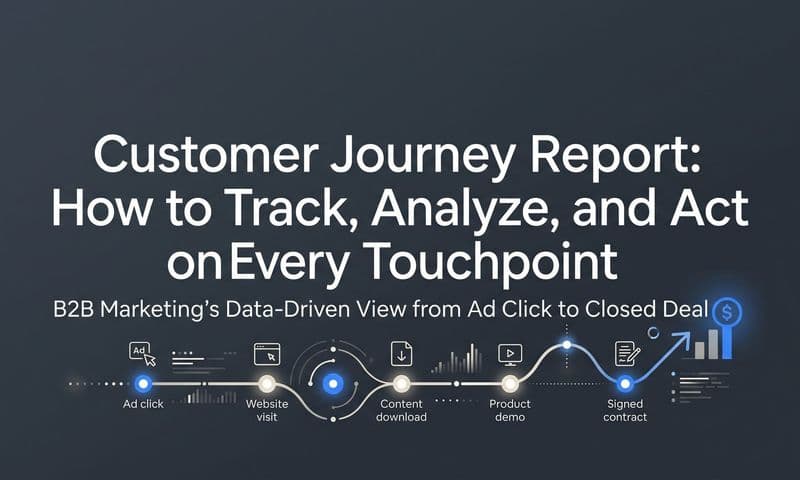
Cross-Channel Analytics is an integrated approach to measuring and analyzing customer interactions across multiple marketing channels and touchpoints. Instead of viewing performance in silos like social media, email, or search ads, this technique provides a unified view of the entire customer journey. It helps marketers understand how different channels work together to influence decisions, drive conversions, and build customer loyalty.
This holistic perspective is essential in a world where customers switch between devices and platforms seamlessly. By connecting disparate data points, businesses can see the full story of how a customer discovers, considers, and purchases a product. If you want to master this comprehensive view, you can learn more about how to effectively track the customer journey on cometly.com.
Why It's a Top Technique
Cross-Channel Analytics moves beyond single-touch attribution to reveal the synergistic effect of your marketing ecosystem. It answers critical questions like: "Did the Facebook ad lead to a branded Google search that resulted in a sale?" This insight allows for smarter budget allocation and a more cohesive customer experience. For example, Sephora connects online browsing, mobile app activity, and in-store purchases to create its Beauty Insider program, personalizing offers based on a customer's complete interaction history. Similarly, Disney integrates data from its theme parks, streaming service, merchandise sales, and mobile apps to deliver a unified and magical experience for each guest.
How to Implement Cross-Channel Analytics
Successfully integrating data from various sources is the key to this powerful marketing analytics technique.
- Invest in a Centralized Platform: Use a customer data platform (CDP) or an advanced analytics tool to unify data. Platforms like Adobe Experience Cloud and Salesforce Customer 360 are designed to consolidate information from different sources into a single customer profile.
- Establish Consistent Tracking: Implement a standardized naming convention (like UTM parameters) for all campaigns across all channels. This ensures that data can be accurately matched and analyzed without confusion.
- Focus on Key Journey Moments: Don't try to track every single touchpoint at once. Start by mapping and analyzing the critical moments in your most common customer journeys, such as the transition from awareness to consideration.
- Audit Your Data Regularly: Schedule routine audits to check for data quality, consistency, and integration issues. Clean and accurate data is the foundation of reliable cross-channel insights.
10. Real-Time Analytics and Dashboard Reporting
Real-Time Analytics and Dashboard Reporting is the capability to collect, process, and visualize marketing data as it happens. This technique provides immediate insights into campaign performance, website traffic, and customer behavior, moving beyond retrospective analysis. It empowers marketers to make agile, data-driven decisions on the fly, optimizing campaigns mid-flight rather than waiting for post-campaign reports.
This immediate feedback loop allows teams to capitalize on emerging trends, mitigate underperformance, and respond to market shifts with unprecedented speed. By consolidating key metrics into interactive dashboards, this technique democratizes data, making complex performance indicators accessible to the entire marketing organization.
Why It's a Top Technique
This technique transforms marketing from a reactive to a proactive discipline. In a fast-paced digital world, delays of days or even hours can mean missed opportunities or wasted ad spend. For instance, Domino's famous Pizza Tracker provides customers with real-time order analytics, dramatically improving the customer experience and reducing "where is my order?" inquiries. Similarly, news outlets like CNN monitor real-time engagement on articles and social posts to determine which stories to amplify and how to frame breaking news coverage for maximum impact. This approach makes marketing more responsive and efficient.
How to Implement Real-Time Analytics
Integrating real-time data into your workflow is achievable with the right tools and focus. Modern platforms like Google Analytics, Tableau, and Power BI have made this one of the more accessible marketing analytics techniques.
- Focus on Actionable Metrics: Your dashboard should prioritize metrics that trigger specific actions, like Conversion Rate, Cost Per Acquisition (CPA), or Cart Abandonment Rate. Avoid cluttering it with vanity metrics like raw page views that don't inform decisions.
- Set Up Intelligent Alerts: To prevent information overload, configure automated alerts for significant changes. Set triggers for sudden drops in traffic, spikes in ad costs, or surges in conversions on a specific channel so you can react when it matters most.
- Balance with Long-Term Trends: Real-time data is powerful for tactical adjustments, but it shouldn't overshadow strategic analysis. Use your dashboard for immediate insights while relying on weekly or monthly reports to evaluate long-term trends and overall strategy.
- Train Your Team: Ensure your team knows not just how to read the dashboard but when and how to act on the data. Establish clear protocols for what to do when certain metrics hit predefined thresholds.
Marketing Analytics Techniques Comparison Matrix
Technique | Implementation Complexity 🔄 | Resource Requirements ⚡ | Expected Outcomes 📊 | Ideal Use Cases 💡 | Key Advantages ⭐ |
|---|---|---|---|---|---|
Customer Lifetime Value (CLV) Analysis | High: Requires advanced predictive modeling and substantial historical data | High: Data-intensive, computational resources needed | Precise revenue forecasts and customer value insights | Long-term customer value optimization and budget allocation | Targets high-value customers; improves ROI measurement |
Attribution Modeling | High: Involves multi-touch tracking and complex model selection | High: Requires technical expertise and cross-platform data | Detailed channel contribution insights | Optimizing marketing spend across multiple channels | Provides comprehensive customer journey view; budget optimization |
Cohort Analysis | Medium: Time-based segmentation with manageable complexity | Medium: Needs time to collect meaningful data | Behavioral trends and retention insights | Tracking customer behavior over time; retention strategies | Reveals patterns and seasonality; facilitates A/B test validations |
Marketing Mix Modeling (MMM) | Very High: Requires econometric modeling and large datasets | High: Statistical expertise and multi-year data | Quantifies incremental marketing impact | Overall marketing mix budget optimization | Accounts for external factors; privacy-friendly measurement |
Customer Segmentation Analysis | Medium-High: Uses clustering and predictive modeling | Medium-High: Data collection and ML resources | Targeted segments for personalized marketing | Personalization and targeted campaigns | Improves marketing ROI; enhances customer experience |
A/B Testing and Multivariate Testing | Medium: Controlled experiment setup with statistical rigor | Medium: Requires sufficient traffic and proper tools | Statistically valid performance comparisons | Campaign optimization; landing page and creative testing | Validates marketing assumptions; fast actionable results |
Predictive Analytics and Machine Learning | Very High: Advanced algorithms and continuous model training | Very High: Skilled data scientists and compute power | Proactive customer behavior and trend predictions | Automated decision-making and complex pattern recognition | Scales with data; automates insights and decisions |
Social Media Analytics | Medium: Integration of various real-time listening and sentiment tools | Medium: Access to social data APIs and analytic tools | Sentiment insights and engagement measurement | Brand monitoring, influencer strategy, real-time feedback | Provides immediate customer sentiment; identifies trends |
Cross-Channel Analytics | High: Complex data integration and identity resolution | High: Technical infrastructure and unified data platforms | Holistic view of multi-channel customer behavior | Coordinating and optimizing omnichannel marketing efforts | Identifies synergies/conflicts; improves ROI measurement |
Real-Time Analytics and Dashboard Reporting | Medium-High: Live data processing and alerting systems | High: Robust infrastructure for streaming data | Immediate insights for agile campaign adjustments | Monitoring live campaign performance and rapid response | Enables quick optimization; reduces reaction time |
Putting Your Analytics to Work: The Path to Smarter Marketing
We have journeyed through a comprehensive suite of powerful marketing analytics techniques, from the forward-looking insights of Customer Lifetime Value (CLV) analysis to the immediate clarity of real-time dashboards. Each method offers a unique lens through which to view your performance, turning raw data into a strategic asset. You’ve seen how attribution modeling can untangle the customer journey, how cohort analysis reveals long-term user behavior, and how predictive analytics can help you anticipate future market trends before they happen.
The core takeaway is not that you must implement all ten techniques tomorrow. That approach would lead to analysis paralysis and wasted resources. Instead, the path to smarter marketing is incremental and strategic. It begins with a clear-eyed assessment of your most significant business challenges and a commitment to solving them with data.
From Theory to Action: Building Your Analytics Roadmap
The true value of this guide lies in its application. Moving from understanding these concepts to leveraging them requires a deliberate, focused approach. The key is to avoid being overwhelmed and instead build a customized analytics stack that grows with your business and addresses your most critical questions one by one.
Your immediate next steps should be to:
- Identify Your Primary Hurdle: What is the single biggest question keeping your marketing team from achieving its goals?
- Is it inefficient ad spend? Start with Attribution Modeling to understand which channels truly drive conversions.
- Are you struggling with customer churn? Implement Cohort Analysis and CLV Analysis to identify high-value segments and improve retention.
- Is your messaging falling flat? Begin a disciplined program of A/B Testing and Customer Segmentation to resonate with specific audience needs.
- Do you lack a holistic view of performance? Focus on Cross-Channel Analytics and Real-Time Dashboards to unify your data streams.
- Select Your Starting Technique: Based on your primary hurdle, choose the one or two techniques that will deliver the most immediate impact. Master them. Build processes around them. Show demonstrable ROI from this initial effort. This early win will build momentum and secure buy-in for expanding your analytics capabilities.
- Integrate and Synthesize: The ultimate goal is to create a symphony of insights where these methods work in concert. Your A/B testing results should inform your customer segmentation. Your attribution data should refine your Marketing Mix Modeling. This integrated view, where each technique informs the others, is what separates good marketers from truly great ones. It allows you to move beyond simply reporting on what happened and start accurately predicting what will happen next.
The Lasting Impact of an Analytics-First Mindset
Adopting these marketing analytics techniques is more than a technical exercise; it is a fundamental cultural shift. It means fostering a data-first mindset where decisions are grounded in evidence, not intuition alone. It empowers your team to ask tougher questions, run smarter experiments, and hold every marketing dollar accountable for its performance.
By committing to this journey, you transform your marketing department from a cost center into a predictable, scalable growth engine. You stop reacting to the market and start shaping it, armed with the foresight to allocate resources effectively, optimize customer experiences, and consistently outperform the competition. The path to mastering these skills requires dedication, but the reward is a sustainable competitive advantage built on a deep, data-driven understanding of your customers and your market.
Ready to unify your data and master your marketing analytics? Cometly provides a powerful, all-in-one platform that simplifies attribution, cross-channel analytics, and real-time reporting. Stop guessing and start knowing exactly what’s working with a single source of truth for all your marketing efforts. Discover Cometly today and see how our platform can help you implement these advanced techniques with ease.