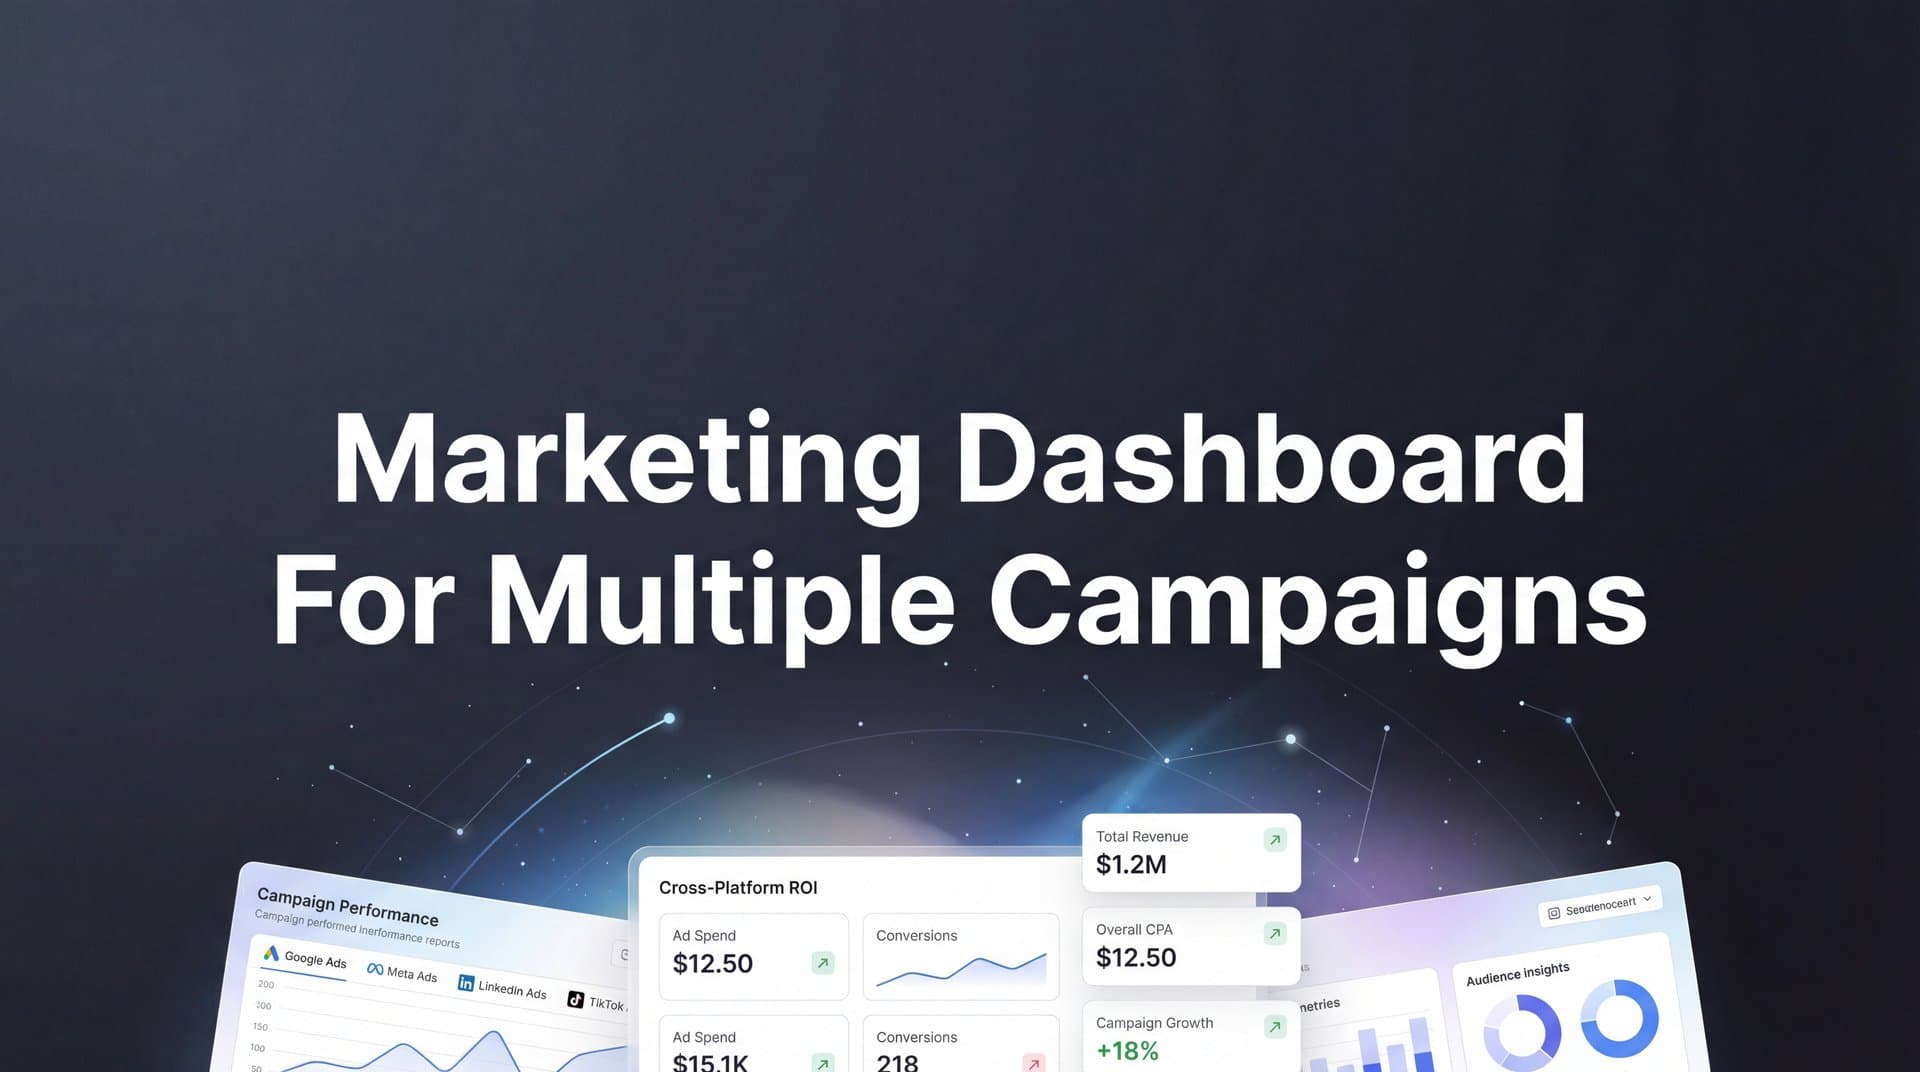
Managing marketing campaigns across Meta, Google, TikTok, and LinkedIn simultaneously creates a data nightmare. You're jumping between platforms, exporting spreadsheets, and struggling to understand which campaigns actually drive revenue.
A unified marketing dashboard solves this by pulling all your campaign data into one view—letting you compare performance, spot trends, and make faster decisions. This guide covers the top marketing dashboards built specifically for multi-campaign management, from attribution-focused platforms to visualization tools.
We've evaluated each based on integration depth, real-time data capabilities, ease of use, and value for marketing teams running complex, cross-platform campaigns. Here are the top tools to consider.
1. Cometly
Best for: Marketers who need accurate attribution and AI-powered optimization across all ad platforms.
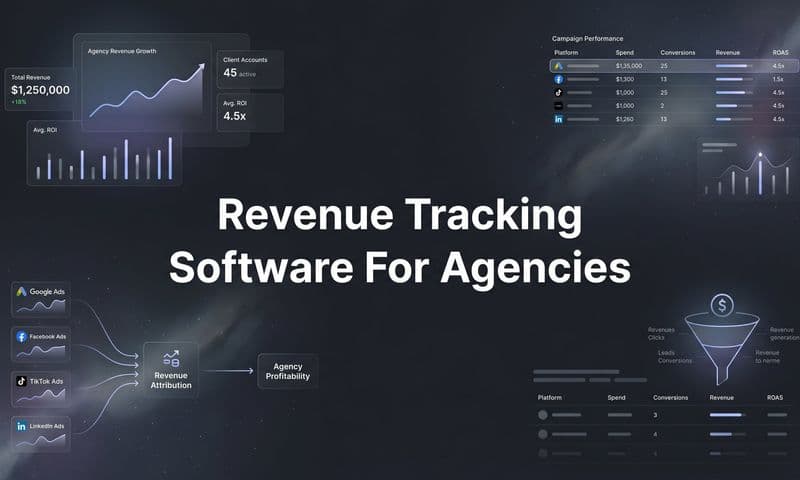
Cometly is a marketing attribution platform that connects your ad platforms, CRM, and website data to show exactly which campaigns drive revenue.
 9 Best Marketing Dashboards for Multiple Campaigns in 2026
Where This Tool Shines
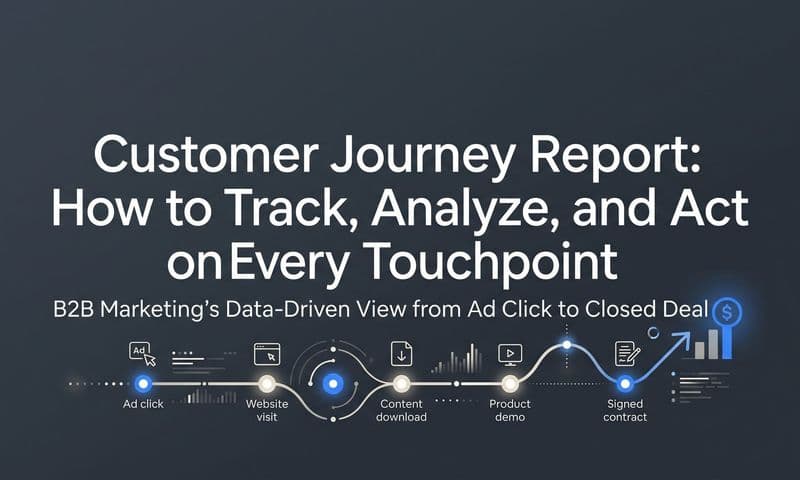
Cometly solves the fundamental problem most marketers face: understanding which campaigns actually convert. By tracking every touchpoint from initial ad click through CRM events, it provides a complete view of the customer journey that surface-level metrics miss.
The platform's AI Ads Manager analyzes performance across all channels and delivers actionable optimization recommendations. Instead of manually comparing campaigns, you get specific suggestions on where to scale spend and which creative performs best.
Key Features
Multi-Touch Attribution: Track customer journeys across every marketing touchpoint to see which campaigns contribute to conversions.
AI Ads Manager: Get AI-powered recommendations on which ads and campaigns to scale based on actual revenue performance.
Server-Side Tracking: Capture accurate data even with browser privacy restrictions and iOS limitations that break traditional tracking.
Conversion Sync: Send enriched conversion data back to Meta, Google, and other platforms to improve their algorithm optimization.
Real-Time Analytics Dashboard: Monitor campaign performance across all platforms in one unified view with live data updates.
Best For
Digital marketing teams and agencies running multi-platform campaigns who need to prove ROI and optimize based on revenue, not just clicks. Particularly valuable for businesses spending significantly on paid advertising where attribution accuracy directly impacts budget decisions.
Pricing
Custom pricing based on ad spend volume. Demo available to explore features and discuss pricing tailored to your campaign scale.
2. Databox
Best for: Teams wanting pre-built dashboard templates with goal tracking and automated alerts.
Databox is a dashboard platform that pulls data from marketing tools into customizable KPI dashboards.
 9 Best Marketing Dashboards for Multiple Campaigns in 2026
Where This Tool Shines
Databox excels at getting teams up and running quickly with pre-built templates for common marketing use cases. Instead of building dashboards from scratch, you can deploy proven templates for Google Ads, Facebook campaigns, or SEO tracking in minutes.
The goal tracking feature sets it apart by letting you set targets for each metric and receive automated alerts when performance deviates. This proactive approach means you catch issues before they become expensive problems.
Key Features
100+ One-Click Integrations: Connect major marketing platforms including Google Analytics, Facebook Ads, HubSpot, and Salesforce without custom coding.
Pre-Built Dashboard Templates: Start with proven templates designed for specific marketing channels and customize from there.
Goal Tracking with Progress Alerts: Set performance targets and receive notifications when metrics move above or below thresholds.
Mobile App for On-the-Go Monitoring: Check campaign performance from your phone with a dedicated iOS and Android app.
Automated Performance Snapshots: Schedule regular reports delivered to your inbox or Slack channel without manual effort.
Best For
Small to mid-sized marketing teams who value speed of deployment and don't need complex custom calculations. Works well for teams monitoring standard KPIs across common platforms.
Pricing
Free tier available for basic dashboards. Paid plans start at $47/month with additional features and data sources.
3. Klipfolio
Best for: Teams needing highly customizable dashboards with real-time data streaming capabilities.
Klipfolio is a data visualization platform offering real-time dashboards with extensive customization options.
 9 Best Agency Client Reporting Dashboards in 2026
Where This Tool Shines
Klipfolio's strength lies in its flexibility. You can create custom metric calculations that combine data from multiple sources in ways that match your specific business logic. This matters when standard metrics don't tell your story.
The real-time data streaming capability means your dashboards update continuously rather than on scheduled refreshes. For teams making rapid optimization decisions based on current performance, this immediacy provides a significant advantage.
Key Features
Real-Time Data Streaming: See campaign performance update live as data changes in source platforms.
Custom Metric Calculations: Build complex formulas that combine data from multiple sources to create unique KPIs.
150+ Native Data Connectors: Connect to major marketing platforms, databases, and APIs without middleware tools.
PowerMetrics for Metric Catalog Management: Create a centralized library of metrics with consistent definitions across teams.
Embedded Analytics Options: White-label dashboards and embed them in client portals or internal tools.
Best For
Marketing teams with specific reporting requirements that standard templates can't address. Best suited for organizations with technical resources who can leverage the platform's customization capabilities.
Pricing
Plans start at $125/month for teams, with pricing scaling based on users and data sources.
4. Supermetrics
Best for: Teams who prefer working in spreadsheets or need to feed marketing data into data warehouses.
Supermetrics is a data pipeline tool that automatically pulls marketing data from 100+ platforms into spreadsheets and BI tools.
 9 Best Marketing Dashboards for Multiple Campaigns in 2026
Where This Tool Shines
Supermetrics takes a different approach than traditional dashboard platforms. Instead of forcing you into their interface, it brings data to where you already work—Google Sheets, Excel, BigQuery, or your data warehouse of choice.
The deep API connectors pull more granular data than many platforms offer through standard integrations. This matters when you need campaign-level details or custom dimensions that surface-level connections miss.
Key Features
Deep API Connectors for Major Ad Platforms: Access detailed campaign data beyond what basic integrations provide, including custom dimensions and metrics.
Automated Data Refresh Scheduling: Set reports to update hourly, daily, or on custom schedules without manual intervention.
Direct Integration with Google Sheets, Excel, BigQuery: Work in familiar tools rather than learning new dashboard interfaces.
Data Blending Across Sources: Combine data from multiple platforms in a single query to create unified reports.
Historical Data Backfill: Pull past campaign data when connecting new sources to maintain historical reporting continuity.
Best For
Marketing analysts comfortable with spreadsheets who need raw data access for custom analysis. Also ideal for teams building their own data warehouses and need reliable data pipelines.
Pricing
Pricing starts at $39/month per data source, with costs increasing based on the number of platforms you connect.
5. AgencyAnalytics
Best for: Marketing agencies managing multiple client campaigns and needing white-label reporting.
AgencyAnalytics is a reporting platform built specifically for marketing agencies with white-label dashboards and automated client reporting.
 9 Best Marketing Dashboards for Multiple Campaigns in 2026
Where This Tool Shines
AgencyAnalytics understands the agency workflow. The platform lets you create branded reports with your logo and colors, then give clients direct dashboard access without exposing the underlying tool.
The automated report scheduling eliminates the monthly scramble to compile client reports. Set up templates once, and reports generate and deliver automatically—freeing your team to focus on optimization rather than reporting.
Key Features
White-Label Branded Reports: Customize dashboards and reports with your agency's branding to maintain a professional client experience.
80+ Marketing Platform Integrations: Connect major advertising, SEO, social media, and analytics platforms from a single interface.
Automated Report Scheduling: Configure reports to generate and send to clients automatically on your preferred schedule.
Client Login Portals: Provide clients with secure dashboard access to monitor their campaigns in real time.
SEO and PPC Campaign Tracking: Monitor rankings, backlinks, ad performance, and budget pacing across all client accounts.
Best For
Digital marketing agencies managing multiple client accounts who need to deliver professional, branded reporting at scale. Particularly valuable for agencies tired of manual report compilation.
Pricing
Plans start at $79/month for 5 client campaigns, with pricing scaling based on the number of campaigns you manage.
6. Whatagraph
Best for: Teams prioritizing visual appeal in client-facing reports with minimal setup effort.
Whatagraph is a visual reporting platform focused on creating beautiful cross-channel marketing reports with drag-and-drop simplicity.
 9 Best Agency Client Reporting Tools in 2026
Where This Tool Shines
Whatagraph makes creating visually impressive reports effortless. The drag-and-drop builder lets you arrange charts, tables, and metrics without design skills, producing reports that look professionally designed.
The platform excels at cross-channel data blending, letting you compare Facebook ad performance against Google campaigns in unified visualizations. This side-by-side view makes it easier to spot which platforms deliver better results for specific objectives.
Key Features
Drag-and-Drop Report Builder: Create custom report layouts by simply dragging widgets and metrics into position without coding.
45+ Marketing Integrations: Connect popular advertising, social media, and analytics platforms including Meta, Google, LinkedIn, and TikTok.
Automated Report Delivery: Schedule reports to generate and send automatically to clients or team members via email.
Custom Branding Options: Add your logo, colors, and custom domains to maintain brand consistency in client reports.
Cross-Channel Data Blending: Combine metrics from different platforms in single visualizations to compare performance across channels.
Best For
Marketing teams and agencies who present reports to clients or executives and need polished, easy-to-understand visualizations. Works well when aesthetics matter as much as data accuracy.
Pricing
Plans start at $199/month with pricing increasing based on the number of data sources and users.
7. Google Looker Studio
Best for: Budget-conscious teams already using Google Marketing Platform tools.
Google Looker Studio is a free data visualization tool from Google that creates interactive dashboards.
 9 Best Data Visualization Tools for Marketing Analytics in 2026
Where This Tool Shines
Looker Studio's biggest advantage is obvious: it's completely free. For teams watching budgets, this eliminates a recurring expense while still providing solid dashboard capabilities.
The native integration with Google products—Analytics, Ads, Search Console, Sheets—works seamlessly. If your marketing stack centers on Google tools, Looker Studio pulls that data without authentication hassles or API limitations.
Key Features
Free to Use: Full dashboard and reporting capabilities at no cost, regardless of team size or data volume.
Native Google Ads and Analytics Integration: Connect Google Marketing Platform tools instantly with pre-built connectors that require minimal setup.
Community Connector Marketplace: Access hundreds of third-party connectors built by the community for platforms Google doesn't natively support.
Shareable Interactive Reports: Create dashboards that stakeholders can interact with, filtering and exploring data without editing permissions.
Template Gallery for Quick Starts: Begin with pre-built report templates for common marketing use cases and customize from there.
Best For
Small marketing teams or startups primarily using Google's marketing tools who need functional dashboards without budget allocation. Also suitable for side projects or testing dashboard concepts before investing in paid platforms.
Pricing
Completely free with no usage limits or premium tiers.
8. Tableau
Best for: Enterprise marketing teams with complex data analysis needs and technical resources.
Tableau is an enterprise-grade data visualization platform offering advanced analytics capabilities for large-scale marketing data.
Where This Tool Shines
Tableau handles data complexity that overwhelms simpler platforms. When you're analyzing millions of rows across dozens of campaigns with intricate segmentation requirements, Tableau's data engine processes queries that would crash basic tools.
The AI-powered insights feature, Tableau Pulse, automatically surfaces anomalies and trends you might miss in manual analysis. For large marketing organizations generating massive data volumes, this automated pattern detection becomes invaluable.
Key Features
Advanced Data Modeling and Calculations: Create sophisticated calculated fields and data relationships that handle complex marketing attribution logic.
AI-Powered Insights with Tableau Pulse: Automatically detect unusual patterns, trends, and anomalies in campaign performance data.
Enterprise Security and Governance: Implement role-based access controls, data encryption, and audit logging for regulated industries.
Extensive Visualization Options: Build interactive dashboards with hundreds of chart types and customization possibilities beyond basic bar and line graphs.
Data Prep and Cleaning Tools: Transform and clean messy marketing data within Tableau before visualization without external ETL tools.
Best For
Enterprise marketing organizations with dedicated analytics teams who need to analyze complex, high-volume data sets. Best suited for companies where dashboard sophistication justifies the learning curve and cost investment.
Pricing
Tableau Cloud plans start at $75 per user per month, with enterprise pricing available for larger deployments.
9. HubSpot Marketing Hub
Best for: Teams already using HubSpot CRM who want integrated campaign management and reporting.
HubSpot Marketing Hub is an all-in-one marketing platform with built-in campaign dashboards and closed-loop reporting.
Where This Tool Shines
HubSpot's advantage lies in its unified ecosystem. When your campaigns, CRM contacts, and sales pipeline live in the same platform, you get closed-loop reporting that connects marketing campaigns directly to revenue without complex integrations.
The multi-touch revenue attribution shows which marketing touchpoints influenced deals throughout the entire sales cycle. This matters for B2B companies with longer sales processes where understanding the full customer journey determines budget allocation.
Key Features
Native CRM Integration for Closed-Loop Reporting: Track campaigns from initial contact through closed deals without connecting external systems.
Campaign Management and Tracking: Build, launch, and monitor email, social, and ad campaigns from a single platform.
Multi-Touch Revenue Attribution: See which marketing interactions contributed to revenue across the entire customer journey.
Custom Report Builder: Create tailored reports combining marketing, sales, and service data with drag-and-drop simplicity.
Email and Ad Performance Dashboards: Monitor email engagement, ad clicks, and landing page conversions in unified dashboards.
Best For
B2B marketing teams already invested in the HubSpot ecosystem who want campaign management and reporting in one platform. Less suitable if you're only looking for dashboard capabilities without the full marketing suite.
Pricing
Free tier available with basic features. Professional plans start at $800/month with full marketing automation and advanced reporting capabilities.
Making the Right Choice
Choosing the right marketing dashboard depends on your primary need and existing workflow. For teams focused on understanding which campaigns actually drive revenue and want AI-powered optimization recommendations, Cometly provides the deepest attribution insights with server-side tracking that maintains accuracy despite privacy restrictions.
If you need flexible data visualization with extensive integrations, Klipfolio offers real-time streaming and custom calculations, while Databox delivers quick deployment with pre-built templates. Agencies managing multiple clients should consider AgencyAnalytics or Whatagraph for their white-label capabilities and automated client reporting features.
Budget-conscious teams can start with Google Looker Studio, which provides solid functionality at no cost, particularly if your stack centers on Google tools. Enterprises with complex data analysis requirements and technical resources may benefit from Tableau's advanced capabilities, though the learning curve and cost require justification.
Teams already invested in HubSpot's ecosystem gain value from Marketing Hub's closed-loop reporting, while those who prefer working in spreadsheets should explore Supermetrics for its data pipeline approach.
The key is matching the tool to your workflow—whether that's cross-platform attribution, automated client reporting, or custom KPI tracking. Consider these questions: Do you need to prove ROI to revenue, or just monitor performance metrics? Are you managing your own campaigns or client accounts? Do you have technical resources for customization, or do you need pre-built templates?
Start with free trials where available to test how each platform handles your specific campaign mix before committing. Pay attention to integration quality with your current ad platforms, data refresh frequency, and whether the interface matches how your team actually works.
Ready to elevate your marketing game with precision and confidence? Discover how Cometly's AI-driven recommendations can transform your ad strategy—Get your free demo today and start capturing every touchpoint to maximize your conversions.