To truly measure your advertising effectiveness, you have to connect ad spend directly to business outcomes—sales, leads, actual revenue. Forget vanity metrics like clicks and impressions for a moment. The real question is: are your ads making you money?
Why Effective Ad Measurement Is So Hard
 How To Measure Advertising Effectiveness For Your Business
Before we get into the "how," it's worth understanding why this feels so impossible for most marketers. The biggest challenge is separating the signal from the noise. You’re not just running one ad. You've got campaigns on multiple platforms, email sequences firing off, and maybe even some good old-fashioned word-of-mouth—all happening at the same time.
Trying to isolate the exact impact of a single Facebook campaign from all that chaos is a massive headache. The digital world is messy, and customer journeys are rarely a straight line from A to B. This complexity is why so many marketers end up relying on misleading or incomplete data, making it tough to justify budgets or optimize campaigns with any real confidence. These are just some of the common attribution challenges in marketing analytics that can hide your true performance.
The Problem of Statistical Significance
Even when you’re working with massive datasets, proving a campaign's direct impact can be surprisingly tricky due to data variance.
Consider a large-scale experiment involving 1.3 million users who were shown two different ad campaigns. Despite the incredible reach, the resulting 5% sales lift wasn't actually statistically significant. Why? High variance in consumer behavior—where 95% of people made zero purchases in a given week—completely masked the campaign's true impact.
This scenario gets right to the heart of the problem: even a successful campaign can look like a failure without the right measurement framework in place.
The goal isn’t just to collect data; it's to find statistically sound evidence that your advertising dollars are driving real growth. Without this, you're essentially flying blind, unable to tell the difference between a lucky break and a repeatable strategy.
This guide will give you a clear, step-by-step process to cut through that complexity. We'll help you build a reliable system to measure advertising effectiveness and make data-driven decisions that actually grow your business.
Defining Your Goals and Key Metrics
Before you can figure out if your ads are working, you have to know what “working” actually means for your business. Just saying you want to "increase sales" is way too broad. Real success comes from setting sharp, specific goals that tie your ad spend directly to what the company is trying to achieve.
This means you’ve got to look past the surface-level stuff. Are you launching something brand new and need to get the word out, or are you focused on getting your current customers to buy again? Each of those goals requires a totally different set of Key Performance Indicators (KPIs).
Tying ad spend to business metrics is nothing new. The industry has been doing this since the 1970s, gradually moving toward continuous tracking to see how campaigns affect things like brand recall over time.
Connecting Strategy to Tactics
One of the biggest mistakes I see is marketers treating advertising like it exists in a silo. Your advertising goals should be a direct reflection of your company's bigger strategic priorities. If the C-suite wants to break into a new market, your main ad objective should probably be generating qualified leads in that specific region.
When everything is aligned like this, you know every dollar you spend is pushing toward a meaningful business outcome. Nailing the financial return is a huge part of this, and it's worth learning how to effectively measure the ROI of your marketing efforts to make that connection even stronger.
Mapping Business Goals to Advertising KPIs
To make this practical, I've put together a simple framework. This table shows how you can map common business goals to the specific advertising KPIs you should be watching like a hawk.
Business Goal | Primary Advertising Objective | Key Performance Indicators (KPIs) |
|---|---|---|
Increase Market Share | Acquire new customers from competitors. | Customer Acquisition Cost (CAC), New Customer Growth Rate, Conversion Rate |
Launch a New Product | Generate awareness and initial sales. | Impressions, Click-Through Rate (CTR), Cost Per Purchase (CPP), Return on Ad Spend (ROAS) |
Improve Customer Loyalty | Drive repeat purchases and increase lifetime value. | Customer Lifetime Value (CLV), Repeat Purchase Rate, Cost Per Acquisition (for returning customers) |
Generate Sales Leads | Fill the pipeline for the sales team. | Cost Per Lead (CPL), Lead-to-Close Rate, Number of SQLs |
As you can see, the KPIs you pick will completely shape your optimization strategy.
Your choice of KPIs directly influences your optimization strategy. Tracking ROAS forces you to focus on profitability, while tracking CPL prioritizes lead volume and quality. Choose metrics that reflect what truly matters to your bottom line.
Choosing the Right KPIs
Once your goals are locked in, picking the right KPIs is the next make-or-break step.
For a deeper look at which metrics make the most sense for different channels and goals, check out our guide on essential marketing KPI examples.
Ultimately, the KPIs you monitor should tell a clear story about your progress. They’re your compass, helping you make fast, informed decisions to keep your campaigns on track.
Building a Reliable Tracking Framework
Okay, you've got your goals and KPIs locked in. Now for the fun part: building the technical foundation that actually makes measurement possible.
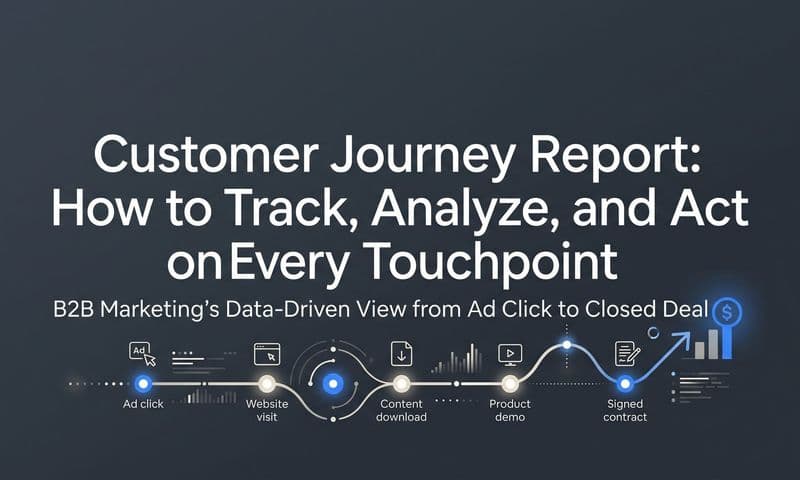
Think of your tracking framework as the engine that powers all your advertising insights. Without a reliable one, even the clearest goals are just wishful thinking. This isn't about slapping a pixel on your site and hoping for the best. It’s a deliberate process of setting up systems to capture every critical touchpoint along the customer journey.
This visual shows exactly how your high-level business goals should trickle down into the nitty-gritty KPIs you track every day.
 How To Measure Advertising Effectiveness For Your Business
This illustrates the crucial link between your strategy and your execution, making sure your tracking efforts are always focused on what actually matters to the business.
Mastering UTM Parameters for Clean Data
The first pillar of any solid tracking setup is consistent and clean UTM parameters. I can't stress this enough. These little tags you add to your URLs are the only way to tell your analytics platform exactly where your traffic is coming from. They’re like digital breadcrumbs leading back to a specific ad, campaign, or channel.
Inconsistent UTMs create absolute chaos in your data. I’ve seen it a hundred times. For instance, if one person on your team uses utm_source=facebook on an ad and another uses utm_source=Facebook, your analytics tool will report them as two completely separate sources. This fractures your data, making it impossible to get a clear picture of how a channel is really performing.
To stop this from happening, you need to establish a standardized naming convention for your entire team and stick to it religiously.
- Source: The platform (e.g.,
google,meta,tiktok). Always lowercase. - Medium: The marketing channel (e.g.,
cpc,social,email). - Campaign: The specific promotion (e.g.,
summer-sale-2024). - Content: The ad creative or variation (e.g.,
blue-video-ad). - Term: The paid keyword (e.g.,
marketing-attribution-software).
A simple shared spreadsheet or a dedicated tool to generate these URLs can ensure everyone stays on the same page. The result? Clean, actionable data you can actually trust.
Implementing Pixels and Server-Side Tracking
Next up, you’ll need to implement conversion pixels from ad platforms like Meta and TikTok. These little snippets of code are essential for tracking the actions users take on your website after clicking an ad, like adding an item to their cart or completing a purchase.
But here's the reality check: traditional client-side tracking, which relies entirely on the user's browser, is becoming less and less reliable. Ad blockers and major privacy updates like iOS 14 have made it a minefield. A staggering 42.7% of internet users worldwide now use ad blockers, which means a huge chunk of your data might just be vanishing into thin air.
This is where server-side tracking becomes a non-negotiable. Instead of sending data from the user's browser (where it can be blocked), it sends conversion data directly from your server to the ad platform. This approach neatly bypasses ad blockers and browser restrictions, creating a much more accurate and complete dataset.
If you want to go deeper on this, check out our complete guide on the benefits of server-side tracking.
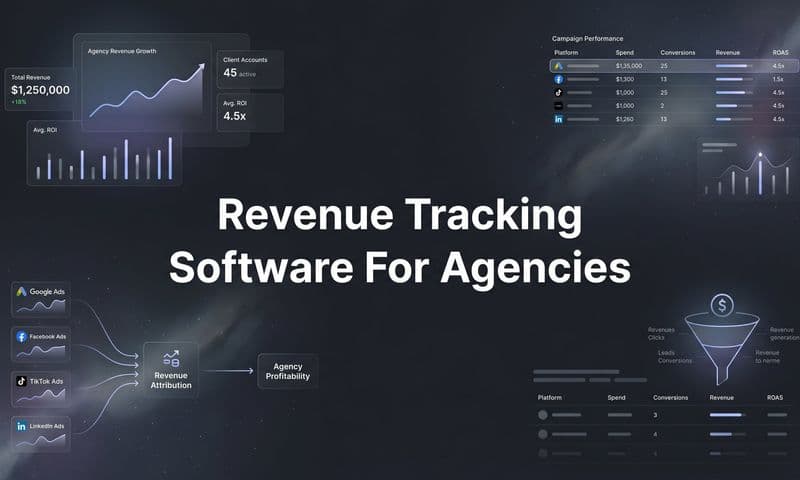
Platforms like Cometly were built to simplify this entire process. We centralize data from Google Ads, Meta, organic search, and more to give you a single, unified view of every touchpoint. This is the kind of reliable data setup you need to truly measure your advertising effectiveness and make those big, budget-defining decisions with confidence.
Choosing the Right Attribution Model
Attribution is often where marketers feel like they've hit a wall, but it doesn't have to be that confusing.
At its core, an attribution model is just a set of rules that decides how credit for a sale is divvied up among all the touchpoints in a customer's journey. Think of it like deciding which player on a sports team gets the MVP award for a big win.
The truth is, there’s no single “perfect” model that works for every business out there. Your goal is to find the one that makes the most sense for your product, your sales cycle, and your specific goals. It’s a make-or-break step in accurately measuring how effective your advertising really is.
Single-Touch vs. Multi-Touch Attribution
The most basic models are single-touch, which give 100% of the credit to just one interaction.
- First-Touch Attribution: This model gives all the credit to the very first ad or link a customer ever clicked. It's fantastic for brands laser-focused on discovery and figuring out which channels are best at bringing new people into their world.
- Last-Touch Attribution: This is the default setting for most ad platforms. It hands all the credit to the final click before a conversion. While it's simple, it often paints an incomplete picture by ignoring all the earlier interactions that warmed up the lead.
Simple as they are, these models can be seriously misleading. Imagine a customer sees a TikTok ad, reads a blog post a week later, and finally converts through a Google search ad. Last-touch would give Google all the glory, completely ignoring the crucial roles that TikTok and your blog played in the process.
For a more in-depth look at how different models can shape your data, check out this guide on understanding attribution modeling to see the full picture.
The Power of a Holistic View
This is exactly where multi-touch attribution (MTA) changes the game. Instead of zeroing in on just one interaction, MTA models spread the credit across multiple touchpoints, giving you a far more realistic view of the entire customer journey.
Multi-touch attribution helps you see the assists, not just the final goal. It reveals how different channels work together, so you can stop asking "Which channel works?" and start asking "How do my channels work together?"
There are several types of multi-touch models you'll encounter:
- Linear: Splits credit equally among all touchpoints. Simple and fair.
- Time-Decay: Gives more credit to the touchpoints that happened closer to the conversion.
- U-Shaped: Puts the spotlight on the first and last touches, assigning the most credit to them while distributing the rest among the interactions in between.
These more advanced models help you finally appreciate the synergy between your top-of-funnel awareness campaigns and your bottom-of-funnel conversion ads. To really nail this down, take a look at our complete comparison of attribution models for marketers to find your perfect fit.
Ultimately, moving beyond the default last-click model that individual ad platforms force on you is essential. Using a centralized tool like Cometly to implement a more sophisticated model lets you see the full, unbiased story of how your marketing efforts are truly driving growth. It gives you the clarity you need to optimize your budget and scale your best strategies with confidence.
Turning Your Data into Actionable Insights
 How To Measure Advertising Effectiveness For Your Business
Collecting data is just the starting line. The real money is made when you turn those numbers into decisions that actually grow your business. This is where the analysis and optimization loop comes in—moving beyond just staring at a dashboard and starting to ask why the numbers look the way they do.
With unified data, you finally get the full story. You can see everything from the first ad a customer saw weeks ago to the purchase they just made. This clarity is what you need to measure your ad performance accurately and make moves with confidence.
From Raw Data to Real Strategy
The first step here is to slice and dice your data to find the hidden patterns. Don't just look at your overall Return on Ad Spend (ROAS). Break it down. How does ROAS change between your different audiences, ad creatives, or placements?
You might dig in and find that your video ads on Instagram are pulling a 3.5x ROAS with your lookalike audience, but only a 1.2x ROAS with your interest-based audience. Boom. That single insight gives you a clear, actionable next step: shift more budget to the lookalike audience that’s crushing it.
This level of detail is also how you spot creative fatigue. If an ad that was a top performer last month suddenly sees its Click-Through Rate (CTR) and conversion rate tank, it’s a good sign your audience is tired of seeing it. Without that segmented data, you might just think the whole campaign is failing and kill something that just needed a refresh.
Connecting Your Online and Offline Worlds
A truly solid measurement strategy looks beyond just the clicks and conversions. Your online ads often create ripples in the offline world, and spotting them can show you the full impact of your campaigns.
For instance, you might launch a big display ad campaign and not see an immediate explosion in direct conversions. But what you might see is a significant spike in two other places:
- Branded Search Queries: More people start Googling your brand name directly.
- Direct Website Traffic: You notice an uptick in users typing your URL right into their browser.
These aren't just vanity metrics. Increases in direct traffic or branded searches, often in the 10-30% range after a major campaign, are strong signals of brand lift. It’s proof that your ads are working to build recognition and recall.
When you connect these dots, you get a much richer picture of your advertising's true influence. That spike in direct traffic isn't random—it's the direct result of your top-of-funnel ads doing their job.
Making Data-Backed Decisions
Once you have these insights, you can start making smart, strategic tweaks to your campaigns. The goal is to create a continuous feedback loop: analyze, optimize, and then measure the results of your changes. For a deeper look into this process, check out our guide on how to work with actionable data to get real results.
This is the cycle that separates the pros from the amateurs. It’s not about finding one "magic bullet" ad. It's about making small, data-informed improvements over and over again. By consistently reallocating your budget, refining your targeting, and refreshing your creative, you build an advertising strategy that can adapt, survive, and ultimately, win.
Common Questions About Ad Measurement
Even with a solid framework, theory only gets you so far. Once you dive into the day-to-day of measuring ad effectiveness, real-world questions always pop up. Let’s tackle a few of the most common ones I hear.
The goal here is to move past the textbook answers and into confident, practical application.
How Often Should I Check My Ad Performance?
This is a classic "it depends" situation, but the answer really hinges on your campaign goals and budget. If you're running a high-spend e-commerce campaign trying to drive daily sales, you need to be in there every single day. No question. You’re looking for budget pacing issues, creative fatigue, and opportunities to scale what’s working right now.
On the flip side, if you're running a longer-term brand awareness campaign, checking it daily is a recipe for disaster. You’ll drive yourself crazy overreacting to normal, everyday fluctuations in the data. For these types of campaigns, a weekly or bi-weekly check-in is far more productive. It helps you spot meaningful trends without getting lost in the noise.
Establish a reporting rhythm that fits your campaign. The key is sticking to a schedule that allows for timely tweaks without causing analysis paralysis.
This kind of discipline ensures you're making strategic moves, not just reacting to random data blips.
What Is the Biggest Mistake in Ad Measurement?
Hands down, the biggest and most costly mistake is blindly trusting the numbers inside a single ad platform. Whether it’s Meta Ads Manager or Google Ads, you have to remember these platforms are inherently biased. Their attribution models are designed to give themselves as much credit as possible for every single conversion.
This creates a completely siloed and skewed version of reality. You might look at your dashboard and think Facebook is your golden goose, but in reality, it was just the last click in a long customer journey that started on TikTok and was nurtured by your email list.
To get the real story, you need a neutral, third-party source of truth. Using a centralized tracking platform isn't just a nice-to-have; it's non-negotiable for getting an objective, holistic view of how all your channels work together.
Can I Measure Offline Ad Impact?
Yes, you absolutely can, but you have to get a bit creative. You obviously can’t track a click on a billboard or a TV commercial, but you can measure their ripple effects by looking for other signals.
Here’s how you can connect the dots:
- Brand Lift Surveys: Run simple surveys before and after the campaign launches to see if you moved the needle on brand awareness and perception.
- Direct Traffic Spikes: Keep a close eye on your analytics for a noticeable jump in direct website traffic that lines up with your campaign's flight dates.
- Branded Search Volume: Watch for a surge in people Googling your brand name. This is a classic indicator that your offline efforts are driving curiosity.
- Unique Codes & URLs: This is the most direct method. Use a unique URL, QR code, or promo code exclusively for that offline ad to track direct responses.
By correlating these different data points, you can build a strong, evidence-based case for your offline campaign's effectiveness.
Ready to get a clear, unbiased view of your ad performance? Cometly unifies your data, providing the accurate attribution you need to stop wasting money and start scaling what works. See exactly how every dollar impacts your bottom line at https://www.cometly.com.