Measuring marketing effectiveness is all about drawing a straight line from your marketing activities—your ads, your content, your emails—directly to business outcomes like revenue and customer growth. It's the process of tracking the right numbers, figuring out which touchpoints get the credit, and analyzing the data to prove your return on investment.
When you get this right, marketing stops being a cost center and becomes what it should be: a predictable engine for growth.
Why Measuring Your Marketing Actually Matters
 Measure Marketing Effectiveness Like a Pro
Sooner or later, every marketer gets hit with the big question: "What did we actually get for that money?" Answering this with confidence means you need more than just likes or impressions to show for it. You need to connect your budget directly to the bottom line.
Think about it. You launch a new campaign across five different channels—Google Ads, a new email sequence, organic social, an influencer partnership, and even a small print ad. Without a solid measurement framework, your results are just a tangled mess. You might see a bump in sales, but you won't know why. Was it the clever ad copy on Google or the influencer's shout-out? That’s the fog we need to clear.
The Shift from Expense to Investment
This is where effective measurement changes the game, turning all that ambiguity into crystal-clear insights. It’s how you stop treating your marketing budget like an expense and start managing it as a strategic investment.
When you can prove that every dollar you put into a specific channel brings back three dollars in revenue, budget conversations start sounding a lot different.
This shift is more critical now than ever. With global marketing spend projected to approach $1 trillion by 2025, the stakes are incredibly high. The growth is overwhelmingly digital, as 66% of marketers now see traditional advertising as less effective, mostly because digital offers far better targeting and measurability.
Building Your Actionable Framework
Moving forward, this guide will lay out a clear, actionable framework to help you master this process. We’ll get into everything from foundational metrics to advanced tools, all designed to help you build a system that proves your value. The goal is to get you out of the guessing game and into data-driven decisions that fuel predictable growth.
"How do you know if your marketing campaigns are working? The way to ensure this is to have the right metrics to measure your performance. At the simplest level, you need to measure what you set out to achieve with your marketing objectives."
This journey starts with understanding the fundamentals. To get a solid grasp on the basics, this guide on measuring marketing campaign effectiveness is a great place to start.
It's also crucial to recognize when your current methods are falling short. If you have a feeling your data is incomplete, check out these common signs you need better marketing analytics. By setting the right foundation, you can turn raw data into your most powerful asset.
Building Your Measurement Foundation With Core Metrics
To get a real grip on your marketing effectiveness, you have to look past the vanity metrics. Sure, likes, shares, and impressions are nice to see—they tell you people are paying attention—but they don't tell you if you're actually growing the business. The real goal is to build a dashboard with core metrics that tell a clear story about revenue and customer acquisition.
This means focusing on key performance indicators (KPIs) that connect your ad spend to tangible results. Let’s break these down into three critical categories: acquisition, engagement, and revenue.
Understanding Customer Acquisition Cost
One of the most honest metrics out there is your Customer Acquisition Cost (CAC). It cuts through the noise and tells you exactly how much money you’re spending, on average, to land a single new customer. Think of it as a reality check for your marketing engine.
Calculating it is simple: just divide your total marketing and sales expenses over a certain period by the number of new customers you brought in during that same timeframe.
Formula: Total Marketing & Sales Spend / Number of New Customers = CAC
For example, if a direct-to-consumer brand spends $10,000 on a Facebook ad campaign in one month and gets 500 new customers from it, the CAC is $20. Knowing this number is the first step in figuring out if your ad channels are actually profitable.
A low CAC is a powerful sign that your marketing is both targeted and efficient. But be careful—you have to balance it with the long-term value of those customers. Acquiring cheap customers who churn a week later isn't a win.
Gauging Engagement With Conversion Rate
Next up, you need to know how good you are at turning eyeballs into action. That's where your Conversion Rate comes in. It measures the percentage of people who complete a specific goal, whether that's making a purchase, signing up for your newsletter, or booking a demo.
This metric is vital because it reveals the quality of your traffic and how well your messaging and user experience are working together. Lots of traffic with a low conversion rate is a classic sign of a disconnect between your ads and your landing page.
Formula: (Number of Conversions / Total Visitors) * 100 = Conversion Rate %
Imagine an e-commerce store drives 20,000 visitors to a product page from a Google Ads campaign. If 400 of those visitors buy something, the conversion rate is 2%. Optimizing this rate is often one of the fastest ways to improve your overall marketing performance. To truly build a strong foundation, it's essential to master Google Ads performance metrics that directly influence these outcomes.
This simple infographic shows how CAC, Conversion Rate, and ROAS flow together when measuring performance.
 Measure Marketing Effectiveness Like a Pro
This visual represents the journey from spending money to get customers, to converting them, and finally, to measuring the direct return on that investment.
Tying It All to Revenue Metrics
Ultimately, every marketing dollar has to justify its existence by the revenue it brings in. Two of the most powerful metrics for this are Return on Ad Spend (ROAS) and Customer Lifetime Value (CLV).
Before we dive into the metrics themselves, it's helpful to see how they fit into the bigger picture. Here’s a quick breakdown of some essential marketing KPIs, their formulas, and what they really tell you about your campaign performance.
Key Marketing Metrics and Their Business Impact
Metric Category | Key Performance Indicator (KPI) | What It Measures | Primary Business Goal |
|---|---|---|---|
Acquisition | Customer Acquisition Cost (CAC) | The average cost to acquire one new customer. | Improve marketing efficiency. |
Engagement | Conversion Rate (CVR) | The percentage of users who complete a desired action. | Optimize user experience and messaging. |
Revenue | Return on Ad Spend (ROAS) | The revenue generated for every dollar spent on ads. | Measure campaign profitability. |
Retention | Customer Lifetime Value (CLV) | The total revenue a business expects from a customer. | Increase long-term customer loyalty. |
This table gives you a framework for thinking about which numbers matter most at each stage of the customer journey, from first click to repeat purchase.
Return on Ad Spend (ROAS)
This is a straightforward metric that performance marketing and e-commerce teams live by. It calculates the gross revenue generated for every single dollar you spend on advertising, giving you a clear, immediate look at campaign profitability.
Formula: Total Revenue from Ads / Total Ad Spend = ROAS
If that same e-commerce store spent $5,000 on its Google Ads campaign and generated $25,000 in revenue, its ROAS would be 5x. That means for every $1 they put in, they got $5 back. Simple and powerful.
Customer Lifetime Value (CLV)
CLV shifts the focus from a single purchase to the total revenue a business can expect from one customer over their entire relationship. This is an absolute must-track metric for subscription businesses like SaaS companies.
A high CLV means you have strong customer retention and loyalty, which allows you to justify a higher initial CAC. There are a few ways to calculate it, but a simple formula is:
Formula: Average Purchase Value * Average Purchase Frequency * Average Customer Lifespan = CLV
By combining these KPIs, you create a solid framework for measurement. You can always explore a broader list of marketing KPI examples to find others that fit your specific business model. The key is to pick the metrics that directly reflect your main business goals, ensuring every report you build gives you actionable insights instead of just noise.
Choosing the Right Attribution Model for Your Business
Attribution can feel like a ridiculously complex puzzle, but at its core, it's just about giving credit where credit is due. To have any real clue about your marketing effectiveness, you need to understand which of your efforts are actually making a difference. This is where picking the right attribution model becomes non-negotiable.
 Measure Marketing Effectiveness Like a Pro
Think of it like a soccer team scoring a goal. Does only the player who kicked the ball into the net get all the glory? Of course not. What about the midfielder who made the perfect pass or the defender who started the whole play? Single-touch models are like giving all the credit to the goal-scorer, while multi-touch models recognize the teamwork that led to the win.
The Limits of Single-Touch Models
Single-touch models are the easiest to wrap your head around, which is why so many businesses start with them. They assign 100% of the conversion credit to a single marketing touchpoint. Simple, but dangerously incomplete.
There are two main flavors:
- First-Touch Attribution: This model gives all the credit to the very first interaction a customer had with your brand. It’s useful for understanding which channels are best at generating initial awareness. For example, if a user stumbles upon your brand through a blog post and converts a month later, that blog post gets all the credit.
- Last-Touch Attribution: On the flip side, this model assigns all the credit to the final touchpoint before a conversion. This is the default in a lot of analytics platforms and is decent for figuring out what closes the deal. If a customer clicks a Google Ad and buys right away, that ad gets full credit.
The big problem here? Both of these models are telling a tiny fraction of the story. They completely ignore everything that happens in the middle of the customer's journey, which can be incredibly misleading. A last-touch model might totally undervalue the social media content that built trust over weeks, while a first-touch model might ignore the retargeting ad that finally pushed someone over the edge.
Embracing the Full Customer Journey with Multi-Touch Models
Multi-touch attribution models give you a much more balanced and realistic view by spreading credit across multiple touchpoints. They operate on the assumption that modern customer journeys are messy and rarely a straight line.
Let's walk through a common scenario for an e-commerce store:
- A potential customer sees an influencer’s post on Instagram (Awareness).
- A week later, they click on a Facebook retargeting ad (Consideration).
- They search for your brand on Google and click an organic link (Research).
- Finally, they convert after getting a promo email (Decision).
A single-touch model would only credit one of these steps. Multi-touch models, however, split the credit to paint a much clearer picture of what's actually working.
Multi-touch attribution isn't just about fairer credit distribution; it's about understanding the synergy between your channels. It reveals how different marketing efforts work together to guide a customer from discovery to purchase.
Let's look at how different multi-touch models would slice up the credit in our example.
- Linear Attribution: This is the most straightforward multi-touch model. It gives equal credit to every single touchpoint in the journey. In our example, the Instagram post, Facebook ad, organic search, and email would each get 25% of the credit. It’s fair, but it doesn’t account for the reality that some interactions are more impactful than others.
- Time-Decay Attribution: This model gives more credit to touchpoints that happened closer to the conversion. The final email would get the most credit, then the organic search, the Facebook ad, and finally the Instagram post. It’s a solid choice for businesses with shorter sales cycles where the most recent interactions are likely the most influential.
For a deeper dive into these and other models, our comparison of attribution models for marketers offers a detailed breakdown.
How to Select the Right Model for You
There’s no magic bullet here. The "best" attribution model depends entirely on your business goals, sales cycle, and the channels you’re using.
Here's what you need to think about:
- Sales Cycle Length: If you have a short, transactional sales cycle (like an e-commerce brand selling low-cost items), a model like Last-Touch or Time-Decay might be all you need. But for B2B companies with long, complex sales cycles that span months, a Linear or Position-Based model often provides far more valuable insights.
- Business Goals: Is your main focus generating new leads at the top of the funnel? First-Touch attribution will help you identify your best awareness channels. If your goal is to optimize for the final conversion, Last-Touch highlights what’s closing deals.
- Channel Diversity: If you rely heavily on just one or two channels, a simpler model might do the trick. But if you're running campaigns across paid search, social media, content marketing, and email, a multi-touch model is pretty much essential to understand the interplay between them.
The truth is, as we barrel towards a cookieless future, the reliance on first-party data is only going to grow. Choosing an attribution model that helps you understand your customer's complete journey is no longer just an advantage—it's a necessity for sustainable growth.
Assembling Your Marketing Measurement Tech Stack
Having the right metrics and attribution models is only half the battle. To actually measure what's working, you need the right tools to capture, process, and make sense of your data.
Without a solid tech stack, you're flying blind. You’re trying to stitch together conflicting reports from different platforms, and the picture is never quite clear. Building your stack isn't about collecting a bunch of shiny new tools; it's about creating an integrated system where data flows seamlessly, giving you a single, reliable source of truth.
The Foundation: Google Analytics 4
For just about every business out there, the starting point is Google Analytics 4 (GA4). It's the free, powerful core of your measurement foundation, tracking how people find and interact with your website and apps. Getting GA4 set up correctly is absolutely non-negotiable.
This means you have to go beyond the default installation. You must configure conversion tracking for every single action you want a user to take.
This could be things like:
- Making a purchase
- Filling out a lead form
- Signing up for a webinar
- Starting a free trial
When you define these events in GA4, you're literally telling Google what success looks like for your business. This data is then fed back into your ad platforms, helping them optimize your campaigns for real results instead of just chasing clicks.
Moving Beyond Platform-Level Reporting
While GA4 is essential, if you're only looking at it and the native analytics from ad platforms like Facebook or Google Ads, you're going to have some serious data gaps. These platforms almost always use different attribution models (usually last-touch) and have a bad habit of over-reporting their own impact. It makes getting an unbiased view next to impossible.
This is exactly where specialized attribution tools come into the picture.
Think of ad platform data as each player on a team claiming they scored the winning goal. An attribution tool is the impartial referee who reviews the entire play to determine who really deserves the credit.
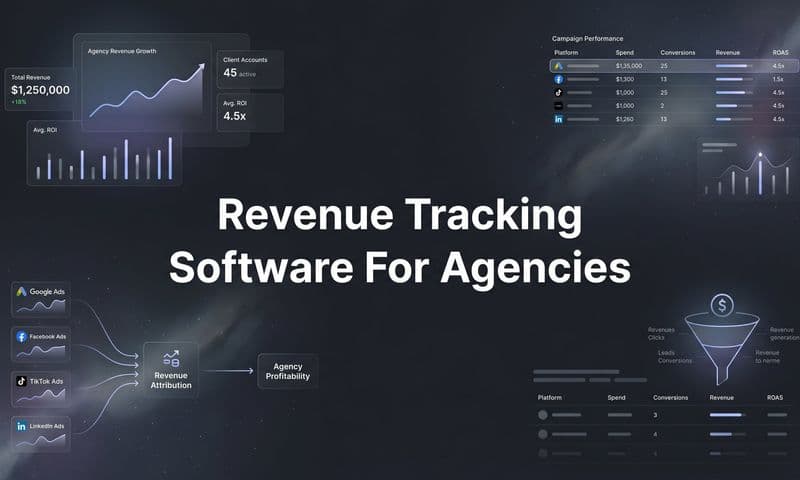
Tools like Cometly or Triple Whale are designed to solve this exact problem. They act as a central hub, pulling in data from all your marketing channels and stitching together the complete customer journey using more advanced attribution models.
This screenshot shows how a platform like Cometly can unify data from multiple sources into a single, clear dashboard.
This unified view finally lets you see how channels like Facebook, TikTok, and Google Ads are actually working together. It gives you a much more accurate Return on Ad Spend (ROAS) than you'd ever get from looking at any single platform in isolation.
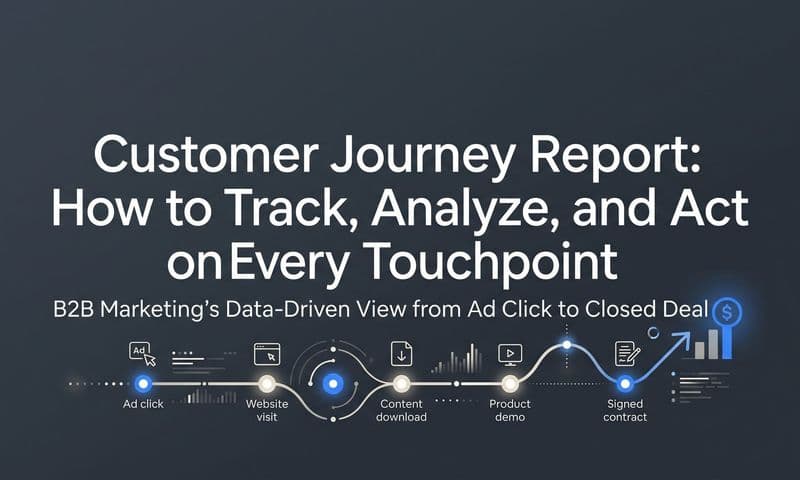
Connecting Marketing to Sales with a CRM
For many businesses, especially B2B or those with longer sales cycles, a "conversion" is just the beginning of the story. A lead from a marketing campaign is only valuable if it turns into a paying customer, right? This is why integrating your Customer Relationship Management (CRM) system is so critical.
Platforms like HubSpot or Salesforce bridge the gap between your marketing efforts and your actual sales outcomes. When your marketing tools are connected to your CRM, you can track a lead all the way from their first ad click to the final signed contract.
This connection lets you answer the most important questions:
- Which campaigns are generating the highest quality leads for the sales team?
- What is the true Customer Lifetime Value (CLV) from customers we acquire on different channels?
- What is our actual ROAS when we factor in the sales cycle length and the final deal size?
Without this link, your marketing team is just optimizing for lead volume, not revenue—a classic mistake that can waste a massive amount of your budget.
Creating a Single Source of Truth
With data flowing from your website (GA4), your ad platforms (via an attribution tool), and your sales team (CRM), the final piece is bringing it all together. Data visualization tools like Google Data Studio (now Looker Studio), Tableau, or Databox let you build custom dashboards that pull in data from all these sources.
A well-built dashboard gives every stakeholder—from the marketing specialist to the CEO—a real-time, easy-to-understand view of marketing performance. You can track high-level business goals right alongside granular campaign metrics, all in one place. For a comprehensive overview of what to consider, our guide on choosing a marketing analytics platform provides valuable insights.
Ultimately, your tech stack should tear down data silos and create clarity. By carefully selecting and integrating the right tools, you transform a bunch of scattered data points into a powerful, cohesive system for making smarter, more profitable decisions.
Turning Your Insights Into Actionable Decisions
 Measure Marketing Effectiveness Like a Pro
Let's be honest—collecting data and building fancy dashboards is the easy part. The real work, the part that actually grows a business, is turning all those numbers into smarter, faster decisions. Data is just noise until you use it to answer the most important question: "What should we do next?"
This is where you close the loop. You move from passively reporting on what happened to actively shaping what happens next. It’s a constant cycle of analysis, forming a hypothesis, testing it, and optimizing. Without this final piece, even the most expensive tech stack is just a glorified reporting tool.
From Analysis Paralysis to Clear Action
It's incredibly easy to get buried in data. The trick is to build a simple, repeatable rhythm for reviewing performance. This isn’t about staring at a dashboard all day, every day. It’s about carving out dedicated time—maybe weekly or bi-weekly—to actually think about the numbers, spot trends, and ask the tough questions.
This is the bridge between knowing your metrics and knowing how to move them. It's how you shift from seeing what happened to understanding why it happened. Our guide on making sense of actionable data dives deeper into this crucial mindset.
Troubleshooting a Common Marketing Problem
Let’s walk through a scenario I’ve seen a hundred times. You launch a new campaign, and the top-of-funnel metrics look incredible. Your Click-Through Rate (CTR) is through the roof, and you're flooding the landing page with traffic. But when you look at the bottom line, your Conversion Rate is in the gutter.
Classic disconnect. Your ad is writing checks that your landing page can't cash. Here’s how you can diagnose it:
- Check Ad-to-Landing Page Congruence: Does the message, vibe, and visual style of your ad perfectly align with the landing page? A high CTR means your creative is working, but a low conversion rate suggests the page isn't delivering on the promise.
- Analyze Landing Page Performance: Is the page slow? Is the call-to-action (CTA) buried or unclear? Is the copy compelling? Fire up a heatmap or session recording tool and see where people are getting stuck or bailing.
- Rethink Your Audience Targeting: It's possible your ad is just too appealing to a broad audience. You might be attracting curious clickers who love your ad but have zero intent to buy your product.
By walking through these steps, you can form a solid hypothesis. For example, maybe you'll realize your landing page headline has nothing to do with the hook in your ad, causing instant confusion and a high bounce rate.
The goal of troubleshooting isn't just to fix one broken campaign. It's about building a repeatable diagnostic process. This turns every failure into a priceless learning opportunity.
The Power of Continuous Optimization
Once you have a hypothesis, you test it. This is where A/B testing (or split testing) becomes your best friend. Instead of changing your landing page based on a gut feeling and just hoping it works, you test the new version against the original.
Let's stick with our example. Your hypothesis is that the headline is the weak link.
- Version A (Control): The original landing page headline.
- Version B (Variant): A new headline that directly mirrors the ad copy.
Now, you split your ad traffic 50/50 between the two pages and see which one drives a higher conversion rate. This data-driven approach takes the guesswork out of the equation and lets you stack small wins that compound over time. The same logic applies to everything—ad creative, audience targeting, email subject lines, you name it.
This relentless cycle of measuring, learning, and optimizing is what separates good marketers from great ones. Today, personalization is a huge part of this. By 2025, 56% of marketing leaders are investing in personalization tech because customers are demanding it. The global AI marketing market is even projected to jump from $20 billion in 2022 to $40 billion by 2025, proving that the shift toward tailored experiences is accelerating. You can discover more insights about these marketing trends from Deloitte Digital.
At the end of the day, measuring marketing isn't a project with a finish line. It's the ongoing rhythm of a healthy marketing organization—a continuous loop that makes sure every dollar you spend is an investment in smarter, more profitable growth.
Common Questions About Marketing Measurement
Even with a solid framework, questions always pop up. Marketers constantly run into tricky situations that data alone can't always solve. Let's tackle some of the most common pain points with clear, actionable answers to help you navigate the gray areas of marketing measurement.
How Do I Measure Offline Marketing
Measuring offline channels like print ads or events can feel like a black box, but the key is to build a digital bridge. You need a way to connect that real-world interaction to your online analytics. This creates a clear path to track performance.
For instance, if you're running a magazine ad, don't just list your homepage. Instead, give that ad a specific job to do.
- Unique QR Codes: Create a QR code that sends users to a specific, trackable landing page.
- Dedicated URLs: Print a vanity URL (e.g., yoursite.com/offer) that's only used for that specific campaign.
- Unique Discount Codes: Provide a promo code exclusive to the offline channel so you can track every sale it generates.
For events, the goal is the same. Track leads from attendee sign-up forms in your CRM to follow their journey from initial contact to a final sale. The goal is to funnel every offline touchpoint into a digital action you can actually measure.
What Are the Biggest Measurement Mistakes to Avoid
The path to effective marketing measurement is filled with common pitfalls. Falling into these traps can lead to wasted budget and misguided strategies. Being aware of them is the first step toward building a reliable system.
Here are some of the most frequent mistakes marketers make:
- Chasing Vanity Metrics: Focusing on likes and impressions instead of business outcomes like revenue and Customer Lifetime Value (CLV). These numbers feel good, but they don't prove business impact.
- Relying Only on Last-Touch Attribution: This model is the default for many platforms, but it completely ignores all the top- and mid-funnel efforts that introduced and nurtured the customer. It creates a skewed view of what's truly working.
- Lacking a Single Source of Truth: When your ad platforms, analytics, and sales data all tell a different story, you get conflicting reports and analysis paralysis. This almost always leads to poor decision-making.
- Ignoring the Sales Connection: Failing to connect marketing data with sales data from a CRM creates a massive blind spot. You might generate thousands of "leads," but you'll have no idea if they are high-quality or if they ever turn into revenue.
Avoiding these mistakes means committing to a more holistic view of performance. It requires looking beyond surface-level numbers to understand the complete customer journey and its true financial impact.
How Often Should I Review My Metrics
There’s no single right answer here—your review cadence should match the pace of the metric you're analyzing. Overreacting to daily fluctuations can be just as harmful as waiting too long to spot a negative trend.
A balanced approach works best:
- Weekly Checks: Look at your top-of-funnel metrics like ad spend, clicks, and Click-Through Rate (CTR). This allows you to quickly spot and fix campaign-level issues, like an ad that suddenly stops performing.
- Monthly or Quarterly Reviews: Reserve this time for bigger-picture business metrics like Customer Acquisition Cost (CAC) and Return on Ad Spend (ROAS). These numbers need more time to mature and reveal meaningful trends.
The key is to establish a consistent rhythm. This ensures you're agile enough to make timely adjustments without getting lost in the daily noise.
Ready to stop guessing and start knowing exactly what drives your growth? Cometly provides the single source of truth you need to measure marketing effectiveness with confidence. Unify your data, get accurate attribution, and turn insights into profitable action. See how Cometly can transform your marketing measurement today.