
It’s easy to get obsessed with the big, flashy number: total revenue. And hey, watching that top-line figure climb feels good. But if you’re not careful, it can hide a multitude of sins.
A store can rake in millions in revenue and still be teetering on the edge of collapse. Why? Because revenue tells you nothing about profitability. Are you spending a fortune to acquire each new customer? Are those customers sticking around and buying again? A high-revenue business with leaky economics isn't a success story—it's a ticking time bomb.
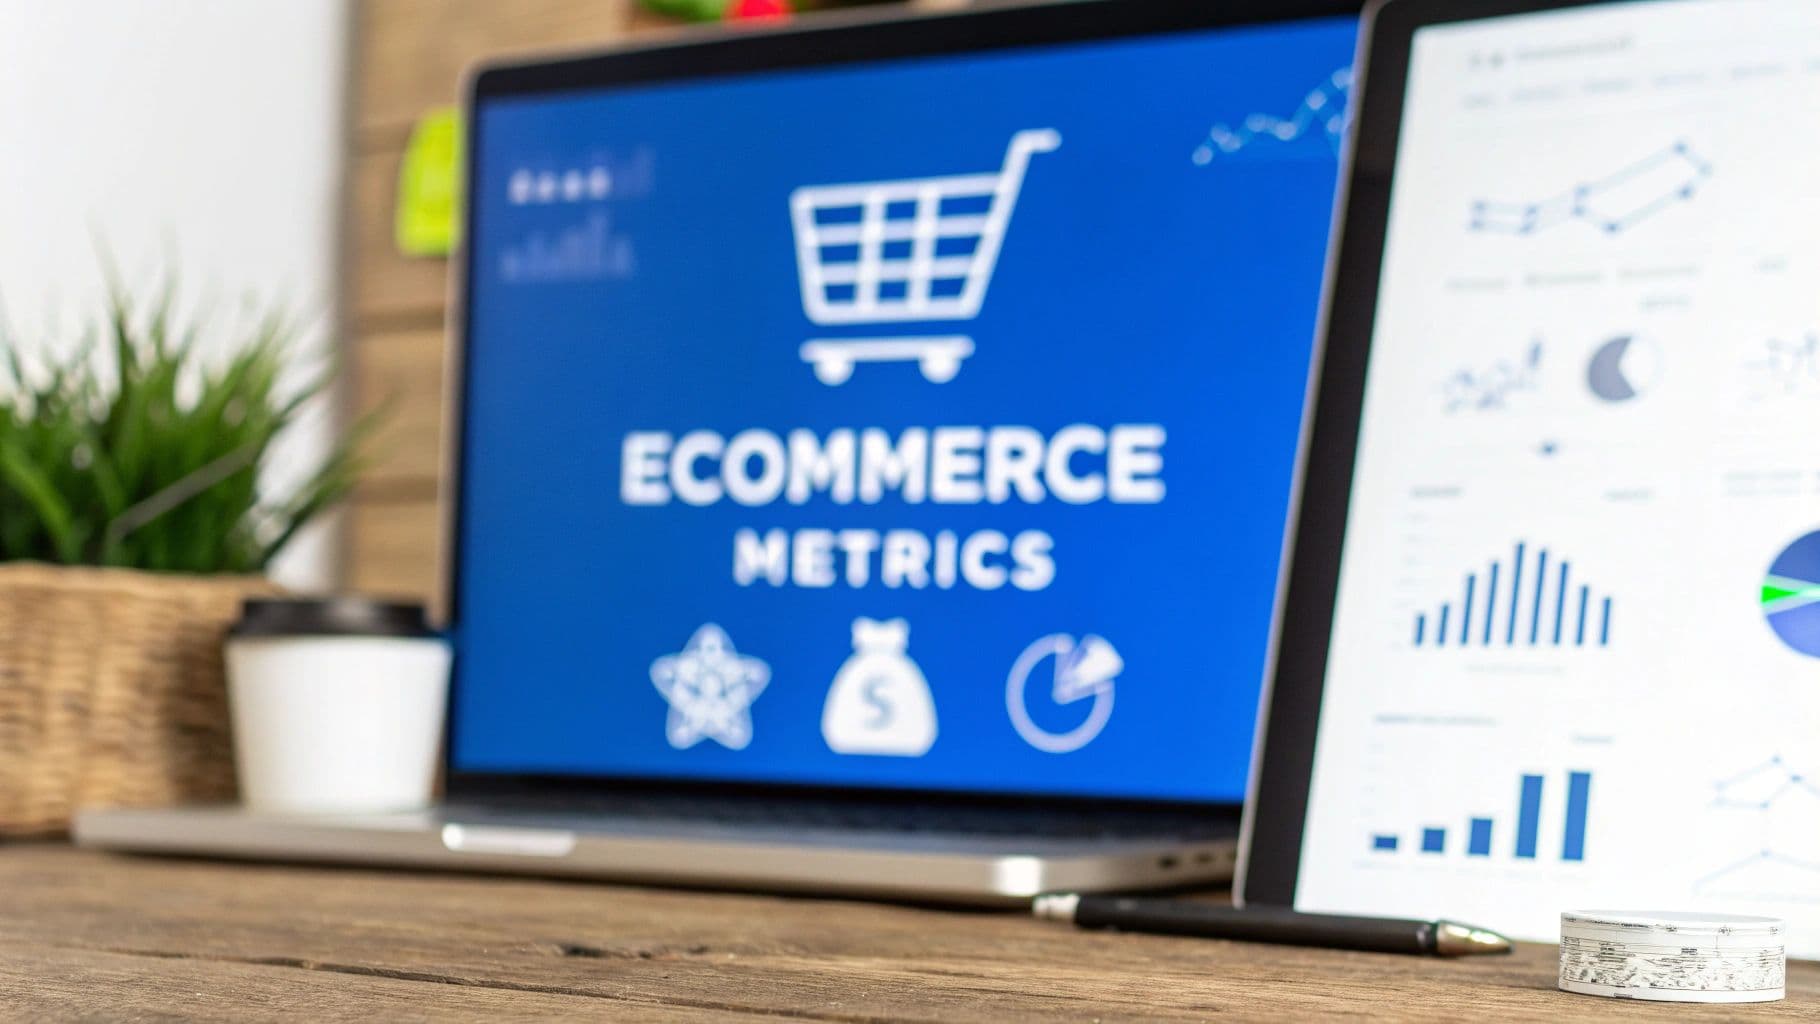
 Essential Metrics for Ecommerce Your Guide to Profitable Growth
Think of your e-commerce store like a performance race car. Revenue is your speed. It’s exciting, but it’s not the whole story. To win the race, you need to know about your fuel efficiency, oil pressure, and overall engine health. That’s what the right metrics for ecommerce do—they’re the gauges on your dashboard telling you what’s really happening under the hood.
The Metrics That Truly Matter
The most powerful metrics look beyond a single sale. They tell a story about your entire customer journey, your store's efficiency, and your real potential to scale. Get these right, and you’re on your way to building something that lasts.
Here are the three foundational numbers that every e-commerce operator needs to live and breathe:
- Average Order Value (AOV): Simply put, this is the average amount a customer spends every time they place an order. It gives you a quick snapshot of buying habits and is often the easiest metric to move with tactics like upsells, cross-sells, and product bundles.
- Customer Acquisition Cost (CAC): This is your total sales and marketing spend divided by the number of new customers you brought in. It answers the critical question: "How much are we paying to get one new person to buy from us?"
- Customer Lifetime Value (LTV): LTV is the total profit you expect to make from a single customer over the entire time they shop with you. This number shifts your focus from one-off transactions to building long-term, profitable relationships.
The secret to a sustainable e-commerce business isn’t just making sales. It’s making sure the long-term value of a customer (LTV) is significantly higher than what it costs you to acquire them (CAC).
That LTV:CAC ratio is everything. It’s the core economic engine of your business. Understanding this balance is the first step toward true profitability, guiding your decisions on everything from ad budgets and pricing to your customer retention strategy.
Before we dive deep into calculating and optimizing each of these, let's get a bird's-eye view of the essential metrics you'll want on your dashboard.
Your Ecommerce Health Checklist: Key Metrics at a Glance
This table summarizes the core metrics we'll be exploring. Think of it as your quick-reference guide to the vital signs of your business. Each one tells a piece of the story, and together, they paint a complete picture of your store's performance and potential.
Revenue measures the total income generated from all sales. It’s critical because it’s the clearest top-line indicator of sales volume and market demand, and it tells you whether the business is growing overall.
Average Order Value (AOV) measures the average amount spent per transaction. This matters because it reveals customer purchasing behavior, and it’s often one of the easiest levers to pull for growth since increasing AOV can boost revenue without needing more traffic.
Customer Lifetime Value (LTV) measures the total profit a customer generates over their entire relationship with your business. It’s critical because it determines long-term profitability and sets the ceiling for what you can afford to spend to acquire a customer while still growing sustainably.
Customer Acquisition Cost (CAC) measures the cost to acquire one new customer. This matters because it shows how efficient your marketing and sales efforts are, and if CAC rises, it usually signals problems like weaker targeting, ad fatigue, or funnel inefficiencies.
Return on Ad Spend (ROAS) measures how much revenue you generate for every dollar spent on advertising. It’s critical because it gives you a direct read on ad campaign profitability and helps you decide where to scale budget versus where to cut spend.
Conversion rate measures the percentage of visitors who complete a desired action, such as making a purchase. This is critical because it reflects how well your site turns traffic into sales, and even small improvements can create big revenue gains.
Churn rate measures the percentage of customers who stop doing business with you over a period of time. It’s critical because churn is one of the biggest growth killers, and high churn usually signals customer dissatisfaction, weak onboarding, or a lack of ongoing value.
Customer retention rate measures the percentage of customers who remain active over a period. This matters because it shows how well you’re building loyalty, and retaining customers is almost always cheaper than acquiring new ones, making it a major driver of profitable growth.
With these key metrics in mind, you're ready to move beyond just tracking sales. In the sections ahead, we’ll break down exactly how to calculate, interpret, and—most importantly—improve each one to build a healthier, more profitable e-commerce business.
Diagnosing Your Sales Funnel with Conversion Metrics
Think of your e-commerce store like a physical shop. A visitor walks in, browses the aisles, puts a few items in their basket, and heads to the checkout. Every single step is a chance to make a sale—or a chance for them to get frustrated, change their mind, and walk right back out.
Conversion metrics are your security cameras and sales associates all rolled into one. They tell you exactly where you’re losing people.
These numbers don't just track sales; they’re a diagnostic tool for your entire customer experience. They expose friction points, shine a light on UX flaws, and pinpoint the moments of hesitation that stop a visitor from becoming a buyer. Understanding them is everything, because they measure how efficiently your sales process turns traffic into revenue.
The Ultimate Barometer: Conversion Rate
The most foundational metric of all is your Conversion Rate (CVR). It answers a simple but incredibly powerful question: "Of all the people who visited my site, what percentage actually bought something?" This single number is the ultimate barometer of your store's health.
Calculating it is dead simple:
Conversion Rate = (Total Number of Sales / Total Number of Visitors) x 100
If you get 10,000 visitors in a month and make 200 sales, your conversion rate is 2%. It might not sound like much, but a tiny improvement here can create a massive ripple effect on your revenue. Bumping that up from 2% to just 3% means 100 extra sales from the exact same traffic.
Global benchmarks show just how sensitive this metric is. Most analyses put the average e-commerce conversion rate between 1.6% and 2.4%. That means for every 100 visitors, only about two will actually complete a purchase, which is exactly why optimizing every tiny step of the funnel is so critical.
Pinpointing Pre-Checkout Leaks
Before a customer can abandon their cart, they first have to add something to it. That initial moment of commitment is measured by your Add-to-Cart Rate, a metric that tells you how appealing your products are. It’s the ultimate test of whether your product pages are actually persuasive.
We compare the leading options in our AI product photo editor roundup.
If you have high traffic but a low Add-to-Cart Rate, something’s broken. It could be:
- Weak Product Photography: Your images aren't compelling or detailed enough.
- Vague Product Descriptions: Shoppers don't have the info they need to feel confident.
- Clunky Page Layout: The "Add to Cart" button is buried or isn't mobile-friendly.
- Pricing Issues: The price just doesn't feel right for the perceived value.
The Final Hurdle: Cart Abandonment Rate
Once a customer adds an item to their cart, they’re signaling strong intent to buy. The Cart Abandonment Rate measures how many of those shoppers start the checkout process but bail before paying. This is often the leakiest, most painful part of the entire sales funnel, where sales are won or lost at the last second.
Cart Abandonment Rate = (1 - [Number of Completed Purchases / Number of Carts Created]) x 100
A high abandonment rate is a massive red flag. It almost always points to friction in the checkout process itself. The usual suspects? Unexpected shipping costs, a long and confusing checkout form, a lack of payment options they trust, or forcing them to create an account.
Fixing these final barriers helps you capture revenue that was already yours for the taking. By watching these funnel metrics like a hawk, you can systematically find and fix the leaks, turning more browsers into loyal buyers. To go even deeper, check out our complete guide to conversion funnel analytics.
The Profitability Triangle: AOV, LTV, and CAC
While conversion rates tell you how well your funnel is working, the real story of your business's health is written by three interconnected metrics. Think of them as the three legs of a stool—if any one of them is weak, your whole operation becomes unstable. These are Average Order Value (AOV), Customer Lifetime Value (LTV), and Customer Acquisition Cost (CAC).
Getting a grip on these numbers is non-negotiable for sustainable growth. They shift your focus from single sales to the fundamental economics of your customer relationships, showing you whether you're building a profitable machine or just spinning your wheels.
This simple visualization shows how visitors progress through the key stages of a purchase.
 Essential Metrics for Ecommerce Your Guide to Profitable Growth
Each step in this funnel—from that first visit to the final purchase—is an opportunity to fine-tune the metrics that ultimately drive your profitability.
Defining the Key Players
First, let's get clear on what each metric really means. Each one gives you a different lens to look through, and when you put them all together, you get a complete financial picture of your business.
- Average Order Value (AOV): This is simply the average amount a customer spends every time they check out. It’s a quick pulse check on how much value you're getting from each transaction.
- Formula: Total Revenue / Number of Orders
- Customer Acquisition Cost (CAC): This is the total cost of all your sales and marketing efforts to bring in a single new customer. It tells you exactly how much you’re paying to get someone new in the door.
- Formula: Total Sales & Marketing Costs / Number of New Customers Acquired
- Customer Lifetime Value (LTV): This is the total profit you expect to make from an average customer over their entire relationship with your brand. It’s the metric that forces you to think long-term instead of just transaction-to-transaction.
- Formula: Average Purchase Value x Average Purchase Frequency x Average Customer Lifespan
Understanding these individually is useful, but their true power comes alive when you start looking at how they relate to each other.
The Ultimate Health Indicator: LTV to CAC Ratio
The single most important equation for any e-commerce business is the relationship between what you earn from a customer and what you spend to get them. This is your LTV-to-CAC ratio.
The Golden Rule: A healthy, scalable e-commerce business should aim for an LTV that is at least 3x its CAC. An LTV:CAC ratio of 3:1 means for every dollar you spend to acquire a customer, you get three dollars back in profit over their lifetime.
If your ratio is 1:1, you're actually losing money on every new customer once you factor in the cost of goods sold. On the flip side, if it's closer to 5:1 or higher, you might be underinvesting in marketing and leaving growth on the table. That 3:1 ratio is widely considered the sweet spot for sustainable scaling.
To truly understand your profitability, you first need to know how to calculate Customer Acquisition Cost (CAC), a crucial piece of the puzzle. From there, you can dive deeper into LTV. For more advanced methods, our guide on how to calculate CLTV offers additional formulas and context.
Actionable Strategies to Improve Your Ratio
Knowing your LTV:CAC ratio is one thing; improving it is another. The goal is to either increase LTV, decrease CAC, or ideally, do both at the same time.
Here are a few concrete tactics you can start with:
- To Increase AOV (which boosts LTV):
- Product Bundling: Group related products together and offer a slight discount. Think shampoo and conditioner.
- Upsells and Cross-sells: Offer a premium version or complementary items right at checkout.
- Free Shipping Thresholds: Nudge customers to add just one more item to their cart to unlock free shipping.
- To Decrease CAC:
- Optimize Ad Campaigns: Use your attribution data to cut the losing ads and double down on the winners.
- Improve Conversion Rates: A higher CVR means you get more customers from the same ad spend, which directly lowers your CAC.
- Leverage Organic Channels: Invest in SEO and content marketing to attract customers without paying directly for every click.
By systematically working to improve these core metrics for ecommerce, you take direct control of your profitability and build a business that's not just growing, but built to last.
Measuring Your Marketing with ROAS and Attribution
Pouring money into advertising without knowing what’s working is like trying to fill a bucket with a hole in it. You might see the water level rise (that’s your revenue), but you have no idea how much is leaking out through ineffective campaigns.
This is where Return on Ad Spend (ROAS) comes in. It’s arguably the single most important metric for measuring the direct profitability of your advertising.
ROAS answers a simple question: "For every dollar I put into ads, how many dollars do I get back in revenue?" It cuts through the noise of vanity metrics like clicks and impressions to tell you if your ads are actually making you money.
People often mix up ROAS and Return on Investment (ROI), but they measure different things. ROAS is laser-focused on ad campaign effectiveness—just ad spend vs. revenue. ROI is a broader business metric that calculates total profit relative to all associated costs, including ad spend, cost of goods sold, software, and overhead.
Why Your Attribution Model Is Everything
Calculating ROAS seems straightforward on the surface, but its accuracy hangs on one critical factor: attribution. Attribution is the science of assigning credit for a sale to the marketing touchpoints a customer interacted with. If your attribution is wrong, your ROAS is wrong, and you’ll end up making some disastrous budget decisions.
The oldest and most common model, last-click attribution, gives 100% of the credit to the final ad a customer clicked before buying.
The Danger of Last-Click: Imagine a customer sees your brand on a TikTok ad, later searches for it on Google, and finally clicks a retargeting ad on Facebook before purchasing. With last-click, the Facebook ad gets all the credit. This makes your TikTok and Google campaigns look like total failures.
This model dangerously oversimplifies the customer journey. It can trick you into cutting top-of-funnel campaigns that are actually introducing new customers to your brand. Modern buyers rarely see one ad and purchase immediately; their path involves multiple touchpoints across different channels.
This dashboard shows how a modern platform visualizes the complete customer journey, connecting ad spend directly to revenue.
By integrating data from all your sources, you can see exactly which ads are contributing to sales, which allows for much smarter budget allocation.
Embracing a Clearer Picture with Modern Tracking
To get an accurate ROAS, you need to move beyond simplistic models and adopt a more complete view of the customer journey. This really comes down to two key components: multi-touch attribution and server-side tracking.
Multi-touch attribution models distribute credit across multiple touchpoints, giving you a far more realistic view of what’s influencing conversions. Common models include:
- Linear: Gives equal credit to every touchpoint in the journey.
- Time-Decay: Gives more credit to touchpoints closer to the sale.
- U-Shaped: Gives the most credit to the first and last touchpoints.
At the same time, server-side tracking has become essential for data accuracy. Instead of relying on browser-based pixels—which get blocked by ad blockers and privacy updates like iOS 14—server-side tracking sends data directly from your server to the ad platforms. This results in far more reliable and complete data, ensuring your attribution isn't missing huge chunks of the picture.
By combining a multi-touch model with robust server-side tracking, you can finally trust your ROAS figures. This confidence lets you scale the campaigns that are genuinely driving growth and cut the ones that only appeared to be working. For a step-by-step guide, you can learn more about how to precisely calculate return on ad spend with these advanced methods.
Ultimately, mastering ROAS and attribution is about moving from guesswork to certainty. It’s how you stop wasting money on ineffective ads and start investing confidently in the channels that deliver real, measurable results for your e-commerce business.
Fostering Loyalty with Retention and Churn Metrics
Every marketer knows the old saying: acquiring a new customer can cost five times more than keeping an existing one. While your marketing machine is busy bringing new people in the door, the real secret to long-term, predictable profit is keeping the customers you already have.
This is where retention and churn metrics stop being boring numbers on a spreadsheet and become your most important tools for building a sustainable brand.
 Essential Metrics for Ecommerce Your Guide to Profitable Growth
Think of your customer base as a bucket you’re constantly trying to fill. If that bucket has holes, you'll lose customers just as fast as you can pour new ones in. That's customer churn, and it will silently sabotage your growth, no matter how much you spend on ads.
Retention and churn are two sides of the same coin. Together, they give you a brutally honest look at your brand’s health from the perspective of the only people who truly matter: your buyers.
Understanding the Leaky Bucket with Churn Rate
Your Churn Rate is the percentage of customers who stop buying from you over a specific period. For subscription brands, it's a make-or-break metric, but it’s just as critical for any e-commerce store. A high churn rate is a massive red flag—it tells you something is wrong with your product, customer service, or the overall experience.
Calculating it is straightforward and helps you put a number on how many customers are walking away.
Customer Churn Rate = ([Customers at Start of Period - Customers at End of Period] / Customers at Start of Period) x 100
For instance, if you start the month with 1,000 customers and end with 950, your churn rate is 5%. This metric forces you to ask tough questions: Why are people leaving? Where is the friction? Finding those answers is the first step to plugging the leaks. For a deeper look, our guide breaks down exactly how to calculate customer churn in more detail.
Measuring Loyalty with Retention and Repeat Purchases
While churn shows you who’s leaving, Customer Retention Rate (CRR) shows you who’s staying. It’s the percentage of customers who stick around over time, and a high retention rate is a clear sign of a healthy brand with a happy, loyal following.
To get even more specific, look at your Repeat Purchase Rate. This tracks how many customers come back for a second, third, or fourth purchase. It’s a direct measure of product satisfaction and brand loyalty. You can give this a serious boost with a few smart moves:
- Personalized email campaigns that recommend products people actually want.
- Loyalty programs that reward customers for sticking with you.
- Knock-your-socks-off customer service that turns a frustrating problem into a reason they love your brand.
For a full playbook on building loyalty, it’s worth diving into guides focused on customer retention metrics. These resources can give you a clear roadmap for building a more resilient customer base.
Finding the Source of the Problem
Improving retention isn't just about big-picture strategies; it’s about finding the specific moments where you’re letting customers down. Just like cart abandonment shows you there’s a problem at checkout, other metrics can point to issues much earlier in the journey.
Take the add-to-cart rate. Benchmarks show average add-to-cart rates hover around 7.5–7.7% of sessions, yet global cart abandonment is a staggering 70% or more. One analysis even puts the cart abandonment rate at 71.3% overall, jumping to 77.2% on mobile, where any friction gets amplified.
By keeping an eye on these related metrics for ecommerce, you can create a smooth, enjoyable experience from the very first click all the way through to their tenth purchase. Ultimately, focusing on retention isn't just about saving a few bucks on acquisition—it's about building a real community of fans who will champion your brand and drive predictable, long-term revenue.
Your Ecommerce Metrics Questions Answered
Diving into e-commerce metrics can feel like trying to drink from a firehose. You’re surrounded by data points, but which ones actually move the needle? Let's cut through the noise and answer the most common questions store owners have, giving you a clear path to making smarter, data-driven decisions.
The secret isn’t tracking everything; it’s tracking the right things at the right time. Your priorities will naturally shift as your business evolves from a startup fighting for its first sale to an established brand focused on building long-term loyalty. Getting this evolution right is everything.
What Are the Best Tools for Tracking Metrics?
You can't manage what you don't measure, and the right tools are what give you an accurate picture of your performance. While there are countless platforms out there, a solid tech stack usually boils down to a few key players.
- Google Analytics: This is the non-negotiable starting point for almost everyone. It’s a powerful, free tool for tracking website traffic, user behavior, conversion rates, and more. It answers the fundamental questions: who are your visitors, and what are they doing on your site?
- Platform-Specific Dashboards: Your e-commerce platform (like Shopify, BigCommerce, or WooCommerce) has its own built-in analytics. This is your go-to for a quick, top-line look at revenue, AOV, and product performance.
- Marketing Attribution Software: To really understand your marketing ROI, you need a dedicated attribution tool. Platforms like Cometly go way beyond last-click models to show you the entire customer journey, connecting ad spend directly to revenue with server-side tracking for maximum accuracy.
- Email Marketing Platforms: Tools like Klaviyo or Mailchimp give you deep insights into email performance. You can track open rates, click-through rates, and most importantly, the actual revenue generated from each campaign.
The goal is to build a "single source of truth" by integrating these tools. When your ad platform, analytics, and store data all tell the same story, you can make budget decisions with complete confidence.
Which Metrics Should I Prioritize?
This is the million-dollar question. And the answer depends entirely on where you are in your business journey. Focusing on the wrong KPI at the wrong time is a classic recipe for wasted effort and stalled growth. A brand-new store has completely different priorities than a multi-million dollar brand.
So, let's break down which metrics for ecommerce matter most at each stage.
Here's a guide to help you focus your energy where it will have the biggest impact.
Which Metrics to Prioritize by Business Stage
In the Launch stage (0–6 months), your primary metric focus should be Conversion Rate (CVR) because your main job is proving that people will actually buy the product. Your secondary focus should be website traffic and add-to-cart rate, since you need enough visitors to test demand and you want to see early signals of interest even before everything is fully optimized.
In the Growth stage (6–24 months), your primary metric focus shifts to Customer Acquisition Cost (CAC) and Return on Ad Spend (ROAS). At this point, the goal is no longer just getting sales, it’s acquiring customers profitably and consistently. Your secondary focus becomes Average Order Value (AOV) and repeat purchase rate, because improving the value of each customer helps you scale faster without needing to spend dramatically more on ads.
In the Scale stage (24+ months), your primary metric focus becomes Customer Lifetime Value (LTV) and churn rate, since long-term profitability and retention determine how big the business can get. Your secondary focus should be Net Promoter Score (NPS) and customer retention rate, because building loyalty and a strong customer experience is what creates sustainable growth and protects your margins as you scale.
In the beginning, your sole mission is achieving product-market fit. Don't obsess over LTV when you've only made 50 sales. Instead, pour all your energy into optimizing your conversion rate. Once you have a predictable sales funnel, you can shift your focus to acquiring customers efficiently and then, finally, to maximizing their long-term value. This progressive focus keeps you from getting distracted by metrics that don't matter... yet.
How Often Should I Check My Metrics?
Just as you can focus on the wrong metrics, you can also check them too often—or not often enough. Obsessing over real-time sales can be a stressful distraction, but ignoring your data for a month means you might miss a critical problem until it's too late.
Here’s a practical schedule that works for most brands:
- Daily (5-Minute Check): Glance at top-line revenue, conversion rate, and ROAS. The goal here is just to spot major anomalies—like a sudden drop in sales—that could signal a technical issue on your site.
- Weekly (30-Minute Review): Dive deeper into campaign-level performance. Look at your traffic sources, CAC trends, and cart abandonment rate. This is where you make tactical adjustments to your marketing.
- Monthly (1-Hour Analysis): Assess the bigger picture. Review LTV, churn rate, and overall profitability. Use this time for strategic planning and setting goals for the next month.
This structured approach prevents data overload while ensuring you stay on top of what truly matters. For a more detailed look at the numbers you should be tracking, our guide on e-commerce analytics provides a deeper dive into setting up your measurement strategy.
Ready to get crystal-clear attribution and finally see which ads are driving real revenue? With Cometly, you can unify your tracking, get a true picture of your customer journey, and scale your business with confidence. See how Cometly can transform your marketing analytics.


