
Running paid advertising campaigns across multiple business locations creates a unique challenge: understanding which ads drive results at each specific location. Without proper tracking, you end up with aggregated data that tells you overall performance but hides the location-specific insights you need to optimize budgets and scale winning campaigns.
When you're managing ads for five, ten, or fifty locations, the stakes get higher. A campaign that crushes it in Dallas might tank in Denver. Your best-performing ad creative in Miami could be your worst performer in Seattle. But if your tracking lumps everything together, you're flying blind.
The problem compounds when you factor in iOS privacy updates that limit pixel accuracy, offline conversions at physical locations that never connect back to your digital ad spend, and team members at different locations implementing tracking inconsistently. You end up with fragmented data across platforms, making it nearly impossible to answer the most critical question: which locations generate the best return on ad spend?
This guide walks you through setting up comprehensive ad tracking for multi-location businesses, from structuring your campaigns correctly to connecting all touchpoints so you can see exactly which ads drive leads and revenue at each location. By the end, you'll have a clear system for tracking customer journeys across all your locations, comparing performance between regions, and making data-driven decisions about where to invest your ad spend.
Step 1: Audit Your Current Tracking Setup and Identify Gaps
Before you build anything new, you need to understand what you're working with. Most multi-location businesses discover significant tracking gaps during this audit—and that's actually good news, because you can't fix what you don't know is broken.
Start by reviewing your existing tracking across all ad platforms. Log into Meta Ads Manager, Google Ads, and any other platforms you're running campaigns on. For each location you advertise, check whether the platform pixel or tag is properly implemented on the corresponding landing pages or website sections.
Create a simple spreadsheet with columns for each location and rows for each tracking element: Meta Pixel status, Google Ads conversion tracking, Google Analytics property, phone call tracking, form submission tracking, and any other conversion points relevant to your business. Mark each cell as "Implemented," "Partially Working," or "Missing." This visual map reveals patterns quickly.
Many multi-location businesses discover that their original locations have solid tracking while newer locations were never properly set up. Or that certain conversion events fire correctly on desktop but fail on mobile. Document everything you find, especially issues related to multi-location business conversion tracking that need immediate attention.
Next, identify disconnected data sources. Check whether your CRM is linked to your ad platforms. If customers submit leads through your website but those leads live in a CRM that never talks to Meta or Google, you're missing the closed-loop reporting that shows actual revenue generated per location.
Look at your website events. Open your browser's developer tools and navigate to your site. Submit a test lead or complete a test conversion. Watch the Network tab to see which tracking pixels fire. If you're running campaigns for ten locations but only see generic conversion events without location identifiers, you've found a critical gap.
List the specific metrics you need to track per location. Most multi-location businesses need: leads by location, phone calls to location-specific numbers, in-store visits, online purchases with location attribution, and ultimately revenue per location. Write down every conversion point that matters to your business model.
The audit phase feels tedious, but it's the foundation for everything else. You're building a roadmap that shows exactly what needs to be fixed, implemented, or improved. Keep this document handy—you'll reference it throughout the setup process.
Step 2: Structure Your Campaigns with Location-Specific Naming Conventions
Campaign structure makes or breaks your ability to analyze performance by location. Without a consistent naming system, you'll spend hours every week manually sorting through campaigns trying to figure out which ads ran where.
Create a naming taxonomy that includes location identifiers in every campaign, ad set, and ad name. A solid format looks like this: [Location]_[Objective]_[Audience]_[Date]. For example: "NYC_LeadGen_Homeowners_Q2" or "LA_Conversions_Retargeting_Apr2026."
The location identifier should come first because it allows for instant filtering and sorting. When you're reviewing performance in Ads Manager, you can quickly filter to see all NYC campaigns, all LA campaigns, or compare performance across regions.
Set up location-based campaign structures that mirror your business operations. If you have distinct service areas, create separate campaigns for each. If you're running the same offer across multiple locations, use campaign budget optimization at the location level so you can see exactly how much you're spending per region.
Some advertisers prefer broader geographic targeting with location-specific ad sets underneath. Others create entirely separate campaigns per location. The right choice depends on your budget size and how independently each location operates. Larger budgets benefit from separate campaigns because you get more control over spend allocation. Smaller budgets work better with consolidated campaigns and location-specific ad sets.
Implement UTM parameters with location variables for accurate source tracking. Every ad should include UTM tags that specify the location: utm_campaign=spring_promo&utm_source=facebook&utm_medium=paid&utm_content=nyc_location. These parameters flow into your analytics platform and allow you to segment traffic and conversions by location even before they hit your CRM. Understanding attribution tracking for multiple campaigns becomes essential at this stage.
Build a UTM taxonomy that scales. If you're managing dozens of locations, create a standardized list of location codes (NYC, LA, CHI, MIA) and require all team members to use the same codes consistently. Inconsistency here—where one person uses "NYC" and another uses "NewYork"—fragments your data and makes reporting impossible.
Document your naming system in a shared resource that all team members can access. Create a one-page guide that shows the required format, provides examples for different campaign types, and explains what each element means. When new team members join or when you're setting up a new location, this documentation ensures consistency.
The time you invest in campaign structure pays dividends every single week when you're analyzing performance, building reports, or making budget reallocation decisions. Clean structure equals clean data.
Step 3: Implement Server-Side Tracking for Accurate Cross-Location Data
Browser-based tracking falls apart for multi-location businesses. iOS privacy updates block a significant portion of conversions from being tracked through pixels. Ad blockers remove another chunk. Cross-device customer journeys—where someone clicks an ad on mobile but converts on desktop—create attribution gaps.
When you multiply these issues across multiple locations, the data loss compounds. You might be capturing only 60-70% of actual conversions, which means your cost-per-lead calculations are wrong, your ROAS metrics are understated, and your budget allocation decisions are based on incomplete information. These multi-device tracking problems require a more robust solution.
Server-side tracking solves this by capturing conversion data on your server before it ever reaches a browser. When a customer submits a lead, makes a purchase, or completes any valuable action, your server sends that conversion event directly to Meta, Google, and other ad platforms—bypassing browser limitations entirely.
Setting up server-side tracking requires technical implementation, but the accuracy improvement is substantial. You'll need to configure your server to send conversion events to the Meta Conversions API and Google's server-side conversion tracking. Most modern marketing platforms and attribution tools handle this integration for you.
The key for multi-location businesses is ensuring your server-side events include location identifiers. When your server sends a conversion to Meta, it should specify which location that conversion belongs to. This allows you to maintain location-level reporting while benefiting from server-side accuracy.
Connect your CRM and point-of-sale systems to capture offline conversions per location. Many multi-location businesses lose attribution when customers convert offline—they click an ad, visit a physical location, and make a purchase that never gets connected back to the original ad.
Modern attribution platforms can close this loop by matching CRM records to ad clicks based on email, phone number, or other identifiers. When a lead enters your CRM with location information, the attribution platform connects it back to the ad campaign that drove it, even if the conversion happened days later or at a physical location.
Verify tracking accuracy by comparing server-side data against platform-reported metrics. Run a test campaign for one location and track conversions through both client-side pixels and server-side implementation. You'll likely see 20-40% more conversions captured server-side—those are real conversions that browser-based tracking missed.
This accuracy gap matters enormously when you're allocating budgets across locations. If your Dallas location appears to have a $150 cost-per-lead based on pixel data, but server-side tracking reveals it's actually $110, you've been underinvesting in a high-performing location. Multiply that across ten or twenty locations and you see why accuracy is critical.
Server-side tracking also feeds better data back to ad platform algorithms. When Meta and Google receive complete conversion data, their machine learning systems optimize more effectively, finding more customers who match your actual converter profile rather than just the subset of converters that pixels captured.
Step 4: Connect All Touchpoints to a Centralized Attribution Platform
Running multi-location campaigns means juggling data from Meta Ads Manager, Google Ads, your website analytics, your CRM, possibly call tracking software, and location-specific point-of-sale systems. Each platform shows a piece of the puzzle, but none show the complete picture.
A centralized attribution platform integrates all these data sources into a single dashboard where you can see the entire customer journey from first ad click through to location-specific conversion. This unified view is what transforms fragmented data into actionable insights. Solving multiple ad platforms tracking problems starts with this centralization.
Start by integrating all your ad platforms into the attribution tool. Connect Meta, Google, LinkedIn, and any other channels you're running. The platform should pull in campaign performance data, ad spend, and click data automatically.
Next, connect your website tracking. This means integrating Google Analytics or whatever analytics platform you use, plus any form tracking, chat tools, or other website conversion points. The attribution platform needs to see every touchpoint a customer has with your brand.
Integrate your CRM so the platform can see which leads converted into customers and track revenue by location. This connection is critical because it allows you to move beyond vanity metrics like clicks and impressions to actual business outcomes: revenue generated per location, customer lifetime value by acquisition source, and true ROAS calculations.
Map customer journeys from first ad click through to location-specific conversion. A complete attribution platform shows you that a customer saw your Meta ad on Monday, clicked your Google ad on Wednesday, visited your website twice, submitted a lead form, and ultimately became a customer at your Chicago location generating $5,000 in revenue.
This journey mapping reveals patterns you'd never see in siloed platform data. You might discover that your highest-value customers at certain locations typically interact with three or four touchpoints before converting, while lower-value customers convert after just one. Understanding multiple touchpoint tracking complexity helps you structure campaigns more effectively.
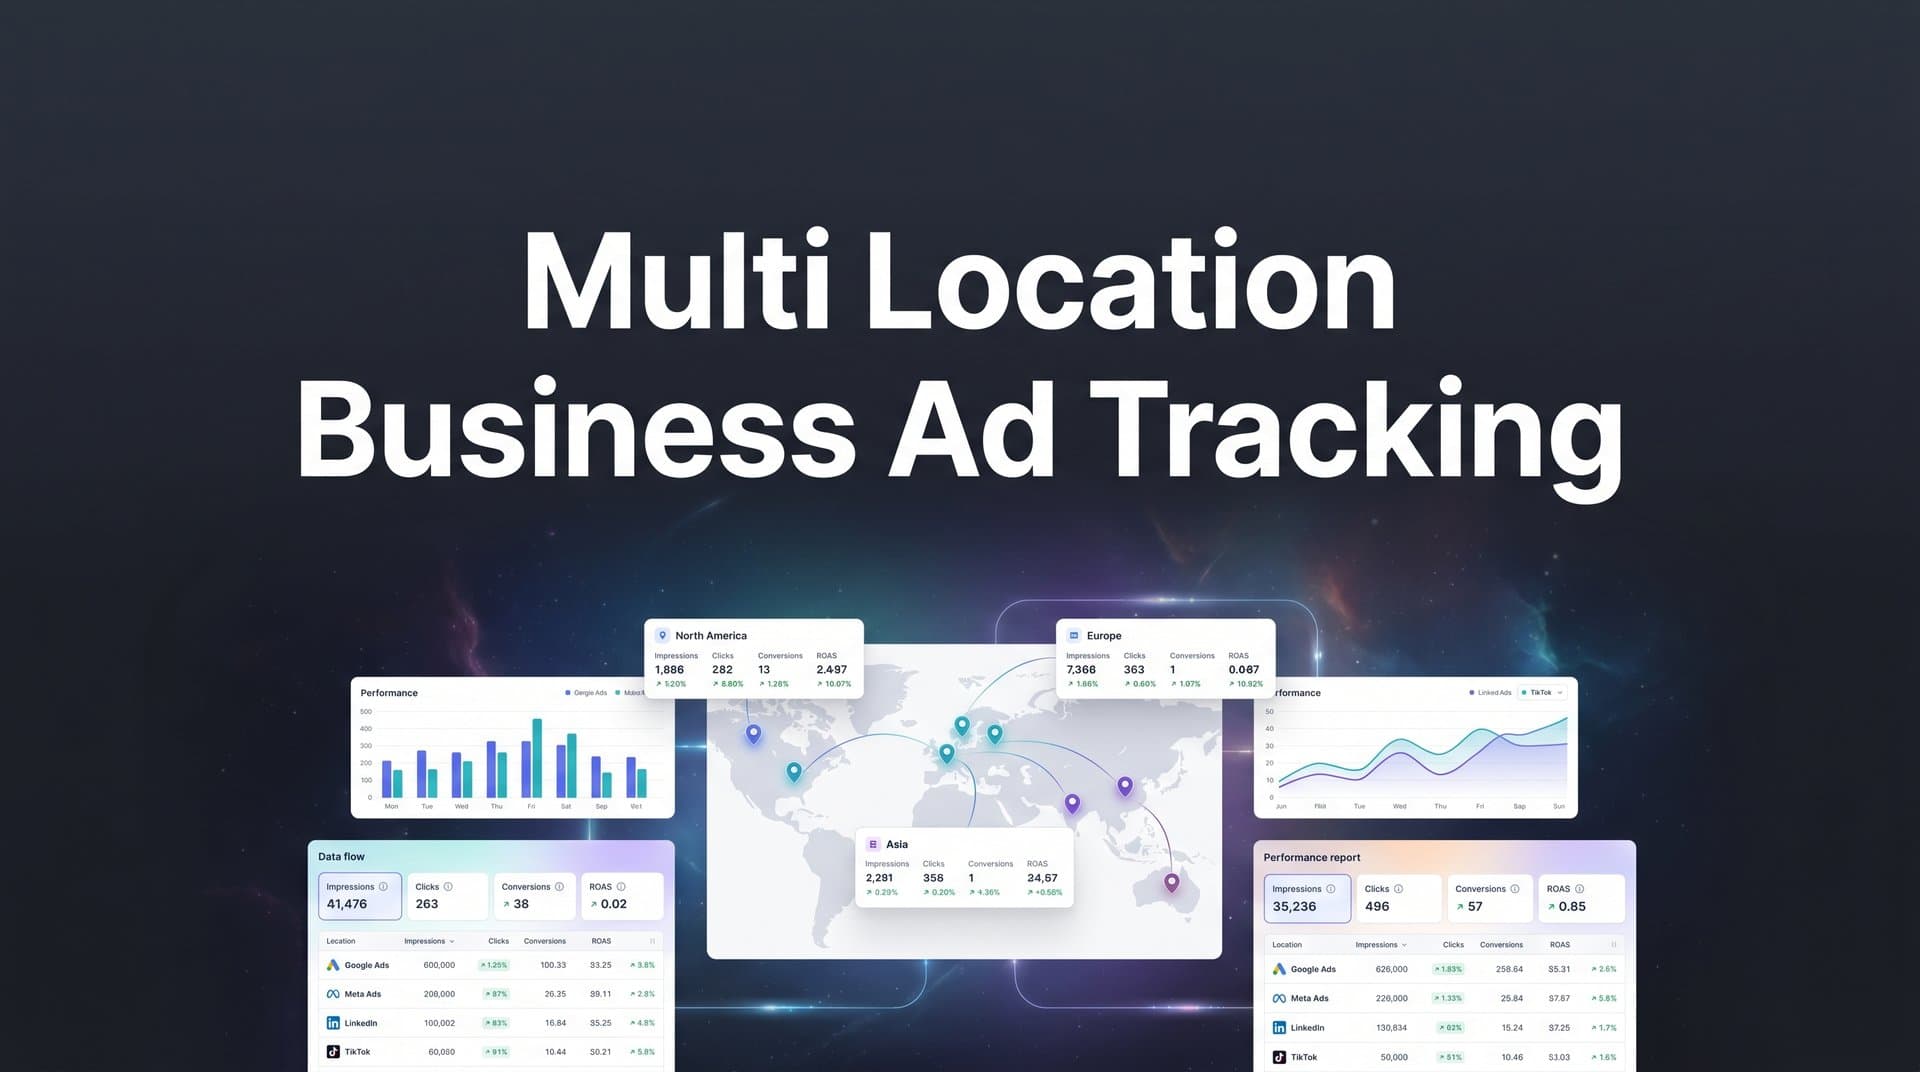
Set up location-based views to analyze performance by region, city, or individual store. Your attribution dashboard should allow you to filter by location instantly—showing all campaigns, all channels, and all customer journeys for your NYC locations versus your LA locations.
Build saved views for common analyses: top-performing locations by ROAS, locations with the lowest cost-per-acquisition, locations where certain channels outperform others, and locations that show the highest customer lifetime value. These saved views turn your attribution platform into a decision-making tool rather than just a reporting tool.
Configure multi-touch attribution to understand which channels assist conversions at each location. Single-touch attribution (first-click or last-click) misses the reality that customers interact with multiple touchpoints before converting. Multi-touch attribution assigns credit across the entire journey.
For multi-location businesses, this matters because different channels often play different roles in different markets. Meta might be your primary driver in urban locations while Google Search dominates in suburban areas. Multi-touch attribution reveals these patterns so you can optimize your channel mix by location.
Step 5: Configure Conversion Events That Distinguish Between Locations
Generic conversion events destroy your ability to analyze performance by location. If every lead submission fires the same "Lead" event regardless of which location it's for, you're back to aggregated data that hides location-specific insights.
Create location-specific conversion events or use event parameters to distinguish between locations. You have two approaches: create separate events for each location (Lead_NYC, Lead_LA, Lead_Chicago) or create a single Lead event with a location parameter that specifies which location.
The parameter approach scales better for businesses with many locations. Instead of managing hundreds of separate conversion events, you manage one event with dynamic parameters. When someone submits a lead for your Denver location, the event fires as "Lead" with location=Denver. Your attribution platform and ad platforms can then segment by that parameter. This approach aligns with best practices for tracking conversions across multiple ad platforms.
Set up conversion values that reflect location-specific revenue or lead quality. Not all leads are created equal. A lead at your Manhattan location might be worth $200 on average while a lead at your suburban location might be worth $150. Assigning accurate conversion values allows ad platforms to optimize toward the leads that matter most.
Calculate average customer value by location using your CRM data. Look at the last six months of customers, segment by acquisition location, and calculate average revenue per customer. Use these values as your conversion values when setting up events.
This value-based approach changes how ad platforms optimize. Instead of just finding more leads, they find more valuable leads. Meta's algorithm will prioritize showing your ads to people who match the profile of your high-value customers at each location.
Sync enriched conversion data back to ad platforms to improve their optimization algorithms. The more complete and accurate data you send to Meta and Google, the better their machine learning systems perform. When you send back conversions with location identifiers, conversion values, and customer details, you're feeding the algorithm exactly what it needs to find more customers like your best ones.
Modern attribution platforms handle this conversion sync automatically. When a lead converts in your CRM at a specific location, the platform sends that conversion back to the ad platform that drove it, including all the enriched data about location, value, and customer attributes.
Test your conversion tracking by submitting test leads at different locations and verifying attribution. Create test scenarios for each location: submit a form, make a test purchase, or complete whatever conversion action matters to your business. Then check three places: your attribution platform (does it show the conversion with the correct location?), the ad platform (did the conversion fire back to Meta or Google?), and your CRM (does the lead appear with proper location tagging?).
Run these tests for each location before you launch campaigns. Finding tracking issues during testing costs nothing. Finding them after you've spent thousands on ads costs real money and corrupts your data.
Step 6: Build Location Comparison Dashboards and Set Performance Benchmarks
Data without dashboards is just noise. You need visual, at-a-glance views that show location performance side-by-side so you can spot patterns, identify opportunities, and make quick decisions about budget allocation.
Create dashboards that show performance metrics for all locations in a single view. Your primary dashboard should include: total ad spend by location, leads or conversions by location, cost per lead by location, revenue by location, and ROAS by location. Arrange these as a table where each row is a location and each column is a metric.
Add visual elements like color coding to highlight performance. Green for locations exceeding benchmarks, yellow for locations performing at benchmark, red for locations underperforming. This visual system lets you scan your dashboard in seconds and know exactly where to focus your attention.
Build secondary dashboards for deeper analysis. Create views that show: channel performance by location (which locations perform best on Meta versus Google), creative performance by location (which ad variations work in different markets), audience performance by location (which targeting segments convert best where), and time-based trends by location (how performance changes week-over-week or month-over-month). Implementing a comprehensive tracking solution for multi-location business makes this level of analysis possible.
Establish benchmarks for cost per lead, ROAS, and conversion rates by location type or region. Not all locations should be held to the same standard. Urban locations might have higher costs per lead but also higher customer values. Suburban locations might have lower costs but also lower conversion rates.
Calculate benchmarks based on historical data. Look at your top-performing 25% of locations and use their metrics as aspirational benchmarks. Look at your median performers and use those as baseline benchmarks. This gives you realistic targets that account for market differences.
Set up automated alerts when a location's performance drops below benchmarks. Most attribution platforms and analytics tools allow you to configure alerts based on custom conditions. Create alerts for: cost per lead exceeding benchmark by 25%, ROAS dropping below minimum threshold, conversion rate declining week-over-week, or ad spend reaching daily budget without generating conversions.
These alerts catch problems early. If your Seattle location suddenly sees conversion rates drop by 40%, you want to know immediately so you can investigate—maybe your landing page broke, maybe your tracking stopped firing, or maybe a competitor launched an aggressive campaign. The faster you catch issues, the less money you waste.
Schedule a regular reporting cadence to review location performance and reallocate budgets. Weekly reviews work well for most multi-location businesses. Block 30-60 minutes every Monday to review your dashboards, compare locations, and make budget decisions for the week ahead.
During these reviews, ask specific questions: Which locations exceeded ROAS targets? Which locations should receive budget increases? Which locations underperformed and need optimization or budget cuts? Are there seasonal patterns emerging in certain locations? Which campaigns should be paused and which should scale?
Document your decisions and the reasoning behind them. This creates accountability and helps you learn over time which types of optimizations work best for your business. After three months of weekly reviews, you'll have a clear playbook for how to manage multi-location performance.
Putting It All Together
With your multi-location ad tracking system in place, you now have visibility into which campaigns drive results at each specific location. This clarity transforms how you manage advertising—no more guessing which locations deserve more budget, no more treating all markets the same, no more flying blind on performance.
Use this data to shift budgets toward high-performing locations. When your Miami location consistently delivers a 5x ROAS while your Denver location struggles at 2x, the decision becomes obvious. Reallocate budget to Miami, scale what's working, and either optimize or pause what's not.
Replicate winning ad strategies across regions. When you discover that a specific ad creative crushes it in Chicago, test it in similar markets. Your attribution platform shows you which locations have similar customer profiles, conversion patterns, and market dynamics—use that intelligence to expand successful campaigns strategically.
Identify underperforming areas that need optimization. Sometimes a location underperforms because the campaigns are wrong. Other times it's a market issue. Your tracking data reveals which is which. If a location has high click-through rates but terrible conversion rates, the problem is likely your landing page or offer, not the market. Fix the conversion path and watch performance improve.
Quick checklist to verify your setup is complete: All locations have server-side tracking implemented and verified. Campaign naming conventions include location identifiers consistently across all platforms. CRM and ad platforms are connected through a centralized attribution tool. Conversion events distinguish between locations using parameters or separate events. Dashboards allow location-by-location comparison with clear benchmarks. Automated alerts notify you when performance drops below thresholds.
Review your location performance weekly and let the data guide your scaling decisions. The businesses that win with multi-location advertising are the ones that treat each location as its own market with its own data, its own benchmarks, and its own optimization strategy. Your tracking system gives you the foundation to do exactly that.
Ready to elevate your marketing game with precision and confidence? Discover how Cometly's AI-driven recommendations can transform your ad strategy—Get your free demo today and start capturing every touchpoint to maximize your conversions.


