You're looking at your marketing dashboard, and the numbers don't add up. Facebook claims credit for 80% of your conversions. Google Ads insists it drove 70%. Your email platform says it influenced 60%. The math is impossible, but the confusion is real.
This is the attribution puzzle that keeps marketers awake at night.
With customer journeys now spanning 20+ touchpoints across multiple channels, choosing the wrong attribution model isn't just a technical mistake—it's a budget disaster waiting to happen. Every model tells a different story about what's working. First-touch attribution champions your awareness campaigns. Last-touch gives all the glory to your retargeting ads. Multi-touch tries to split the difference.
Here's the truth: there's no single "perfect" attribution model. The goal isn't finding theoretical perfection—it's understanding which model aligns with your actual business goals and customer journey complexity.
The stakes have never been higher. With iOS privacy changes and cookie deprecation reshaping the tracking landscape, accurate attribution has become both more important and more challenging. Misallocate your budget based on flawed attribution, and you're essentially funding the wrong channels while starving the ones that actually drive revenue.
These seven strategies will help you systematically evaluate, test, and implement the right attribution approach for your business. Not based on guesswork or industry trends, but on real data from your actual customers.
1. Map Your Customer Journey Before Choosing Any Model
The Challenge It Solves
Most marketers choose attribution models backward. They pick a model first, then force their data into it. The result? Attribution that misrepresents how customers actually buy from you.
If your typical customer touches 15 channels over 60 days before converting, a last-click model will systematically undervalue your awareness campaigns. If 80% of your customers convert within 24 hours of first contact, a complex multi-touch model adds unnecessary complexity without improving decisions.
The Strategy Explained
Before evaluating any attribution model, document your actual customer journey patterns. Pull conversion data from the past 90 days and analyze journey length, touchpoint count, and channel mix.
Look for patterns: What's the median number of touchpoints before conversion? How long is the typical consideration period? Which channels appear most frequently in converting journeys? Do customers typically discover you through one channel and convert through another?
This baseline understanding ensures your attribution model matches reality rather than theory. A B2B SaaS company with 45-day sales cycles needs fundamentally different attribution than an e-commerce store where 70% of purchases happen within hours of discovery.
Implementation Steps
1. Export conversion data from your analytics platform covering the past 90 days, ensuring you capture all touchpoints across channels.
2. Calculate median journey length (days from first touch to conversion), median touchpoint count, and identify your top 5 most-visited channels in converting journeys.
3. Segment this analysis by customer value—high-value customers often follow different paths than low-value ones, requiring different attribution approaches.
Pro Tips
Create a visual journey map showing typical paths to conversion. This becomes your reference point when evaluating whether an attribution model makes sense for your business. Update this map quarterly as customer behavior evolves.
2. Run Side-by-Side Model Comparisons Using the Same Dataset
The Challenge It Solves
Attribution models aren't just different philosophies—they produce radically different budget recommendations. When you apply only one model, you're making decisions blind to how other approaches would interpret the same data.
The difference between first-touch and last-touch attribution can shift millions in budget allocation. Without comparing models side-by-side, you can't see where credit shifts or understand which channels are over-credited versus under-credited.
The Strategy Explained
Apply multiple attribution models to identical conversion data simultaneously. This reveals exactly how each model distributes credit across your marketing mix.
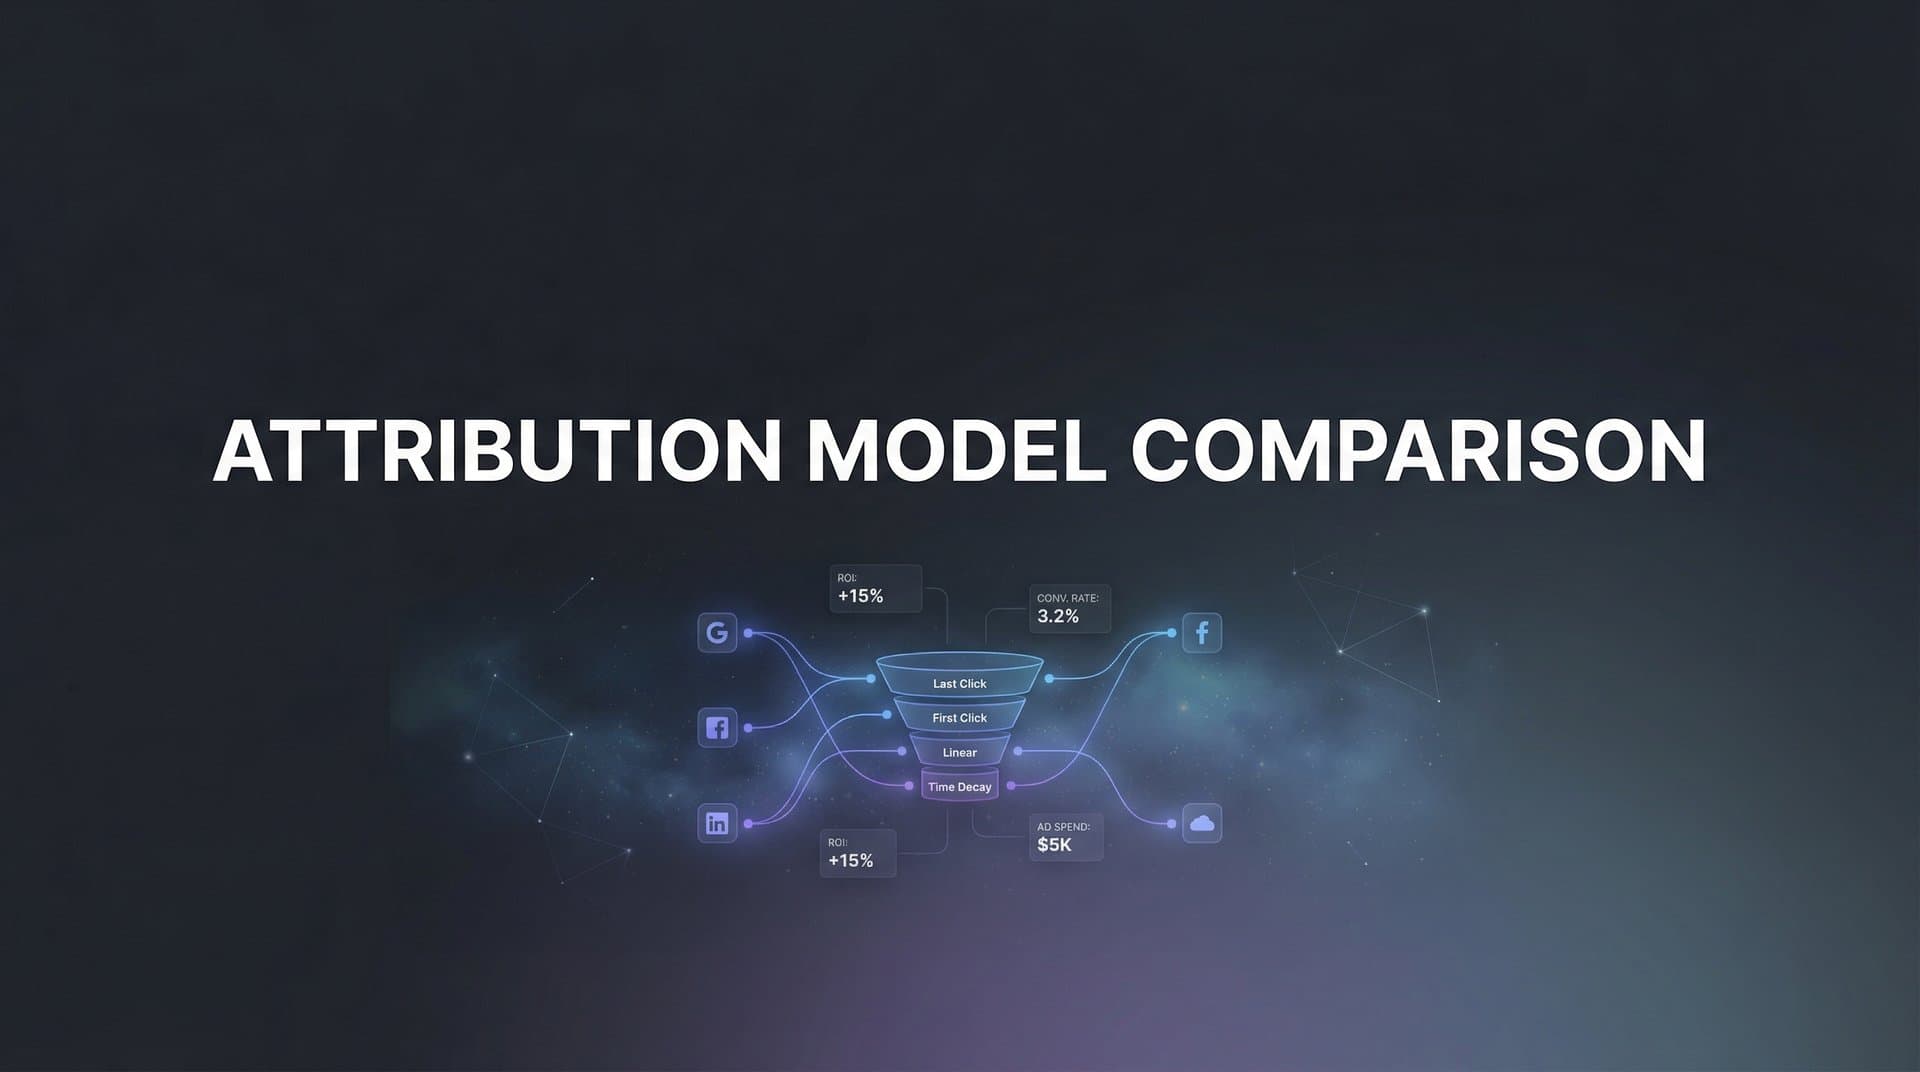
Compare at least four models: first-touch, last-touch, linear (equal credit to all touchpoints), and time-decay (more credit to recent touchpoints). For each model, calculate the attributed value for every channel.
The magic happens in the differences. If a channel gets 40% credit in first-touch but only 5% in last-touch, that tells you something important about its role in your funnel. It's strong at discovery but weak at conversion—valuable information for optimization.
Implementation Steps
1. Select a consistent date range (30-90 days) and export complete conversion path data including all touchpoints, timestamps, and conversion values.
2. Apply each attribution model to this dataset and create a comparison table showing how each model distributes credit across channels.
3. Calculate the variance between models for each channel—channels with high variance across models play different roles in different journey stages.
Pro Tips
Create a simple spreadsheet that shows each channel's attributed value under different models. Sort by variance to quickly identify channels where model choice matters most. These high-variance channels deserve deeper analysis and potentially controlled testing.
3. Align Attribution Models with Specific Campaign Objectives
The Challenge It Solves
Using one attribution model for all campaigns creates a fundamental mismatch. Brand awareness campaigns exist to introduce your company to new audiences. Conversion campaigns exist to close deals. Judging both by the same attribution lens systematically undervalues upper-funnel efforts.
When last-touch attribution governs all budget decisions, awareness campaigns get defunded because they rarely get conversion credit. When first-touch rules everything, retargeting campaigns look worthless despite driving actual revenue.
The Strategy Explained
Match attribution model to campaign objective. Awareness campaigns should be evaluated using first-touch or position-based models that credit discovery. Conversion campaigns perform best under last-touch or time-decay models that emphasize closing actions.
This doesn't mean using different models arbitrarily. It means acknowledging that different campaigns serve different purposes in your funnel. Your awareness display ads shouldn't compete for budget against your conversion-focused search campaigns using the same attribution logic.
Create distinct performance frameworks: awareness campaigns measured by first-touch attributed value and new customer acquisition, conversion campaigns measured by last-touch attributed value and revenue, nurture campaigns measured by position-based attribution showing influence across the journey.
Implementation Steps
1. Categorize every active campaign by primary objective—awareness, consideration, or conversion—based on targeting, creative, and intended audience stage.
2. Assign appropriate attribution models to each category: first-touch for awareness, position-based for consideration, last-touch or time-decay for conversion.
3. Evaluate campaign performance within its category using its aligned attribution model, comparing awareness campaigns to other awareness campaigns rather than mixing objectives.
Pro Tips
Document your attribution-objective alignment in a simple matrix that your entire team can reference. This prevents debates about why different campaigns use different attribution—the model matches the goal, not arbitrary preference.
4. Test Attribution Assumptions with Controlled Budget Experiments
The Challenge It Solves
Attribution models make assumptions about causation. They suggest that because a channel appeared in the conversion path, it influenced the conversion. But correlation isn't causation.
Your attribution model might show that email drives 30% of revenue. But what if customers who were already planning to buy simply clicked an email on their way to checkout? The email got credit, but it didn't cause the conversion. Without testing, you can't distinguish influence from coincidence.
The Strategy Explained
Validate attribution insights through controlled budget experiments. If your attribution model suggests a channel is underperforming, test reducing spend. If it claims a channel is highly valuable, test increasing investment.
The key is incrementality—measuring the actual lift a channel provides beyond what would have happened anyway. Run holdout tests where you pause a channel for a control group while maintaining it for a test group. Compare conversion rates between groups to measure true incremental impact.
This approach transforms attribution from theoretical credit assignment into validated cause-and-effect understanding. You're no longer guessing whether a channel matters—you're measuring whether removing it actually hurts performance.
Implementation Steps
1. Identify channels where attribution models show high value but you're uncertain about actual impact, prioritizing channels with significant budget allocation.
2. Design a controlled test by reducing spend by 20-30% for two weeks while maintaining all other channels, or create geographic holdout groups where the channel pauses in specific regions.
3. Measure the actual impact on conversions and revenue compared to your attribution model's predictions—if the model was accurate, you'll see proportional decline in results.
Pro Tips
Start with channels where you have the most doubt about attribution accuracy. These experiments are most valuable when they challenge your assumptions rather than confirming what you already believe. Document results to build institutional knowledge about which attribution insights prove accurate versus misleading.
5. Compare Platform-Native Attribution Against Independent Tracking
The Challenge It Solves
Every ad platform has an incentive to claim credit for conversions. Facebook's attribution, Google's attribution, and LinkedIn's attribution all use different methodologies, different lookback windows, and different definitions of "influence."
The result? Attribution inflation where platforms collectively claim credit for 200% of your actual conversions. When you optimize based on platform-reported attribution alone, you're essentially letting each platform grade its own homework.
The Strategy Explained
Cross-reference platform-native attribution against independent server-side tracking. Server-side tracking captures conversion events directly from your server rather than relying on browser cookies or platform pixels, providing a neutral view of what actually drove conversions.
Compare what Facebook claims it drove versus what your independent tracking shows. Look for systematic discrepancies—platforms typically over-report conversions because they use longer lookback windows, view-through attribution, and cross-device modeling that credits them for conversions they barely influenced.
This comparison reveals where you're potentially overspending based on inflated platform claims. It also identifies legitimate tracking gaps where your independent system might be under-counting conversions that platforms are correctly attributing.
Implementation Steps
1. Implement server-side tracking that captures conversion events independently from ad platform pixels, ensuring you have a neutral source of truth for conversion data.
2. Export conversion reports from each ad platform and compare them to your independent tracking data for the same time period, looking for percentage differences by platform.
3. Investigate large discrepancies by examining specific conversion paths to understand whether platforms are over-claiming credit or your independent tracking has gaps.
Pro Tips
Focus first on platforms with the largest budget allocation—a 20% attribution discrepancy matters much more on a channel spending $50,000 monthly than one spending $5,000. Use this analysis to negotiate more realistic performance targets with platform reps who rely on their native attribution.
6. Factor in Lookback Windows When Comparing Model Performance
The Challenge It Solves
Lookback windows determine how far back in time an attribution model considers touchpoints. A 7-day lookback only credits interactions from the past week. A 90-day lookback credits touchpoints from three months ago.
The lookback window you choose dramatically affects attribution results. If your typical sales cycle is 45 days but you're using a 7-day lookback window, you're systematically under-crediting awareness campaigns that happened weeks before conversion. If your sales cycle is 3 days but you're using a 90-day window, you're giving credit to ancient touchpoints that had nothing to do with the actual purchase decision.
The Strategy Explained
Test the same attribution model with different lookback windows matched to your actual sales cycle. Start with windows at 7 days, 14 days, 30 days, 60 days, and 90 days.
Analyze how credit distribution changes as you extend the lookback window. For most businesses, you'll see credit shift from lower-funnel channels toward upper-funnel channels as the window lengthens. The optimal window is the one that captures your complete customer journey without including irrelevant ancient touchpoints.
Your journey mapping from Strategy #1 provides the answer. If 80% of your customers convert within 30 days of first touch, a 30-day lookback captures the relevant journey. Extending to 90 days just adds noise.
Implementation Steps
1. Apply your chosen attribution model using multiple lookback windows simultaneously—7, 14, 30, 60, and 90 days—to the same conversion dataset.
2. Chart how attributed value shifts across channels as the lookback window extends, paying attention to which channels gain credit and which lose it.
3. Select the lookback window that aligns with your median customer journey length from your journey mapping analysis, ensuring you capture complete paths without excessive historical noise.
Pro Tips
Different product lines or customer segments may warrant different lookback windows. High-ticket B2B products with 60-day cycles need longer windows than impulse e-commerce purchases. Consider segmenting attribution by product category with appropriate lookback windows for each.
7. Build a Continuous Model Review Cadence
The Challenge It Solves
Customer behavior isn't static. The journey that worked last quarter might look completely different this quarter. Seasonal shifts, competitive changes, economic conditions, and platform updates all alter how customers discover and buy from you.
Set your attribution model once and forget it, and you're making decisions based on outdated assumptions. The model that accurately represented your customer journey six months ago might be systematically misallocating budget today.
The Strategy Explained
Schedule quarterly attribution model reviews to validate that your current approach still matches customer behavior. This isn't about constantly changing models—it's about confirming your model remains accurate or identifying when shifts are needed.
Each quarter, repeat your journey mapping analysis. Compare current journey length, touchpoint count, and channel mix against the previous quarter. Look for significant shifts: Are journeys getting longer or shorter? Are new channels becoming more prominent? Has the typical path to conversion changed?
When you spot meaningful changes in customer behavior, re-run your model comparison analysis to determine whether a different attribution approach better matches the new reality. Document these reviews to build institutional knowledge about how your attribution needs evolve.
Implementation Steps
1. Calendar quarterly attribution reviews at the start of each quarter, blocking time for the full analysis including journey mapping, model comparison, and performance validation.
2. Create a standardized review template that compares current quarter metrics against previous quarters—journey length, touchpoint count, channel distribution, and attributed value by model.
3. Set decision thresholds for when changes are warranted: if journey length shifts by more than 20% or a new channel captures more than 15% of touchpoints, trigger a full model re-evaluation.
Pro Tips
Involve your entire marketing team in quarterly reviews. Attribution affects everyone's budget and performance metrics. Collaborative reviews build shared understanding and prevent attribution from becoming a black box that only analysts understand. Document not just what changed, but why you made specific attribution decisions.
Putting It All Together
Effective attribution model comparison isn't a one-time project—it's an ongoing practice that keeps your marketing decisions aligned with reality.
Start with journey mapping to understand your actual customer behavior. Then run side-by-side model comparisons to see how different approaches interpret your data. Validate what attribution suggests through controlled budget experiments that test real-world impact.
The goal isn't theoretical perfection. It's confident budget decisions backed by data you trust. When you know which attribution model matches your customer journey, which lookback window captures relevant touchpoints, and which platform claims are accurate versus inflated, you can allocate budget with precision rather than guesswork.
This systematic approach transforms attribution from a confusing technical problem into a strategic advantage. While competitors argue about which model is "best," you're using the model that's best for your specific business, validated by your specific data, and updated as your customers evolve.
Ready to elevate your marketing game with precision and confidence? Cometly's multi-touch attribution and analytics dashboard enables you to compare models, track the complete customer journey across every touchpoint, and make data-driven decisions in one place. From ad clicks to CRM events, Cometly captures everything—providing a complete view of what's really driving your revenue. Get your free demo today and start making smarter marketing decisions backed by accurate, actionable attribution data.