You're staring at your marketing dashboard at 2 AM, trying to figure out why your latest campaign burned through budget without delivering results. The data is all there—clicks, impressions, conversions—but none of it tells you what actually went wrong or what to do next.
Most marketers today are drowning in data but starving for insights that actually drive decisions. The difference between those proving clear ROI and those struggling to justify their budgets isn't access to more data—it's knowing which data matters and how to act on it.
In 2026's privacy-first landscape, with iOS tracking limitations and cookie deprecation reshaping customer measurement, the old playbook of vanity metrics and last-click attribution simply doesn't work anymore. The marketers winning right now have mastered specific data practices that transform overwhelming spreadsheets into clear, actionable strategies.
These ten best practices will help you cut through the noise, focus on metrics that matter, and make confident decisions that scale your marketing efforts profitably.
1. Calculate Customer Acquisition Cost
Best for: Understanding the true cost of acquiring each customer across all marketing channels
Cometly is an advanced attribution platform that helps marketers calculate accurate customer acquisition costs by tracking the complete customer journey.
Most marketing teams are flying blind, crediting their last touchpoint while ignoring the 6-11 interactions that actually influenced the sale. You're probably doing it right now—celebrating that "winning" retargeting campaign while starving the social ads that introduced customers to your brand in the first place.
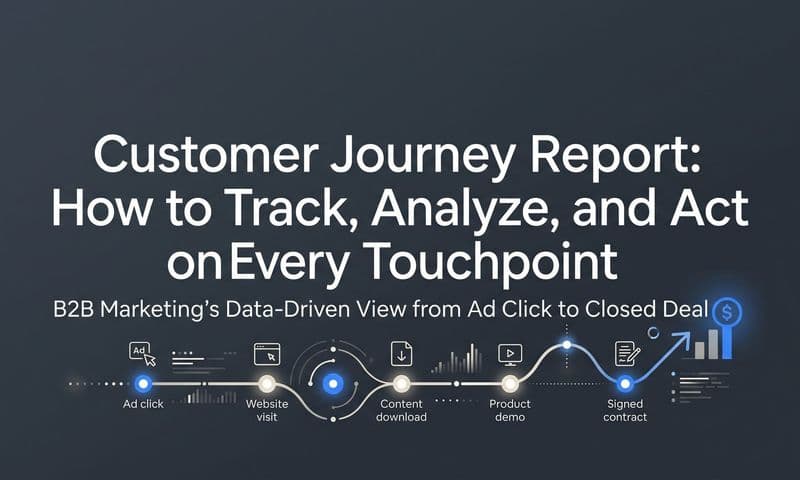
Multi-touch attribution changes this by mapping every touchpoint in your customer's journey, from first awareness to final purchase. Instead of giving 100% credit to the last click, you see how your Facebook ad, Google search, email campaign, and retargeting display all worked together to drive that conversion.
Why Single-Touch Attribution Fails: When you only credit the last touchpoint, you systematically undervalue top-of-funnel activities. That brand awareness campaign that introduced 10,000 people to your product? It gets zero credit because those customers converted through a Google search weeks later. This leads to cutting successful awareness campaigns and over-investing in bottom-funnel tactics that simply capture demand you've already created elsewhere.
The reality is that B2B buyers typically interact with your brand 7-12 times before converting, while ecommerce customers average 5-8 touchpoints. Each interaction plays a role, and understanding that role transforms how you allocate budget.
Choosing Your Attribution Model: Different models serve different business needs. Linear attribution splits credit equally across all touchpoints—useful when you genuinely believe each interaction matters equally. Time-decay attribution gives more credit to recent interactions, which works well for shorter sales cycles where the final touchpoints have outsized influence. Position-based attribution credits 40% to first touch, 40% to last touch, and splits the remaining 20% among middle interactions—a solid starting point for most businesses.
For companies with significant data volume, data-driven attribution uses machine learning to assign credit based on actual conversion patterns rather than predetermined rules. This approach adapts to your specific customer behavior but requires thousands of conversions to generate reliable insights.
The Server-Side Tracking Advantage: Browser-based tracking misses 20-40% of customer interactions due to ad blockers, privacy settings, and cross-device behavior. Server-side tracking captures data directly from your servers, bypassing these limitations. When someone clicks your ad on their phone but converts on their laptop three days later, server-side tracking connects those dots while browser cookies fail.
Implementation requires technical setup, but the data completeness makes it essential for accurate attribution. You're not just getting more data—you're getting the missing pieces that explain why customers actually convert.
Connecting Your Data Sources: Multi-touch attribution only works when you unify data from all marketing channels. This means connecting your ad platforms (Facebook, Google, LinkedIn), email system, CRM, website analytics, and any other customer touchpoints into a single view. Tools like Cometly specialize in this integration, automatically capturing and connecting touchpoints across platforms to show the complete customer journey.
Without this integration, you're looking at isolated channel performance rather than understanding how channels work together. Your email might not directly drive many conversions, but it could be the critical touchpoint that moves customers from awareness to consideration, making your retargeting campaigns effective.
Avoiding Platform Bias: Facebook Ads Manager and Google Ads both offer attribution reporting, but they're inherently biased toward showing their own platform's value. Facebook's attribution window might claim credit for conversions that happened days after someone scrolled past your ad, while Google credits searches that happened because your Facebook campaign created awareness.
Use third-party attribution tools that have no stake in which channel performs best. This unbiased view often reveals that your budget allocation should shift significantly from what platform-native reporting suggests.
Comparing Attribution Models: Don't commit to a single attribution model—compare multiple models to understand how perspective changes insights. When last-click attribution shows one channel winning while linear attribution reveals a completely different story, you've uncovered important insights about how your data analysis marketing approach needs to evolve for more accurate decision-making.
2. Track Customer Lifetime Value
Best for: Measuring the total revenue generated by each customer over their entire relationship with your business
HubSpot is a comprehensive CRM platform that tracks customer lifetime value by connecting marketing, sales, and service data in one unified system.
Most marketing teams celebrate when they acquire a new customer, then forget to track what happens next. This blind spot costs businesses millions in misallocated budget. You might be pouring money into channels that attract one-time buyers while underfunding sources that bring customers who stick around for years.
Customer Lifetime Value isn't just a metric—it's the lens that transforms how you evaluate every marketing decision. When you know a customer acquired through organic search typically generates $2,400 over three years while a social media customer averages $800, suddenly your entire budget allocation strategy shifts. The channel that looked "expensive" on a cost-per-acquisition basis becomes your most profitable investment.
Why Attribution Models Must Match Your Business Reality
Your attribution model isn't a technical detail—it's the framework that determines which marketing activities get credit and funding. Choose wrong, and you'll systematically defund the channels driving your most valuable customers.
For B2B companies with 3-6 month sales cycles, linear attribution makes strategic sense. When prospects attend three webinars, download two whitepapers, and engage with five email campaigns before converting, each touchpoint genuinely contributes to the decision. Linear attribution recognizes this reality by distributing credit across the journey, revealing which early-stage activities actually influence high-value deals.
Ecommerce businesses with shorter consideration periods benefit from time-decay models. When customers research for a week then purchase, the interactions closest to conversion carry more decision weight. Time-decay attribution reflects this by giving more credit to recent touchpoints while still acknowledging earlier awareness activities.
The critical mistake? Using last-click attribution while running awareness campaigns. This approach systematically undervalues top-of-funnel activities, leading you to cut the very channels that feed your conversion funnel.
Implementing CLV Tracking That Drives Decisions
Start by connecting your marketing data to actual customer behavior over time. This means integrating your analytics platform with your CRM and transaction systems to track not just the first purchase, but every subsequent interaction.
Calculate Cohort-Based CLV: Group customers by acquisition month and channel, then track their cumulative revenue over 12, 24, and 36 months. This reveals which sources deliver customers who grow in value versus those who churn quickly.
Factor in Full Costs: Include product costs, support expenses, and operational overhead when calculating true customer profitability. A high-revenue customer who requires extensive support may be less valuable than a moderate-revenue customer who's self-sufficient.
Identify Value Indicators Early: Analyze your highest-CLV customers to find early behavioral signals that predict long-term value. Companies often discover that customers who engage with specific features or content types in their first 30 days have 3-5x higher lifetime value.
Segment by Value Tiers: Create distinct customer segments based on predicted CLV, then analyze which marketing channels and campaigns deliver each tier. This enables sophisticated budget allocation that optimizes for customer quality, not just quantity.
Matching Attribution to Your Sales Cycle
Your sales cycle length should directly inform your attribution approach. Short cycles (under 7 days) can use simpler models because fewer touchpoints influence decisions. Long cycles (90+ days) require sophisticated multi-touch attribution to understand the complex journey.
For B2B SaaS companies with enterprise sales, position-based attribution often works well. This model gives 40% credit to first touch (how they discovered you), 40% to last touch (what drove the demo request), and distributes 20% across middle interactions. This acknowledges both awareness and conversion while recognizing nurture activities.
Subscription businesses should implement attribution that tracks not just initial conversion but also expansion revenue. Understanding which acquisition channels bring customers who upgrade, add seats, or purchase additional products transforms how you evaluate purchase marketing tracking software effectiveness and allocate resources across your entire customer journey.
3. Test Everything with Statistical Significance
Best for: Running valid A/B tests and experiments that produce reliable, actionable results
Optimizely is an experimentation platform that helps marketers run statistically valid tests across websites, apps, and campaigns.
Most marketers make decisions based on trends that look promising but aren't statistically valid. You run an ad test for three days, see a 15% lift, and immediately scale budget—only to watch performance crater the following week. This happens because you stopped the test before reaching statistical significance, mistaking random variance for genuine improvement.
Statistical significance is the mathematical confidence that your results aren't due to chance. Without it, you're essentially gambling with your marketing budget, making decisions on incomplete data that leads to false conclusions and wasted spend.
The cost of ignoring statistical rigor is substantial. You might kill winning campaigns that had a temporary dip, or scale losing variations that happened to perform well during an unrepresentative sample period. Even worse, you build institutional knowledge based on false positives, creating a culture of decisions that feel data-driven but are actually just sophisticated guesswork.
Calculate Sample Size Before Testing Begins
The biggest mistake in marketing testing is starting without knowing how much data you need. Sample size calculations tell you exactly how many conversions or interactions you need to detect meaningful differences with confidence.
Before launching any test, determine your baseline conversion rate, the minimum improvement you want to detect (typically 10-20%), and your desired confidence level (usually 95%). Online calculators make this straightforward—input these variables and you'll get the required sample size per variation.
For example, if your current conversion rate is 2% and you want to detect a 15% improvement with 95% confidence, you'll need approximately 15,000 visitors per variation. This means if you get 1,000 visitors daily, your test needs to run for at least 15 days per variation to reach valid conclusions.
Many marketers discover they need far more data than expected, which explains why their previous "winning" tests often failed when scaled. Understanding sample size requirements upfront prevents premature decisions and sets realistic timelines for testing programs.
Establish Clear Success Metrics and Thresholds
Define exactly what success looks like before running tests. This prevents the common trap of cherry-picking metrics after seeing results—a practice that invalidates statistical testing entirely.
Choose one primary metric (conversion rate, revenue per visitor, cost per acquisition) as your success criterion. You can track secondary metrics for learning, but don't let them influence the go/no-go decision. Set your significance threshold at 95% confidence minimum, meaning you're willing to accept only a 5% chance that results are due to random variation.
Document these decisions before launching tests. This pre-commitment prevents bias and ensures you're making decisions based on statistical evidence rather than wishful thinking or pressure to show results.
Run Tests Through Complete Business Cycles
Stopping tests too early is the most common way marketers generate false positives. Customer behavior varies by day of week, time of month, and season—factors that can dramatically skew results if not accounted for.
Run tests for at least one full week to capture weekday versus weekend behavior differences. For businesses with monthly billing cycles or paycheck-driven purchasing patterns, extend tests to cover full monthly cycles. Retail and ecommerce should account for promotional periods and seasonal fluctuations.
The temptation to stop early when seeing positive results is strong, especially under pressure to optimize quickly. Resist this urge. Early positive results often regress to the mean as more data accumulates. Proper testing tools show you when you've reached statistical significance, but even then, running slightly longer provides additional confidence.
Use Proper Testing Tools That Prevent Peeking Bias
Checking test results repeatedly before reaching statistical significance—called "peeking"—dramatically increases false positive rates. What should be a 5% error rate can jump to 30% or higher with frequent checking. This is where understanding how do marketers use data to evaluate results becomes critical for maintaining testing integrity and avoiding costly mistakes.
4. Use Customer Data Platforms
Best for: Unifying customer data from all touchpoints into a single, actionable view
Segment is a customer data platform that collects, cleans, and connects customer data from every source to create unified customer profiles.
Most marketing teams treat UTM parameters like an afterthought—slapping them on links inconsistently or skipping them entirely when deadlines loom. This casual approach creates a data nightmare that makes accurate attribution impossible. When your Facebook campaign uses "utmsource=facebook" while your colleague's uses "utmsource=FB" and another uses "utm_source=social", you're not tracking three campaigns—you're creating three separate data silos that fragment your insights.
The real cost hits when you're trying to make budget decisions. Without consistent UTM parameters, you can't accurately compare performance across campaigns, identify which messaging resonates, or understand which channels drive your best customers. You end up flying blind, making million-dollar decisions based on incomplete data.
Why UTM Consistency Transforms Attribution Accuracy
UTM parameters are the foundation of digital marketing attribution. These simple URL tags tell your analytics platform exactly where traffic originated, which campaign drove it, and what specific creative or message they clicked. When implemented consistently, UTMs create a clear data trail from first click to final conversion.
The challenge is that UTM parameters are deceptively simple to use but surprisingly difficult to standardize across teams, campaigns, and time periods. A single inconsistent parameter can split your data, making a successful campaign appear mediocre because its traffic is divided across multiple source classifications.
Think about analyzing quarterly performance when your UTM naming changed three times during those months. You can't aggregate data, compare trends, or identify patterns because your tracking taxonomy keeps shifting. This inconsistency doesn't just complicate reporting—it actively prevents you from learning what works.
Building Your UTM Parameter Framework
Establish Clear Naming Conventions: Create a documented standard for each UTM parameter that everyone follows. Use lowercase consistently, replace spaces with underscores or hyphens, and define specific values for common sources. For example, always use "facebook" not "Facebook", "FB", or "fb". Define whether paid social is "paid_social" or "paidsocial" and stick with it.
Document Campaign Taxonomy: Build a reference guide that shows exactly how to tag different campaign types. Specify that email campaigns use "utmsource=email" and "utmmedium=newsletter" or "utm_medium=promotional". Define how to differentiate between organic social posts versus paid social ads. This documentation becomes your team's single source of truth.
Create UTM Templates: Build spreadsheet templates or use UTM builder tools that enforce your naming conventions. Include dropdown menus with approved values for source, medium, and campaign parameters. This prevents typos and ensures consistency even when team members are rushing to launch campaigns.
Implement Approval Workflows: Require UTM parameter review before campaigns launch, especially for significant budget initiatives. A quick five-minute check catches inconsistencies before they corrupt your data. This is particularly critical when working with agencies or contractors who may not know your internal standards.
Audit Existing Parameters Regularly: Schedule monthly reviews of your UTM parameter usage. Export your analytics data and look for variations that indicate inconsistent tagging. When you find "facebook", "Facebook", and "fb" all appearing as separate sources, you've identified a standardization problem that needs immediate correction.
Advanced UTM Strategy for Maximum Insight
Beyond basic source and medium tracking, strategic UTM usage unlocks deeper insights. Use utmcampaign to track specific initiatives across channels, allowing you to see total performance regardless of where ads ran. Use utmcontent to test different ad creatives or email subject lines, identifying which messaging drives best results.
For sophisticated attribution, implement utm_term for tracking specific audience segments or targeting parameters. This lets you analyze performance by audience type, not just by channel. You might discover that your "high-intent" audience segment converts at 3x the rate of broader targeting, justifying premium CPMs. Modern marketing data solutions can automatically parse and analyze these parameters to surface insights that would take hours to uncover manually.
5. Implement Predictive Analytics for Proactive Optimization
Best for: Forecasting customer behavior and campaign outcomes before they happen
Salesforce is a CRM platform with Einstein AI that uses predictive analytics to forecast customer behavior, lead scoring, and revenue outcomes.
Most marketers are stuck playing defense—reacting to yesterday's data while their competitors are already optimizing for tomorrow. Predictive analytics flips this script entirely, using historical patterns and machine learning to forecast outcomes before they happen. This forward-looking approach transforms marketing from a reactive cost center into a proactive growth engine.
Think about it: What if you could identify which customers are about to churn before they stop engaging? Or predict which prospects will become your highest-value customers based on their first few interactions? That's the power of predictive analytics—it turns your historical data into a crystal ball for smarter, faster decisions.
Building Your Predictive Foundation
Predictive analytics isn't magic—it's pattern recognition at scale. The foundation starts with collecting sufficient historical data, typically 12-24 months minimum, to train accurate models. Your data needs to include both inputs (customer behaviors, campaign interactions, demographic information) and outcomes (conversions, revenue, churn events).
The key is identifying which early indicators actually predict future outcomes. Does email engagement in the first week correlate with long-term customer value? Do certain content downloads signal high purchase intent? These predictive signals become the building blocks of your models.
Modern marketing platforms and customer data platforms increasingly include built-in predictive capabilities, making this more accessible than ever. Tools like Cometly use AI to analyze your complete customer journey data and surface patterns that predict which campaigns and channels will drive the best results.
Practical Predictive Applications
Customer Lifetime Value Prediction: Instead of waiting months to see which customers become valuable, predictive models score prospects based on early behaviors. This lets you allocate acquisition budgets toward channels bringing in high-predicted-value customers, even if their initial conversion metrics look similar to lower-value segments.
Churn Risk Scoring: Identify customers showing early warning signs of disengagement before they actually leave. Predictive churn models analyze patterns like declining login frequency, reduced feature usage, or support ticket sentiment to flag at-risk accounts. This enables proactive retention campaigns when they're most effective.
Conversion Probability Modeling: Score leads and prospects based on their likelihood to convert, allowing sales teams to prioritize follow-up and marketing to adjust nurture intensity. High-probability prospects get immediate attention while lower-scoring leads receive automated nurturing until their score improves.
Budget Allocation Forecasting: Predict how different budget scenarios will impact outcomes before you commit spend. Models can forecast the expected return from shifting budget between channels, launching new campaigns, or scaling existing initiatives—taking the guesswork out of planning.
Common Mistakes to Avoid
Don't expect perfect predictions from day one. Predictive models improve over time as they learn from more data and outcomes. Start with directional accuracy that improves decision-making rather than demanding precise forecasts that may not be realistic.
Avoid over-complicating models with too many variables. More inputs don't automatically mean better predictions—they often reduce model interpretability and can lead to overfitting where the model memorizes historical data rather than learning generalizable patterns. Focus on the variables that actually drive outcomes.
Never rely solely on predictive models without human oversight. Models can perpetuate biases in historical data or miss context that humans understand intuitively. Use predictions to inform decisions, not make them automatically without review.
Advanced Implementation Strategies
Combine multiple predictive models to create ensemble forecasts that are typically more accurate than any single model. For example, blend a machine learning model with a statistical time-series forecast to predict campaign performance—the ensemble approach reduces the impact of any individual model's weaknesses.
Use explainable AI techniques to understand why models make specific predictions. This transparency builds trust in the system and helps you identify when models might be relying on spurious correlations. When understanding marketing data patterns, explainability ensures you're learning genuine insights rather than following algorithmic artifacts.
6. Collect Sufficient Historical Data
Best for: Building a comprehensive data foundation that enables accurate trend analysis and forecasting
Google Analytics is a web analytics platform that collects and stores historical data about website traffic, user behavior, and conversion patterns.
Monthly reports are autopsies—they tell you what happened but arrive too late to change outcomes. By the time you discover a campaign is underperforming or a channel is driving unexpected results, you've already burned through budget and missed opportunities to capitalize on what's working.
Real-time dashboards transform marketing from reactive to proactive. Instead of waiting weeks to understand performance, you can spot trends as they emerge, catch problems within hours instead of days, and scale winning campaigns while they're still hot. This responsiveness becomes your competitive advantage in fast-moving markets where timing determines success.
The difference between a static report and a real-time dashboard isn't just speed—it's the ability to make decisions while they still matter. When you notice your cost-per-acquisition spiking on Tuesday afternoon, you can pause and investigate immediately rather than discovering it in Friday's weekly report after thousands more dollars are spent.
Building Dashboards That Drive Action
The foundation of effective real-time monitoring starts with identifying which metrics actually require immediate attention. Not every data point needs real-time tracking—focus on metrics where quick action creates meaningful impact.
Performance Thresholds: Set up automated alerts for metrics that fall outside acceptable ranges. If your conversion rate drops 20% below normal, cost-per-click increases 30%, or daily revenue falls below target, you need to know immediately—not in next week's report.
Budget Pacing Indicators: Monitor daily spend against targets to catch budget overruns before they become expensive problems. Real-time budget tracking prevents the common scenario where you discover you've spent 80% of monthly budget in the first two weeks.
Channel Performance Shifts: Track sudden changes in channel effectiveness that might indicate technical issues, competitive changes, or emerging opportunities. A 50% drop in organic traffic could mean a technical problem that needs immediate fixing, not a trend to analyze later.
Conversion Funnel Breakdowns: Monitor each funnel stage in real-time to identify where prospects are dropping off. If your checkout completion rate suddenly drops, you need to investigate whether there's a technical issue, payment processor problem, or user experience breakdown.
Creating Role-Specific Dashboard Views
Different team members need different information to make their specific decisions. A performance marketer managing paid campaigns needs granular channel data, while a CMO needs high-level business impact metrics. Generic dashboards that try to serve everyone end up serving no one effectively.
Build focused dashboards for each role that surface only the metrics they can act on. Your paid media manager needs real-time cost, conversion, and ROI data by campaign. Your content marketer needs engagement metrics, traffic sources, and content performance. Your executive team needs revenue attribution, overall ROI, and strategic trend indicators.
This specialization prevents information overload while ensuring each person has the specific data they need to make confident decisions in their domain. When dashboards are cluttered with irrelevant metrics, important signals get buried in noise.
Implementing Smart Alert Systems
Real-time dashboards become truly powerful when paired with intelligent alerting that notifies you of issues requiring immediate attention. The goal isn't to create alert fatigue with constant notifications—it's to surface genuinely important changes that demand action.
Configure alerts based on statistical significance rather than arbitrary thresholds. A 5% conversion rate change might be normal daily variance or might indicate a serious problem—statistical analysis helps distinguish signal from noise. Many analytics platforms now offer anomaly detection that learns normal patterns and alerts only when deviations are statistically meaningful.
Layer your alerts by urgency. Critical issues like tracking failures or massive budget overruns need immediate notification. Important but less urgent changes like gradual performance declines can be bundled into daily summary alerts. This tiered approach ensures you respond appropriately without becoming desensitized to constant notifications. For teams looking to level up their analytical capabilities, a comprehensive marketing analytics course can provide the foundational knowledge needed to build and interpret these sophisticated monitoring systems.
Your Data-Driven Marketing Action Plan
The gap between marketers who prove ROI and those who struggle isn't access to data—it's implementing the right practices to turn that data into confident decisions. These ten best practices form a comprehensive framework that addresses every stage of your marketing analytics maturity.
Start with multi-touch attribution and revenue focus to understand what's actually driving results. Build on that foundation with clean data standards and behavioral segmentation. Then layer in advanced techniques like incrementality testing and predictive analytics to stay ahead of your competition.
The most successful approach? Pick the practice that addresses your biggest current pain point. If you're struggling with attribution gaps, start there. If budget allocation feels like guesswork, focus on cross-channel attribution first. Each practice builds on the others, but you don't need to implement everything at once.
Modern attribution platforms like Cometly make implementing these practices significantly faster by connecting all your marketing data in one place, tracking the complete customer journey, and providing AI-powered insights that identify what's working and what's not. This unified approach eliminates the data silos that make sophisticated analysis impossible.
The marketing landscape will continue evolving—privacy regulations will tighten, platforms will change, and customer behavior will shift. But these data practices provide a stable foundation for making confident decisions regardless of external changes. The question isn't whether you can afford to implement them—it's whether you can afford not to while your competitors are already moving ahead.
Ready to transform your marketing from guesswork into precision? Get your free demo and see how unified attribution and analytics can improve your decision-making starting today.