You check Facebook Ads Manager: 73 conversions. Google Analytics shows 50. Your CRM reports 42. Which number do you trust when deciding where to spend tomorrow's budget?
This isn't a hypothetical scenario—it's the daily reality for marketers running multi-channel campaigns without a unified tracking system. Every platform measures success differently, using different attribution windows, tracking methods, and conversion definitions. Facebook might credit a conversion to an ad someone saw three days ago. Google Analytics attributes it to the organic search that happened right before purchase. Your CRM only counts it when someone actually fills out the form.
The result? You're making budget decisions based on incomplete data. And that incomplete data is costing you real money.
When platforms report different numbers, you face a fundamental trust problem. The channel showing the "best" results might simply have the most generous attribution model, not the actual best performance. You could be doubling down on underperforming campaigns while starving your real winners of budget.
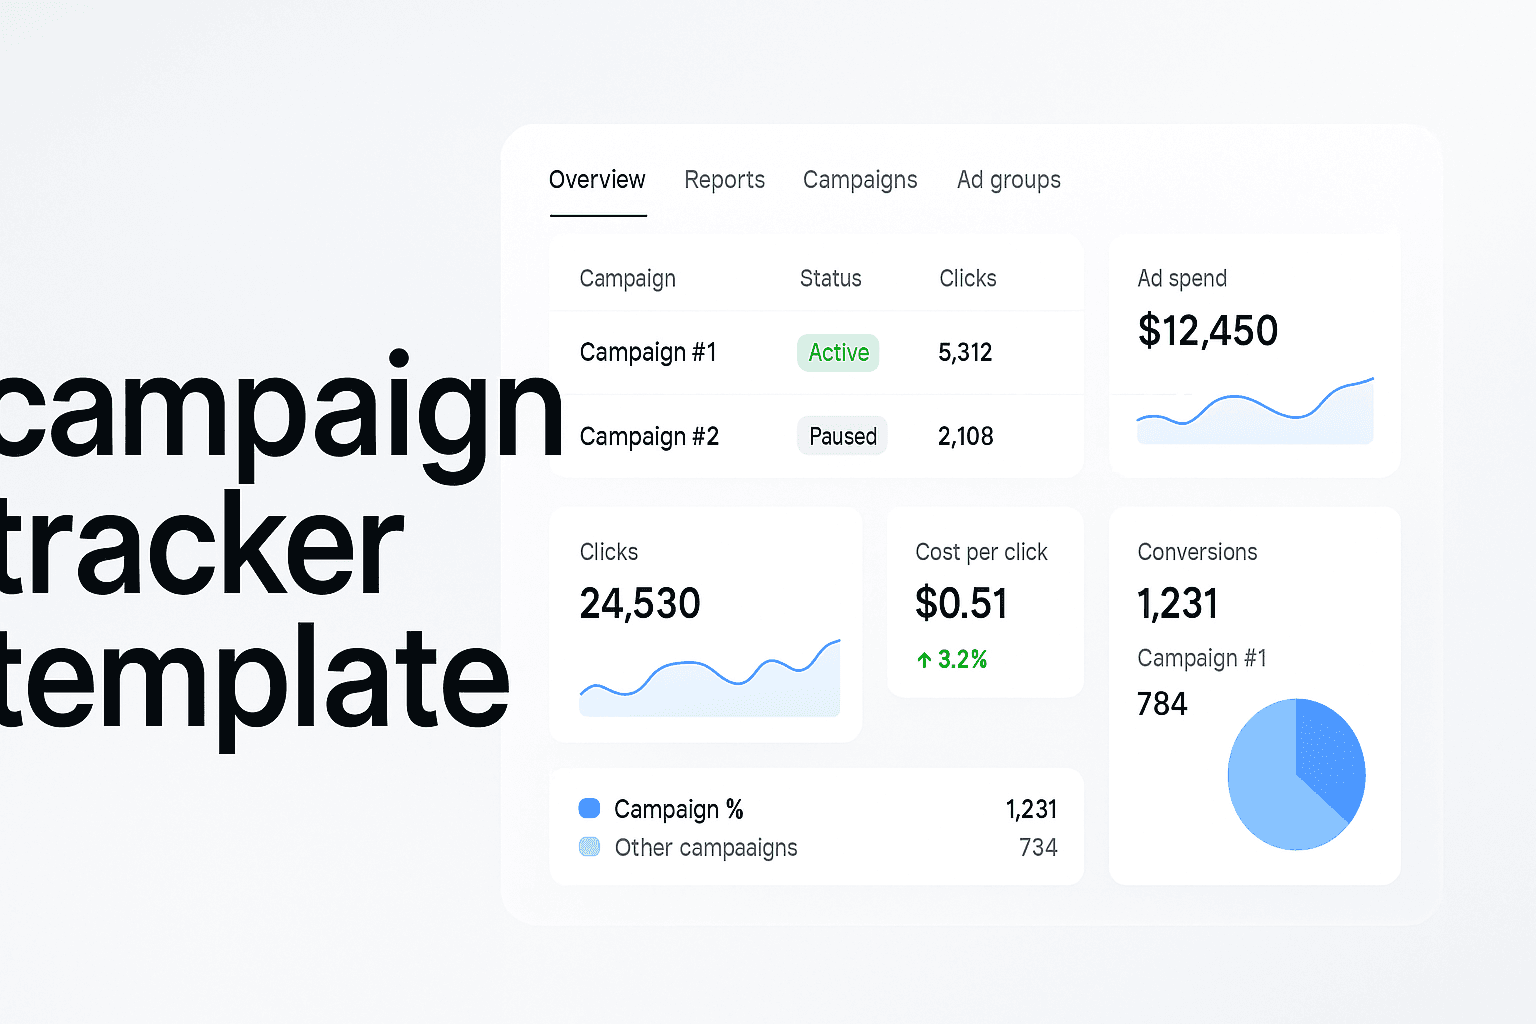
Here's what you'll build in this guide: a campaign tracker template that captures the truth across all your channels. Not just another spreadsheet—a systematic approach to tracking that gives you a single source of truth for campaign performance. You'll learn exactly which columns to include, which formulas to use, and how to structure your data so you can actually make confident decisions.
We'll also be realistic about limitations. Manual tracking works brilliantly until you scale. When you're running dozens of campaigns across multiple platforms, updating spreadsheets weekly becomes a bottleneck. We'll show you when that happens and what comes next.
But first, you need the foundation. In December 2025, rising ad costs and ongoing privacy changes make accurate attribution more critical than ever. iOS 14+ restrictions and cookie deprecation mean platforms see less than they used to. Your tracker needs to compensate for these blind spots.
Think of it like completing a puzzle when three different boxes claim to have all the pieces. You need one master reference that shows you the complete picture.
Let's walk through how to build a tracker that actually works—starting with what you need before you create a single spreadsheet cell.
Step 1: Design Your Tracking Taxonomy
Here's where most campaign trackers fall apart before they even start: inconsistent naming. One person writes "FBRetargeting," another uses "Facebook-Retarget," and someone else types "fbretargeting_campaign." Your tracker now shows three separate campaigns when it's actually one. Three months later, you're staring at fragmented data that's impossible to analyze.
Your tracking taxonomy—the naming and categorization system you use—is the foundation everything else builds on. Get this right, and your tracker becomes a powerful decision-making tool. Get it wrong, and you'll spend hours every week manually reconciling data instead of optimizing campaigns.
Let's build a taxonomy that actually works.
Create Your Campaign Naming Structure
Start with a standardized format that everyone on your team will use, no exceptions. Here's what works: [Channel][CampaignType][Audience]_[MonthYear]
Real example: FBConversionRetargeting_Dec2025
Why underscores instead of spaces or hyphens? Spaces break formulas in spreadsheets. Hyphens can be confused with negative signs in calculations. Underscores are clean, consistent, and formula-friendly.
Your naming convention should mirror your campaign ad group setup structure to ensure tracking aligns with how campaigns are actually organized in ad platforms. This structural alignment makes data import and reconciliation significantly easier.
Document your convention in a one-page reference sheet. Put it in your team's shared drive, pin it in Slack, make it impossible to miss. When someone asks "How should I name this campaign?" they should find the answer in 10 seconds.
For a plain-English breakdown, read our explainer on what is cost per share.
Here's the critical part: once you lock in your convention, don't change it mid-flight. Changing naming conventions after campaigns are running makes historical comparison impossible. You'll lose the ability to track year-over-year performance or identify long-term trends.
Common naming mistakes that break trackers: Including dates in evergreen campaign names creates new entries every month. Use "EvergreenProspecting" not "Jan2025Prospecting." Save date references for seasonal or time-bound campaigns only. Also avoid special characters like &, %, or # that can cause import errors.
Test your convention with real scenarios. Can someone categorize "LinkedInLeadGenDirectorsQ12026" without asking questions? If yes, your taxonomy works. If they need clarification, simplify it.
Build Your UTM Parameter Framework
UTM parameters are the tracking codes that tell you exactly where traffic came from. Without them, all your Facebook traffic looks identical in Google Analytics—you can't tell which campaign or ad performed best.
Here are the five UTM parameters you need to master:
utm_source: The platform name. Use lowercase consistently: facebook, google, linkedin, email. Never mix "Facebook" and "facebook"—they'll appear as separate sources in reports.
Step 2: Build Your Master Tracking Spreadsheet
You've got your taxonomy locked down. Now it's time to build the actual tracker—the spreadsheet that becomes your single source of truth.
Here's what separates a useful tracker from a data graveyard: thoughtful structure. Most marketers create spreadsheets that store data. You're going to build one that generates insights.
Essential Columns for Every Tracker
Your tracker needs specific columns to calculate meaningful metrics. Start with these core fields—every marketing campaign tracker should include them:
Date Range: Campaign start and end dates. Use separate columns for each so you can filter by active campaigns or analyze historical performance windows.
Campaign Name: Using your established taxonomy from Step 1. This becomes your primary identifier for grouping and filtering data.
Channel/Platform: Facebook, Google, LinkedIn, Email, etc. Keep this consistent—"Facebook" not "FB" or "Meta"—so your pivot tables work correctly.
Campaign Objective: Awareness, Consideration, Conversion. This lets you compare performance against appropriate benchmarks. A brand awareness campaign shouldn't be judged by the same cost-per-conversion as a retargeting campaign.
Budget Allocated: Your planned spend. This column stays static once set, giving you a baseline to measure against.
Actual Spend: Real cost from the platform. Update this weekly from your ad dashboards. The gap between allocated and actual spend reveals budget pacing issues early.
Impressions: How many times ads were shown. Essential for calculating reach and frequency metrics.
Clicks: Total link clicks. Pull this directly from ad platforms—don't confuse with sessions in Google Analytics.
CTR (Click-Through Rate): Calculate as Clicks divided by Impressions. Format as percentage. This reveals creative effectiveness before you spend money on conversions.
Conversions: Based on your defined conversion events from Step 1. This is where platform discrepancies show up—document which platform's number you're using and why.
Cost Per Conversion: Calculate as Actual Spend divided by Conversions. This becomes your primary optimization metric for most campaigns.
Revenue (if applicable): Total revenue attributed to the campaign. For e-commerce or SaaS with clear transaction values, this column transforms your tracker from cost analysis to profit analysis.
ROI or ROAS: Return on Investment (Revenue minus Spend, divided by Spend) or Return on Ad Spend (Revenue divided by Spend). Choose one and stick with it. For pay per click campaigns, ROAS is typically more useful because it directly shows revenue multiple.
Related reading: our complete guide to pay per click campaign management.
Set Up Your Spreadsheet Structure
Open Google Sheets—it's free, cloud-based, and handles collaboration better than Excel for team environments. Create a new sheet and name it "Campaign Tracker 2025."
Step 3: Connect Your Data Sources
Your spreadsheet structure is ready. Your formulas are waiting. But without data flowing in, you've just built an empty container.
This is where most campaign trackers stall. Marketers spend hours building the perfect template, then realize they don't know how to actually get platform data into it. They resort to manual copy-paste from dashboards—which defeats the entire purpose of systematic tracking.
Here's what you need to understand: connecting data sources isn't about technical wizardry. It's about knowing where each platform stores its data and the fastest way to extract it into your tracker.
Export Data From Ad Platforms
Every major ad platform lets you export campaign data. The trick is knowing which report to pull and how to format it for your tracker.
Facebook Ads Manager: Navigate to Ads Manager, select your date range, then click the download icon. Choose "Export Table Data" and select CSV format. Make sure you've customized your columns to match what your tracker needs—impressions, clicks, spend, conversions. Facebook lets you save column presets, so you only configure this once.
Google Ads: Go to the Campaigns tab, click the download icon, and select "Download as CSV." The key here is using the "Segment" dropdown to break data down by time period if you're tracking weekly or daily performance. Google's exports include more columns than you need—you'll delete extras when importing to your tracker.
LinkedIn Campaign Manager: Click "Export" from the campaign dashboard. LinkedIn's exports are cleaner than Facebook or Google, but watch for their unique metric names. What they call "conversions" might be "leads" in your tracker taxonomy.
The common mistake? Exporting data with different date ranges across platforms. If Facebook shows last week and Google shows last month, your tracker will show nonsense. Set the same date range in every platform before exporting.
Pull Analytics Data
Google Analytics 4 is your source of truth for website behavior, but extracting the right data requires knowing which reports to use.
Navigate to Reports > Acquisition > Traffic Acquisition. This shows you traffic sources and their conversion performance. Customize the report to show your specific conversion events—the ones you defined in your taxonomy. Export as CSV.
Here's what trips people up: Google Analytics uses "source/medium" format (like "facebook/cpc"), while your tracker might use separate columns for source and medium. You'll need to split this data when importing. Most spreadsheet tools have a "split text to columns" function that handles this in seconds.
For e-commerce businesses, pull the E-commerce Purchases report. For lead generation, use the Events report filtered to your form submission events. The goal is matching GA4's conversion data to your tracker's conversion definitions.
Import CRM Conversion Data
This is where tracking gets real. Ad platforms and analytics show clicks and website conversions. Your CRM shows which leads actually became customers.
Most CRMs let you export contact lists with custom fields. In HubSpot, go to Contacts > Export. In Salesforce, use Reports to create a custom report showing leads with their original source. The critical field you need: the source attribution data that connects back to your campaign names.
Step 4: Set Up Cross-Channel Attribution Rules
Here's where campaign tracking gets complicated: a customer sees your Facebook ad on Monday, clicks a Google search ad on Wednesday, and converts through an email link on Friday. Which channel gets credit for the sale?
This isn't a theoretical problem. Without clear attribution rules, you'll either over-credit channels (every platform claims the same conversion) or under-value the customer journey (only the last click gets credit). Your tracker needs systematic rules for assigning conversion credit across multiple touchpoints.
Attribution rules determine how you distribute credit when customers interact with multiple campaigns before converting. The rule you choose fundamentally changes which channels appear "successful" in your tracker—and therefore where you allocate budget.
Choose Your Attribution Model
Start by selecting one primary attribution model for your tracker. You can analyze data through multiple lenses later, but you need one consistent model for decision-making.
Last-Click Attribution: The final touchpoint before conversion gets 100% credit. This is the simplest model and matches how most ad platforms report by default. If someone clicks your Google ad and immediately converts, Google gets full credit. The downside? It ignores all the awareness and consideration touchpoints that made that final click possible.
First-Click Attribution: The initial touchpoint gets 100% credit. This model values channels that introduce new customers to your brand. If someone first discovers you through a Facebook ad, then returns via organic search to convert, Facebook gets full credit. The limitation? It doesn't account for the nurturing that happened between discovery and purchase.
Linear Attribution: Credit is distributed equally across all touchpoints. If a customer interacted with five campaigns before converting, each gets 20% credit. This model acknowledges the full journey but treats a quick impression and a demo request as equally valuable—which often isn't true.
Time-Decay Attribution: Recent touchpoints get more credit than earlier ones. A conversion influenced by four campaigns might give 10% to the first, 20% to the second, 30% to the third, and 40% to the final touchpoint. This model reflects that later interactions often have more direct impact on conversion decisions.
For most marketers building their first comprehensive tracker, start with last-click attribution. It's the easiest to implement in spreadsheets and matches platform reporting, making reconciliation simpler. As your tracking sophistication grows, you'll encounter scenarios where spreadsheet formulas can't capture complex customer journeys—this is where a dedicated marketing campaign attribution platform becomes essential.
Build Your Attribution Logic
Now translate your chosen model into spreadsheet rules. Create a new sheet in your tracker called "Attribution Rules" where you'll document your methodology.
Add these columns: Conversion ID, Customer ID, Touchpoint 1 (with date), Touchpoint 2 (with date), Touchpoint 3 (with date), Attributed Channel, Attribution Percentage, and Notes. This structure lets you track the sequence of interactions for each conversion.
For last-click attribution, your rule is straightforward: the campaign associated with the most recent touchpoint before conversion gets 100% credit. In your main tracker sheet, this means matching conversion timestamps to campaign interaction dates and assigning full credit to the final campaign.
Putting It All Together
You now have the blueprint for a campaign tracker that captures performance across every channel. Start with your taxonomy—lock down naming conventions and UTM parameters before launching your next campaign. Build your spreadsheet with the essential columns we covered, then layer in the formulas that calculate CTR, CPC, and conversion rates automatically. Set up your attribution rules based on your business model, and commit to weekly updates.
Your tracker will work brilliantly for the first few months. You'll finally have that single source of truth you've been missing. But here's what happens next: you scale. You launch more campaigns. You add new channels. You hire team members who need access. Suddenly, those weekly spreadsheet updates take three hours instead of thirty minutes. Manual data entry creates errors. Your attribution rules can't handle complex customer journeys with eight touchpoints across four devices.
That's not failure—it's growth. When manual tracking becomes your bottleneck, you've reached the point where attribution software makes sense for automating the entire process you've just built by hand.