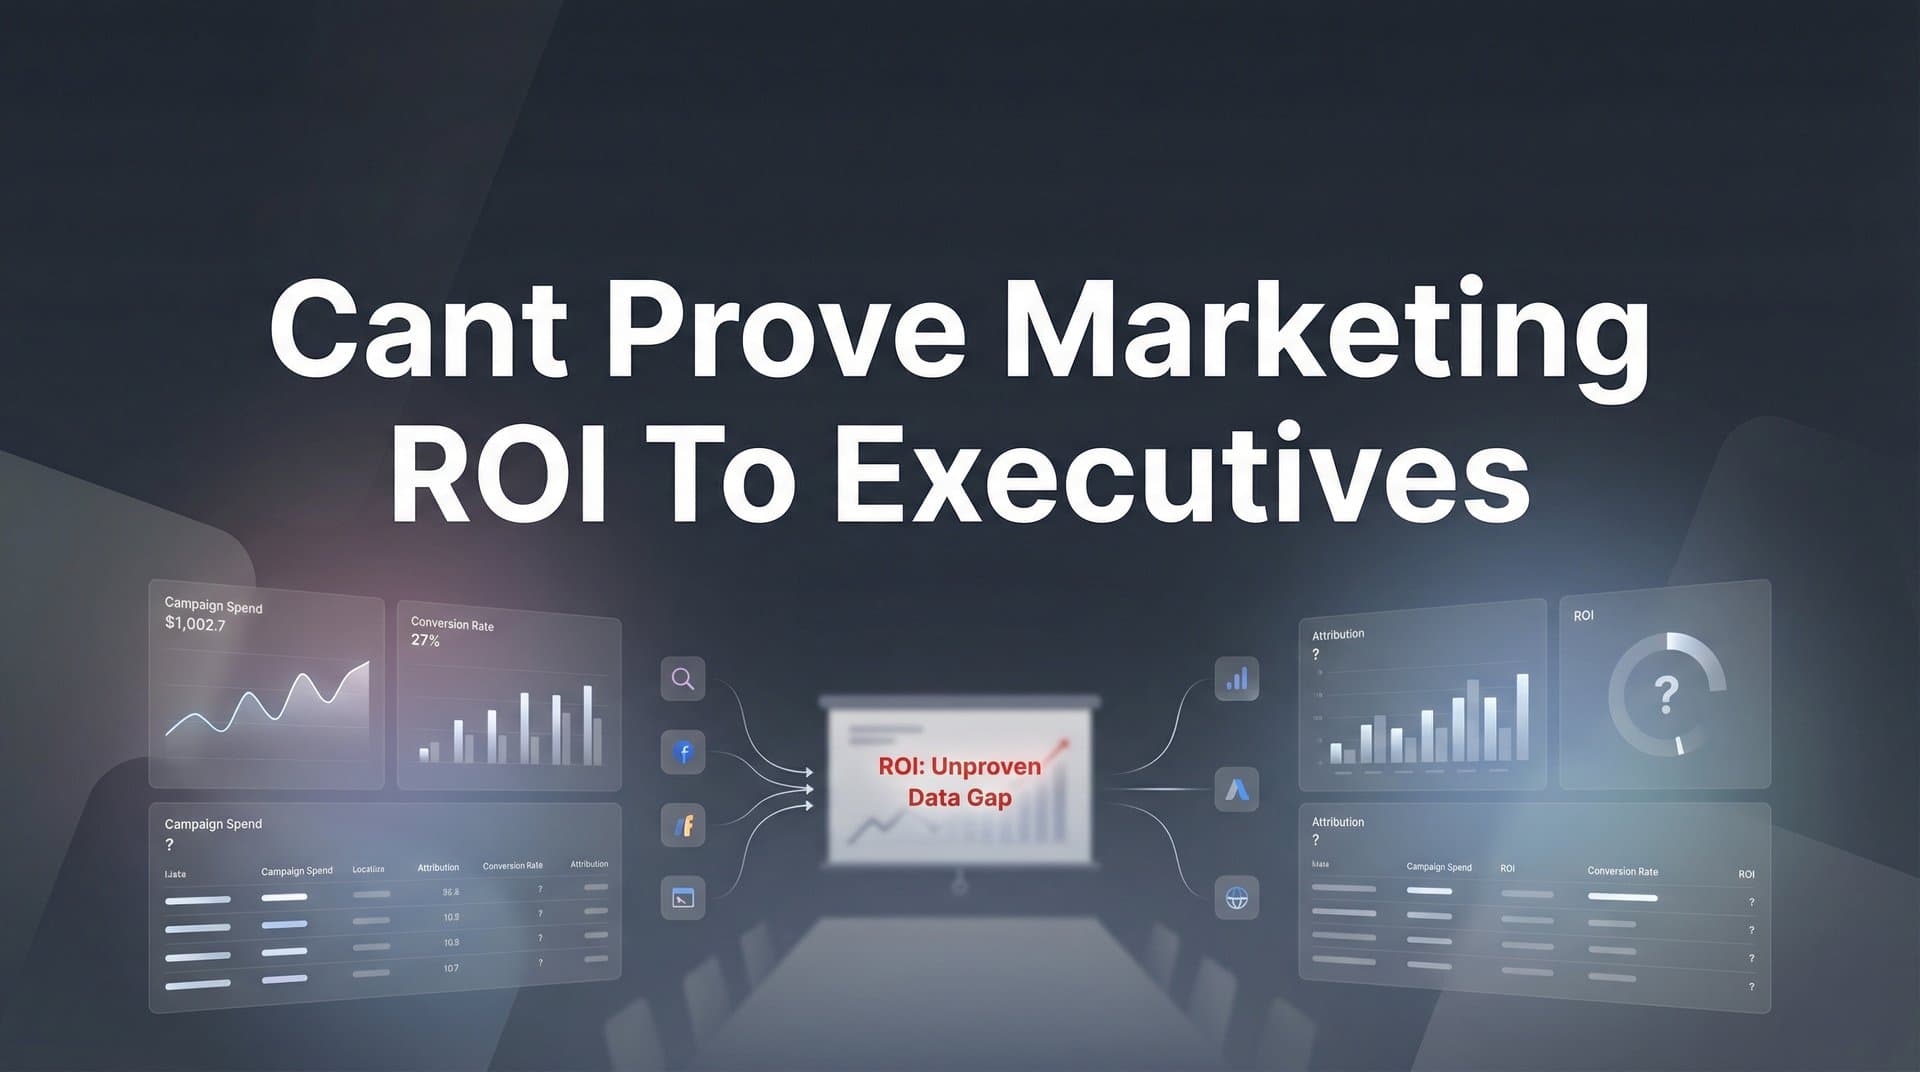
The boardroom goes quiet when you present marketing results. You know your campaigns are working—you've seen the leads come in, watched engagement metrics climb, and felt the momentum building. But when the CFO asks, "What's the actual return on our marketing investment?" you struggle to connect the dots between ad spend and revenue.
You're not alone. Many marketers face this challenge because traditional tracking methods create gaps between marketing activities and business outcomes.
The good news? Proving marketing ROI isn't about working harder—it's about working smarter with the right frameworks, data connections, and communication strategies. This guide walks you through seven actionable strategies that will transform how you measure, analyze, and present marketing performance to executives who care about one thing: business impact.
1. Connect Marketing Data to Revenue, Not Just Leads
The Challenge It Solves
Executives don't get excited about lead counts. They care about closed deals and revenue growth. When your reporting stops at "leads generated," you're leaving the most important part of the story untold. This disconnect happens because marketing platforms track campaign performance while CRM systems track sales outcomes—and these systems rarely talk to each other automatically.
The Strategy Explained
Revenue-based reporting requires integrating your marketing platforms directly with your CRM system so every ad click, email open, and website visit connects to actual customer purchases. This creates a complete view of the customer journey from first touchpoint to closed deal. When you can show that a specific campaign generated $150,000 in revenue from $30,000 in ad spend, you're speaking the language executives understand.
The key is ensuring your tracking system captures the entire funnel. That means tagging leads with their original source, tracking them through nurturing stages, and ultimately connecting them to revenue events in your CRM.
Implementation Steps
1. Audit your current data flow to identify where the connection breaks between marketing activities and closed deals—most gaps occur between lead capture and CRM entry.
2. Implement tracking that passes campaign source data through every system in your stack, from ad platforms through your website, lead forms, and into your CRM with consistent UTM parameters and tracking IDs.
3. Create custom fields in your CRM that capture marketing source data for every lead, then build reports that connect this source data to revenue outcomes and deal values.
Pro Tips
Start by tracking just your top three campaigns end-to-end before expanding to your entire marketing mix. This focused approach helps you iron out technical issues and prove the concept quickly. Also, work with your sales team to ensure they're not overwriting source data when they manually enter information into the CRM.
2. Adopt Multi-Touch Attribution Instead of Last-Click Guessing
The Challenge It Solves
Last-click attribution gives all the credit to the final touchpoint before conversion, completely ignoring the awareness campaigns, nurturing emails, and content pieces that built trust along the way. This creates a distorted view of channel performance and leads to budget decisions that starve effective top-of-funnel activities. Executives making decisions based on last-click data are essentially flying blind.
The Strategy Explained
Multi-touch attribution distributes credit across all the touchpoints in a customer's journey, revealing the true value of each marketing channel. Think of it like a basketball team—the player who scores the basket gets the points, but the assists, screens, and defensive plays that made that basket possible deserve recognition too.
Different attribution models distribute credit differently. Linear attribution gives equal credit to all touchpoints. Time-decay attribution gives more credit to touchpoints closer to conversion. U-shaped attribution emphasizes both the first touch (awareness) and last touch (conversion) while giving some credit to middle touchpoints.
Implementation Steps
1. Map out your typical customer journey to understand how many touchpoints prospects encounter before converting—most B2B buyers interact with 7-13 touchpoints before purchase.
2. Choose an attribution model that matches your business reality: if you have a long sales cycle with significant nurturing, time-decay or U-shaped models typically provide more accurate insights than linear attribution.
3. Implement attribution tracking that captures every marketing touchpoint with timestamps and channel data, then compare results across multiple attribution models to identify patterns and validate findings.
Pro Tips
Don't get paralyzed choosing the "perfect" attribution model. Start with one model, run it for 60-90 days, then compare it against last-click data to show executives how attribution changes the narrative. The contrast alone will be eye-opening. Many marketers find that running multiple models in parallel helps build confidence in the insights.
3. Speak the Language of Finance, Not Marketing
The Challenge It Solves
When you present click-through rates, engagement metrics, and impression counts to executives, their eyes glaze over. These metrics don't translate to business outcomes in their mental framework. Finance teams think in terms of investment returns, payback periods, and profit margins—metrics that directly connect to business health and growth potential.
The Strategy Explained
Financial translation means converting marketing metrics into the same framework executives use for evaluating all business investments. Instead of saying "we generated 500 leads this quarter," you say "we acquired customers at a $250 CAC with a 6-month payback period and projected 3.5x LTV to CAC ratio."
The three metrics that matter most to executives are Customer Acquisition Cost (total marketing and sales spend divided by new customers), Lifetime Value (total revenue a customer generates over their relationship with you), and Payback Period (how long it takes to recover the acquisition cost). When your marketing reports use these metrics consistently, executives can evaluate marketing performance using the same framework they apply to product development, operations, and other investments.
Implementation Steps
1. Calculate your current CAC by dividing your total marketing and sales expenses by the number of new customers acquired in the same period—be thorough in including all relevant costs from salaries to software subscriptions.
2. Work with your finance team to establish an accurate LTV calculation based on average customer revenue, retention rates, and margin data—this collaboration also builds alignment for future reporting.
3. Restructure your marketing reports to lead with financial metrics and relegate engagement metrics to supporting details that explain how you achieved the financial outcomes.
Pro Tips
Schedule a 30-minute meeting with your CFO or finance leader specifically to ask how they prefer to see investment data presented. This conversation alone will transform your reporting approach. Also, create a simple one-page glossary that defines CAC, LTV, and payback period with your company's specific calculation methods—this prevents confusion and builds consistency.
4. Implement Server-Side Tracking to Capture Lost Data
The Challenge It Solves
Browser-based tracking has become increasingly unreliable due to iOS privacy changes, ad blockers, and cookie restrictions. Many marketing teams are losing visibility into 20-40% of their conversions simply because browser tracking can't capture them. When you're missing this much data, your ROI calculations are fundamentally flawed—and executives know it.
The Strategy Explained
Server-side tracking moves conversion tracking from the user's browser to your server, bypassing the limitations that plague browser-based tracking. Instead of relying on cookies and pixels that users can block, server-side tracking captures conversion events directly from your backend systems and sends them to your analytics and ad platforms.
This approach provides complete conversion visibility regardless of browser settings, ad blockers, or privacy restrictions. When someone makes a purchase, your server records the transaction and sends that data to your marketing platforms—no browser involvement required. This creates a more accurate foundation for ROI reporting.
Implementation Steps
1. Audit your current conversion tracking to identify gaps by comparing server-side transaction records with browser-tracked conversions—the difference reveals your data loss rate.
2. Set up server-side tracking infrastructure that captures conversion events from your backend systems and sends them to your analytics platforms through server-to-server connections rather than browser pixels.
3. Implement conversion APIs for your major ad platforms (Meta, Google, TikTok) to send enriched conversion data that includes customer value, product categories, and other business context that improves campaign optimization.
Pro Tips
Start with your highest-value conversion events first—typically purchases or qualified leads. Once you've proven the concept and seen the data quality improvement, expand to other conversion types. Also, continue running browser-based tracking in parallel initially so you can demonstrate the difference to stakeholders with concrete before-and-after comparisons.
5. Create Incrementality Tests That Prove Causation
The Challenge It Solves
Correlation isn't causation. Just because conversions increased after you launched a campaign doesn't prove the campaign caused those conversions. Executives who've been burned by spurious correlations want proof that your marketing activities directly caused business results—not just evidence that they happened around the same time.
The Strategy Explained
Incrementality testing uses controlled experiments to isolate the true impact of your marketing activities. The most common approach is holdout testing, where you deliberately stop marketing to a segment of your audience while continuing to market to a control group. The difference in conversion rates between these groups reveals the incremental impact of your marketing.
Geo-testing works similarly but uses geography instead of audience segments. You might run campaigns in some markets while holding out others, then measure the difference in business outcomes. These tests answer the critical question: "What would have happened without this marketing investment?"
Implementation Steps
1. Design your first incrementality test by selecting a marketing channel or campaign to test, then create matched control and test groups that are similar in all relevant characteristics except exposure to the marketing.
2. Run the test for a full purchase cycle (typically 30-90 days depending on your business) while carefully tracking conversion rates, revenue, and other key metrics for both groups.
3. Calculate the incremental lift by comparing test group performance against control group performance, then translate this lift into incremental revenue and ROI that you can directly attribute to the marketing activity.
Pro Tips
Start with a channel you suspect is underperforming in attribution reports but that you believe has value. Incrementality tests often reveal that brand campaigns and upper-funnel activities deliver more value than last-click attribution suggests. Also, document your test design and share it with executives before running the test—this transparency builds credibility in the results.
6. Build Real-Time Dashboards with Executive-Level Views
The Challenge It Solves
Monthly PowerPoint reports are outdated the moment you send them. Executives can't make timely decisions based on 30-day-old data, and they certainly can't answer board questions with stale information. Static reports also create a perception that marketing lacks visibility into real-time performance—a perception that undermines confidence in your reporting.
The Strategy Explained
Real-time dashboards provide always-current visibility into marketing performance, allowing executives to check performance whenever questions arise. The key is creating executive-level views that surface the metrics that matter to leadership—revenue, CAC, pipeline value, and ROI—while hiding the operational details that only marketing teams need.
Effective dashboards answer the three questions executives ask most frequently: "Are we on track to hit our goals?", "Which channels are performing best?", and "What's our current ROI?" When executives can answer these questions themselves by pulling up a dashboard, you've fundamentally changed the conversation from defending past performance to planning future growth.
Implementation Steps
1. Interview your key stakeholders to understand what questions they need answered and how frequently they need updates—this ensures your dashboard actually gets used instead of ignored.
2. Build a clean, executive-focused dashboard that leads with the most important metrics (revenue, pipeline, ROI) and uses visual indicators like red/yellow/green status to make performance instantly scannable.
3. Set up automated data connections so your dashboard updates automatically without manual data entry, then schedule a brief walkthrough session to show executives how to access and interpret the information.
Pro Tips
Less is more with executive dashboards. Limit your main view to 5-7 key metrics maximum, then create drill-down views for additional detail. Also, include trend lines and goal progress indicators—executives want to know not just current performance but trajectory and whether you're on track. Consider adding a simple executive summary section that highlights the three most important insights from the current data.
7. Align Marketing Goals with Business Objectives from Day One
The Challenge It Solves
When marketing sets goals in isolation, you end up celebrating lead generation wins while the business misses revenue targets. This misalignment creates tension between marketing and executive leadership because you're measuring success differently. Executives lose confidence in marketing when your reported successes don't translate to business outcomes they care about.
The Strategy Explained
Goal alignment means working backwards from business objectives to define marketing targets. If the company needs to grow revenue by 30%, you collaborate with finance and sales to determine how many customers that requires, what conversion rates you'll need, and how much pipeline marketing must generate. This creates shared ownership of outcomes and ensures marketing goals directly support business growth.
The process involves establishing clear definitions of success that everyone agrees on upfront. What counts as a qualified lead? What's the expected conversion rate from lead to customer? What's the target CAC? When these definitions are set collaboratively before campaigns launch, there's no confusion or finger-pointing when results come in.
Implementation Steps
1. Schedule a goal-setting session with finance, sales, and executive leadership before planning your next quarter or fiscal year—come prepared with historical performance data to ground the conversation in reality.
2. Work backwards from revenue targets to calculate required customer acquisition numbers, then determine the pipeline and lead volume marketing must generate based on agreed-upon conversion rates.
3. Document shared KPIs and definitions in a simple one-page agreement that everyone signs off on, then reference this document in every performance report to reinforce the alignment.
Pro Tips
Build in buffer room when committing to targets. If you need 1,000 leads to hit the revenue goal based on historical conversion rates, commit to 1,200 to account for variability. This gives you credibility when you overdeliver. Also, schedule quarterly alignment check-ins to adjust targets based on actual performance—markets change, and rigid annual goals often become irrelevant by Q3.
Putting It All Together
Proving marketing ROI to executives isn't about defending your work—it's about building a measurement system that speaks their language from the start.
Begin by connecting your marketing data directly to revenue outcomes. This foundation makes everything else possible. Then layer in multi-touch attribution to show the true value of each channel beyond last-click oversimplification.
Implement server-side tracking to ensure you're capturing complete data despite privacy restrictions and browser limitations. Validate your findings with incrementality tests that prove causation, not just correlation. Present everything through real-time dashboards using financial terminology that executives already understand and trust.
Most importantly, maintain ongoing alignment with business objectives. When marketing goals connect directly to company growth targets, your success becomes the company's success.
Start with strategy one this week: audit your current data connections and identify where revenue tracking breaks down. Once you close those gaps, every other strategy becomes exponentially more effective.
The marketers who master ROI communication don't just keep their budgets—they earn the trust to scale them. Ready to elevate your marketing game with precision and confidence? Discover how Cometly's AI-driven recommendations can transform your ad strategy—Get your free demo today and start capturing every touchpoint to maximize your conversions.