
You're staring at seven browser tabs. Meta Ads Manager shows one conversion number. Google Ads reports something completely different for the same time period. TikTok's dashboard claims impressive engagement, but you can't tell if those views turned into actual customers. LinkedIn says your B2B campaign is performing well, but their definition of "conversion" doesn't match what your sales team tracks in the CRM.
Your CMO walks in with a straightforward question: "Which channel is actually driving revenue this quarter?"
What should be a 30-second answer turns into a three-hour data archaeology project. You're exporting CSV files, cross-referencing timestamps, trying to remember which attribution window each platform uses by default, and hoping your spreadsheet formulas are correct. By the time you compile everything, the data is already outdated, and you're not even confident in the accuracy.
This is the reality for marketers running campaigns across multiple platforms. The tools are powerful, but they're also siloed, speaking different languages, and optimizing for their own definitions of success rather than your actual business outcomes.
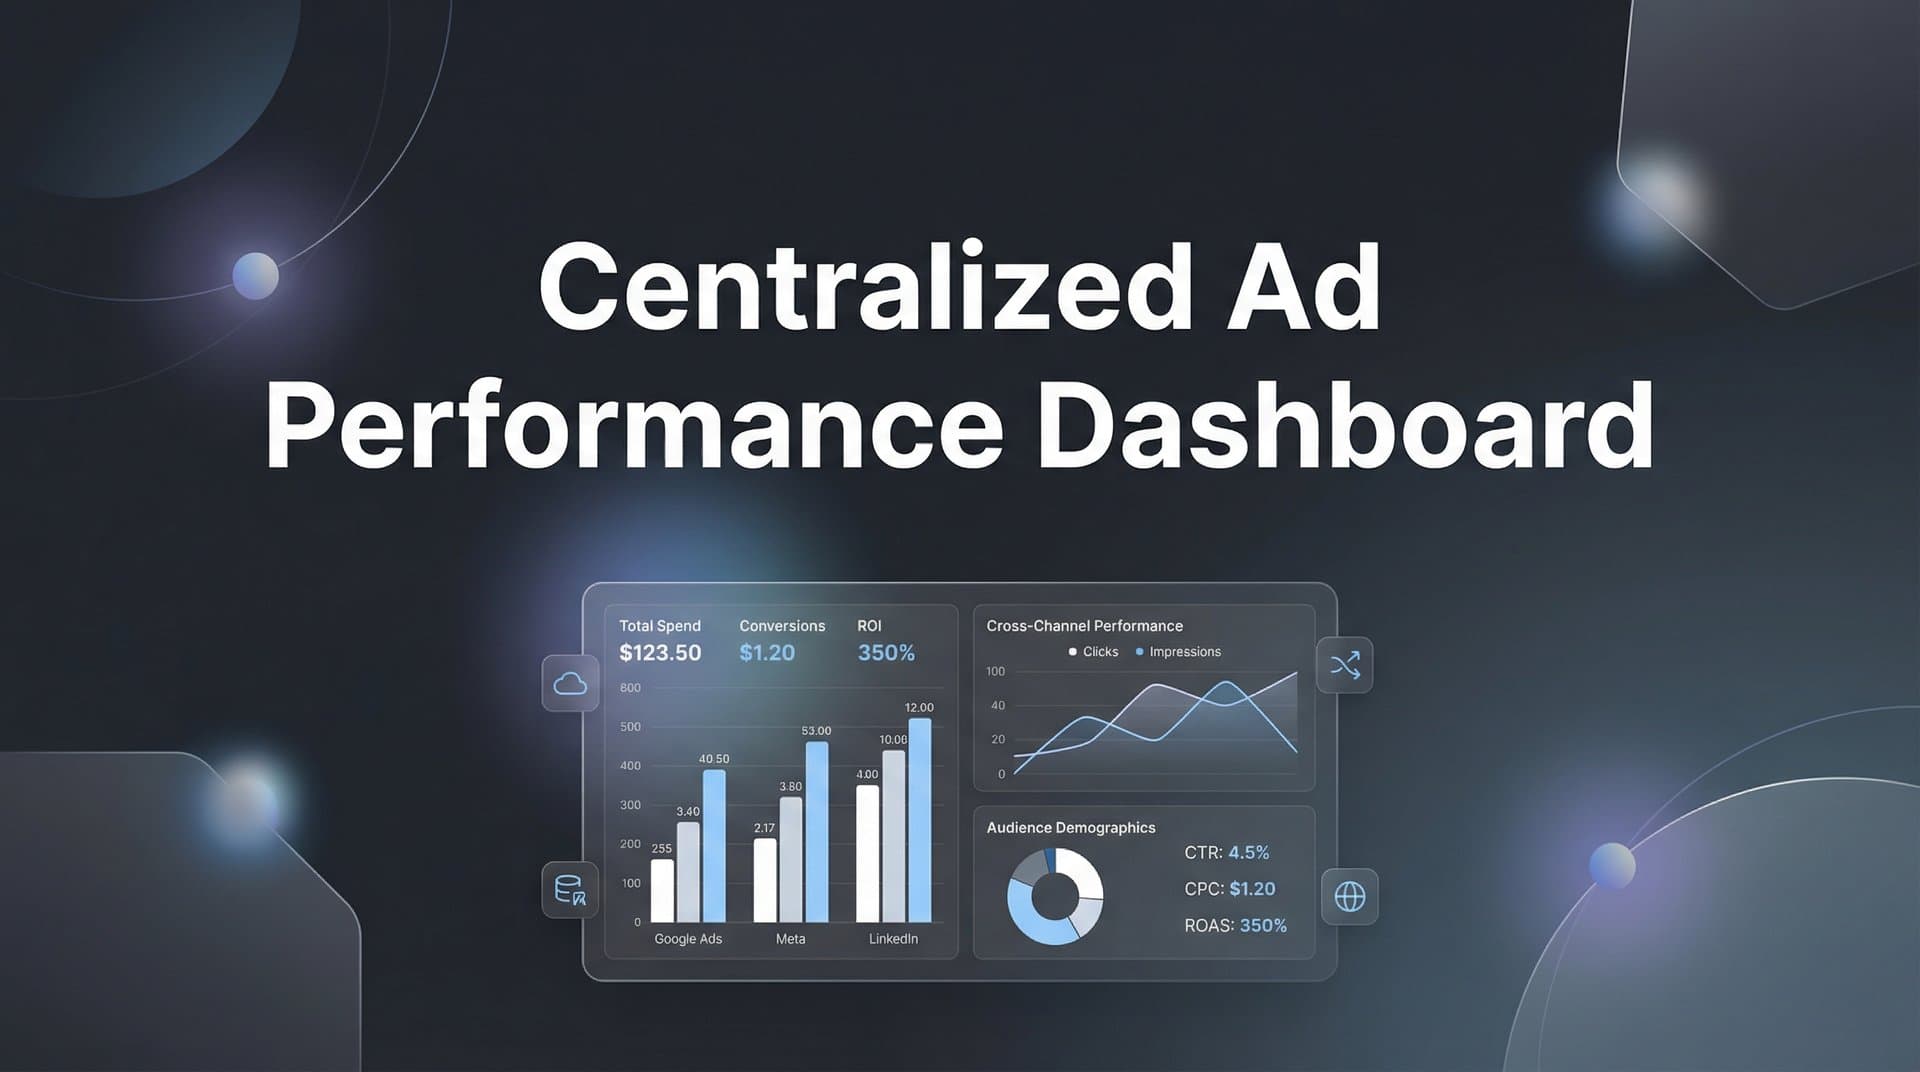
A centralized ad performance dashboard solves this exact problem. It's a unified view that pulls data from all your advertising platforms into one place, normalizes the metrics so you're comparing apples to apples, and connects ad performance to real revenue outcomes. Instead of juggling tabs and guessing which channel deserves more budget, you get a single source of truth that shows exactly what's working and why.
The Multi-Platform Problem Every Marketer Knows Too Well
Data fragmentation isn't just inconvenient. It creates blind spots that cost you money.
When your marketing data lives in separate platforms, each with its own reporting interface and methodology, you lose the ability to see the complete picture. Meta might tell you a campaign generated 50 conversions. Google Analytics shows 35 conversions from Meta during the same period. Your CRM records 28 new customers who clicked a Meta ad. Which number is correct? All of them, technically, because each system measures something slightly different.
The problem deepens when you realize that each platform uses different attribution windows. Meta defaults to a 7-day click and 1-day view attribution window. Google Ads offers multiple models with different lookback periods. TikTok has its own approach. LinkedIn uses yet another methodology. When you're trying to compare performance across these channels, you're not just comparing different campaigns, you're comparing fundamentally different measurement systems.
This isn't a minor technical detail. It directly impacts where you allocate budget. If one platform is inflating conversions because of a longer attribution window while another uses a stricter model, you might be overinvesting in the channel that simply takes credit for more touches, not the one that actually drives better results. Understanding how to track ad performance across channels becomes essential for accurate budget allocation.
Then there's the time sink. Marketers often spend hours each week manually pulling reports from different platforms, copying data into spreadsheets, and trying to create a coherent view of performance. This isn't just inefficient, it introduces human error at every step. A misplaced decimal point, a wrong date range, or a formula error can lead to decisions that waste thousands in ad spend.
The iOS 14.5 update in 2021 made this problem even more acute. With browser-based tracking becoming less reliable, the data you see in each platform's native dashboard is increasingly incomplete. Conversions are undercounted, attribution is less accurate, and the gap between what platforms report and what actually happened grows wider.
When your data is fragmented, you're not just working harder. You're making decisions with incomplete information, which means you're leaving money on the table.
How Centralized Dashboards Transform Raw Data Into Revenue Insights
A centralized ad performance dashboard doesn't just display numbers from different platforms side by side. It fundamentally transforms how you understand and act on marketing data.
The first transformation happens through data normalization. When you pull conversion data from Meta, Google, TikTok, and LinkedIn into a centralized system, that system standardizes the metrics so they're actually comparable. Instead of each platform's unique definition of a "conversion" or "cost per acquisition," you define what matters for your business, and the dashboard measures every channel against that same standard.
Think of it like converting currencies. If you're comparing prices from different countries, you need to convert everything to the same currency to make meaningful comparisons. A centralized dashboard does this for your marketing metrics, ensuring that when you compare cost per lead across channels, you're measuring the same thing every time. Implementing marketing performance dashboard best practices ensures your data normalization is done correctly.
Real-time data aggregation is the second major transformation. Instead of waiting for each platform to update its reports at different times and then manually compiling everything, a centralized dashboard continuously pulls fresh data from all sources. When you make a budget change or launch a new creative, you can see the impact across all channels immediately, not hours or days later when you finally get around to checking each platform individually.
This real-time visibility changes how you manage campaigns. You can spot problems quickly, capitalize on opportunities as they emerge, and make adjustments based on current performance rather than yesterday's data. The lag between action and insight disappears.
Custom attribution modeling is where centralized dashboards truly shine. Platform-reported attribution is inherently biased. Each platform wants to take credit for conversions, which leads to the common problem where your total attributed conversions across all platforms exceed your actual number of customers. They're all claiming credit for the same conversion, just from different angles.
A centralized dashboard with proper attribution modeling tracks the actual customer journey. It knows that a customer might have clicked a Facebook ad, then searched your brand on Google, then clicked a LinkedIn ad, before finally converting. Instead of each platform claiming full credit, you can see which touchpoints genuinely contributed and apply attribution models that reflect reality.
This might mean using a linear model that distributes credit across all touches, a time-decay model that gives more weight to interactions closer to conversion, or a position-based model that emphasizes first and last touches. The key is that you're measuring against actual customer behavior, not platform-reported claims.
The most powerful transformation is connecting ad data to actual revenue outcomes. Many marketers optimize for platform-defined conversions like link clicks or form submissions, but these don't always correlate with revenue. A centralized dashboard that integrates with your CRM can show you which campaigns drive customers who actually pay, have high lifetime value, and stick around. This shifts your optimization from vanity metrics to business outcomes.
Essential Features That Separate Useful Dashboards From Vanity Metrics
Not all dashboards are created equal. Many marketing reporting tools simply aggregate data without adding intelligence. The features that matter are the ones that turn data into decisions.
Cross-Platform Conversion Tracking: The foundation of any valuable dashboard is accurate conversion tracking that follows the customer journey beyond what individual ad platforms can see. This means tracking from ad click through to CRM events like closed deals, subscription renewals, or repeat purchases. Without this connection, you're still optimizing in the dark, just with prettier charts. A robust ad performance tracking system makes this level of visibility possible.
Server-side tracking has become essential for accurate conversion data. Browser-based tracking faces increasing limitations from privacy updates, ad blockers, and cookie restrictions. A dashboard that relies solely on pixel-based tracking will show incomplete data. Server-side tracking sends conversion events directly from your server to the dashboard, bypassing browser limitations and providing more complete, accurate data about what's actually driving results.
Multi-Touch Attribution Capabilities: This feature shows the full customer journey, not just the last click before conversion. In modern marketing, customers interact with multiple touchpoints before buying. They might see a Facebook ad, visit your site, leave, see a Google ad, come back, and then convert after clicking a retargeting ad. Which channel deserves credit?
A dashboard with robust multi-touch attribution lets you answer this question intelligently. You can compare different attribution models, see how credit distribution changes based on the model you choose, and make informed decisions about which touchpoints genuinely contribute to conversions. This prevents you from cutting channels that play important assisting roles just because they don't get last-click credit. Choosing the right attribution software for performance marketing is critical for accurate multi-touch analysis.
Automated Alerts and AI-Powered Recommendations: The best dashboards don't just show you data, they tell you what to do with it. Automated alerts notify you when performance drops below thresholds, when costs spike unexpectedly, or when campaigns hit their targets. You don't need to constantly monitor everything manually because the system watches for you.
AI-powered recommendations take this further by analyzing patterns across your campaigns and suggesting optimizations. This might mean identifying ads that are performing well in one campaign and recommending you test them in others, flagging audience segments with unusually high conversion rates, or suggesting budget reallocations based on performance trends. These recommendations turn your dashboard from a reporting tool into an active optimization partner.
Customizable Views for Different Stakeholders: Your campaign manager needs different information than your CFO. A useful dashboard lets you create custom views that show relevant metrics for different roles. Campaign managers might focus on granular performance by ad creative and audience segment. Leadership might want high-level revenue attribution and return on ad spend across channels. The ability to serve both needs from the same underlying data is what makes a dashboard truly valuable across your organization.
Conversion Sync Capabilities: This feature sends enriched conversion data back to your ad platforms to improve their optimization algorithms. When platforms like Meta and Google receive better, more accurate conversion data from your server, their machine learning systems can optimize more effectively. This creates a feedback loop where better data leads to better ad delivery, which leads to better results.
Building Your Dashboard Strategy: From Setup to Scale
Setting up a centralized ad performance dashboard isn't just a technical task. It's a strategic decision that requires planning, integration work, and organizational alignment.
Start by mapping your integration requirements. You need to connect every data source that matters for understanding marketing performance. This typically includes all your paid advertising platforms, your website analytics, your CRM system, and any other tools that track customer interactions. The goal is to create a complete data flow where every touchpoint is captured and connected.
Server-side tracking implementation is often the most technical part of this setup. It requires adding tracking code to your website or app that sends conversion events directly to your dashboard's server, which then forwards that data to your ad platforms through their Conversion APIs. This approach provides more reliable tracking than browser-based pixels alone, especially as privacy regulations and browser restrictions continue to evolve.
Defining your KPIs comes next, and this is where many teams go wrong. Don't just default to the metrics each platform emphasizes. Think about what actually matters for your business. If you're a SaaS company, metrics like cost per trial, trial-to-paid conversion rate, and customer lifetime value matter more than generic metrics like cost per click or impressions. If you're e-commerce, average order value and repeat purchase rate might be more important than simple conversion counts. Understanding which digital marketing performance metrics align with your business model is essential.
Your dashboard should measure and display these business-specific KPIs, not just platform vanity metrics. This might mean creating custom calculated metrics that combine data from multiple sources. For example, true return on ad spend might require connecting ad cost data from your platforms with revenue data from your payment processor and customer lifetime value calculations from your CRM.
Create different views for different stakeholders. Campaign managers need granular, real-time data to make daily optimization decisions. They want to see performance by ad creative, audience segment, time of day, and device type. Marketing directors need higher-level views that show trends over time, performance by channel and campaign, and progress toward quarterly goals. Executives need executive summaries that connect marketing spend to revenue outcomes and strategic KPIs.
Build these views intentionally, asking each stakeholder what questions they need to answer and what decisions they need to make. A dashboard that tries to show everything to everyone becomes cluttered and unusable. Focused views that surface the right information for each role are far more valuable.
Plan for scale from the beginning. As your marketing grows, you'll run more campaigns, test more channels, and generate more data. Your dashboard infrastructure needs to handle increasing data volume without slowing down or requiring constant manual maintenance. This is where choosing a purpose-built attribution platform often makes more sense than trying to cobble together a solution with spreadsheets and basic reporting tools.
Common Pitfalls That Undermine Dashboard Effectiveness
Even with a centralized dashboard in place, several common mistakes can undermine its value and lead to poor decisions.
Over-reliance on platform-reported conversions is the most frequent pitfall. Many marketers set up their dashboard to pull conversion data directly from each ad platform's reporting API, then wonder why the numbers don't add up. Platform-reported conversions are inherently inflated because platforms use attribution windows that maximize their reported results, and they don't deduplicate conversions that multiple platforms claim credit for.
If you simply aggregate platform-reported numbers, you'll end up with conversion counts that far exceed your actual customer numbers. The solution is to use your own conversion tracking as the source of truth, then attribute those real conversions back to marketing touchpoints based on your chosen attribution model. This gives you accurate counts and lets you evaluate channels fairly. Addressing marketing performance measurement accuracy should be a top priority when configuring your dashboard.
Ignoring data latency and attribution window mismatches creates another layer of problems. Different platforms update their data at different speeds. Some show near real-time results, others have 24-48 hour delays. If you're comparing performance across channels without accounting for these timing differences, you might think one channel is outperforming when it's simply reporting faster.
Attribution windows matter too. If you're comparing a channel with a 7-day attribution window to one with a 1-day window, the channel with the longer window will naturally claim more conversions. Make sure your centralized dashboard applies consistent attribution windows across all channels, or at least makes the differences explicit so you're not comparing incompatible metrics.
Failing to connect ad data to actual revenue outcomes is perhaps the most expensive mistake. Many dashboards show conversion counts and cost per conversion, but these metrics only matter if the conversions you're tracking actually drive revenue. A dashboard that doesn't integrate with your CRM or payment system can't tell you which campaigns drive high-value customers versus low-value ones, which channels have the best customer retention, or which traffic sources lead to the highest lifetime value.
Without this revenue connection, you might optimize toward channels that drive cheap conversions but poor customer quality, while underinvesting in channels that cost more per conversion but bring in customers who spend more and stay longer. The dashboard needs to track the full funnel from ad click to revenue to be truly valuable. Conducting thorough cross-platform campaign performance analysis helps identify these revenue disconnects.
Another pitfall is treating the dashboard as a reporting tool rather than an optimization tool. Some teams set up beautiful dashboards, look at them during weekly meetings, and then continue making decisions the same way they always have. The value of centralized data comes from using it to change behavior, reallocate budgets, test new strategies, and continuously improve performance.
Putting Your Unified Data to Work
A centralized ad performance dashboard is only as valuable as the actions you take based on its insights. The goal isn't just to have better data, it's to make better decisions.
Budget reallocation becomes evidence-based rather than intuitive. When you can see which channels genuinely drive revenue with accurate, normalized data, you can confidently shift budget toward what's working and away from what's not. This might mean discovering that a channel you thought was underperforming is actually your best source of high-value customers, or realizing that a channel with impressive conversion counts is bringing in customers who rarely make repeat purchases.
The key is using the dashboard to identify patterns and trends that aren't obvious when looking at platforms individually. Maybe certain channels perform better at different stages of the customer journey. Maybe some channels work well for cold traffic while others excel at converting warm audiences. These insights let you build a more sophisticated, channel-specific strategy rather than treating all channels the same. Learning how to improve campaign performance with analytics transforms raw data into actionable strategy.
Feeding better conversion data back to ad platforms creates a powerful optimization loop. When you use Conversion APIs to send accurate, server-side tracked conversion data back to Meta, Google, and other platforms, their machine learning algorithms receive better training data. This helps them identify patterns in who converts and optimize ad delivery toward similar audiences.
This is especially important in the post-iOS 14.5 world where browser-based tracking is less reliable. Platforms that receive enriched conversion data from your server can optimize more effectively than those relying solely on their own pixel tracking. This often leads to better campaign performance with less manual intervention.
Building a culture of data-driven decision making becomes possible when everyone works from the same source of truth. When your team trusts the data in your centralized dashboard, debates shift from arguing about whose numbers are correct to discussing what the data means and what to do about it. This accelerates decision-making and reduces the politics that often plague marketing organizations.
The dashboard becomes the foundation for strategic planning, not just tactical reporting. You can analyze performance over longer time periods to identify seasonal patterns, test hypotheses about what drives results, and build predictive models that help you forecast future performance. This transforms marketing from a reactive function to a strategic driver of business growth.
Use your unified data to run better experiments. When you can accurately measure the impact of changes across all channels simultaneously, you can test bigger strategic shifts, not just minor tactical tweaks. This might mean testing entirely new channel mixes, experimenting with different attribution models to see how they change your optimization decisions, or running holdout tests to measure incrementality.
Your Path to Marketing Clarity
A centralized ad performance dashboard isn't a luxury for large enterprises with massive budgets. It's a competitive necessity for any marketer running campaigns across multiple platforms. The alternative—juggling tabs, manually compiling reports, and making decisions based on incomplete data—doesn't just waste time. It wastes money and opportunity.
The shift from fragmented data to unified insights changes how you work. You move from reactive reporting to proactive optimization. You stop guessing which channels deserve more budget and start knowing based on actual revenue outcomes. You eliminate the weekly scramble to answer basic questions about performance and gain the time to focus on strategy and growth.
Most importantly, you build confidence in your marketing decisions. When you have accurate, normalized data that connects ad performance to real business outcomes, you can advocate for budgets, defend strategic choices, and demonstrate marketing's impact with clarity and precision.
The marketers who win in today's multi-platform environment aren't necessarily the ones with the biggest budgets. They're the ones with the clearest data, the best attribution, and the ability to act quickly on accurate insights. A centralized dashboard is how you get there.
Ready to elevate your marketing game with precision and confidence? Discover how Cometly's AI-driven recommendations can transform your ad strategy—Get your free demo today and start capturing every touchpoint to maximize your conversions.


