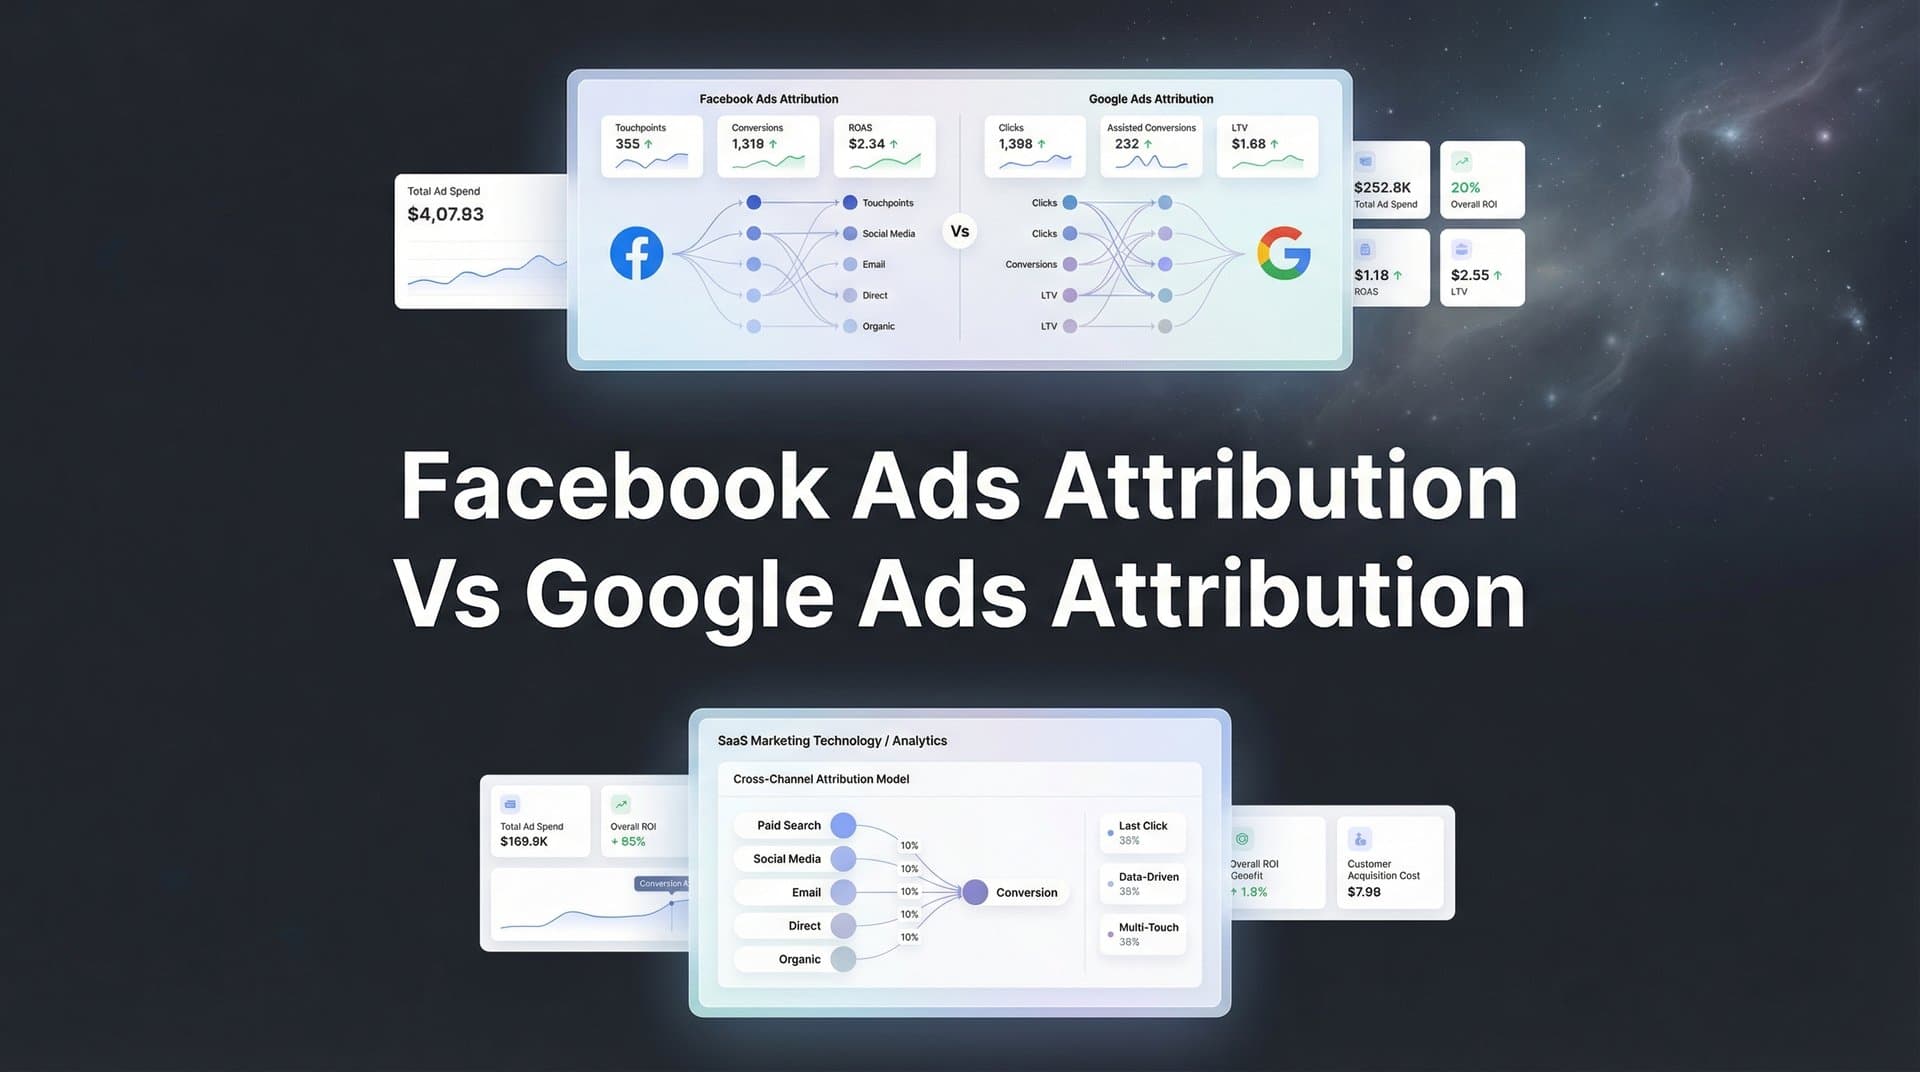
Running ads on both Facebook and Google means dealing with two completely different attribution systems—and they rarely agree on which platform deserves credit for your conversions. Facebook's attribution focuses on view-through and click-based conversions within its ecosystem, while Google prioritizes search intent and last-click interactions. This disconnect leaves marketers scratching their heads when both platforms claim credit for the same sale, or worse, when neither shows the full picture.
The good news? You don't have to choose one platform's version of the truth.
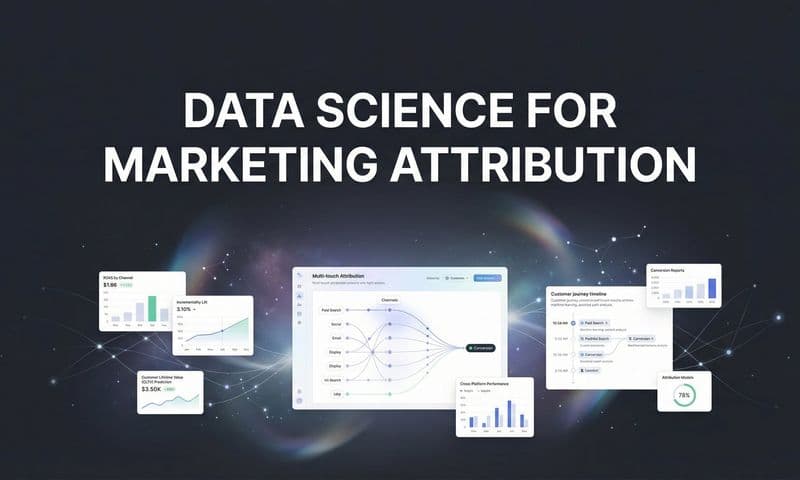
This guide walks you through seven battle-tested strategies to reconcile these attribution differences, understand what each platform actually measures, and build a unified view of your cross-platform performance. Whether you're scaling spend or optimizing existing campaigns, these approaches will help you make confident budget decisions based on accurate data.
1. Understand the Fundamental Attribution Model Differences
The Challenge It Solves
When Facebook reports 50 conversions and Google claims 35 from the same campaign period, which number do you trust? This confusion stems from fundamentally different measurement philosophies. Facebook prioritizes awareness and engagement metrics, counting conversions that happen after someone simply views your ad. Google emphasizes intent-driven interactions, focusing on active clicks and searches. Without understanding these core differences, you'll constantly question your data and make budget decisions based on incomplete information.
The Strategy Explained
Facebook's attribution system captures both click-through conversions and view-through conversions. If someone sees your ad in their feed, doesn't click, but converts later through another channel, Facebook may still claim that conversion within its attribution window. This approach reflects Facebook's role as an awareness and discovery platform.
Google Ads traditionally used last-click attribution as its default model, giving all credit to the final ad interaction before conversion. While Google now offers data-driven attribution that considers multiple touchpoints, its measurement still centers on active user intent—searches, clicks, and direct interactions with your ads.
The practical impact? Facebook's numbers often appear higher because view-through attribution captures passive ad exposure. Google's numbers tend to be more conservative, focusing on direct response actions. Neither is wrong—they're measuring different parts of your marketing funnel.
Implementation Steps
1. Review your current attribution settings in both platforms to understand what each is actually measuring—check Facebook's attribution window settings and Google's chosen attribution model.
2. Document how each platform defines a conversion event to identify where measurement overlaps and where it diverges.
3. Set realistic expectations with stakeholders about why platform numbers won't match, focusing conversations on trends and directional performance rather than absolute numbers.
Pro Tips
Create a reference document that explains your attribution setup to anyone reviewing campaign reports. This prevents endless debates about "which number is right" and shifts focus to actionable insights. Remember that understanding the difference is the foundation for everything else—you can't reconcile data you don't understand.
2. Align Attribution Windows Across Both Platforms
The Challenge It Solves
Comparing Facebook's 7-day click and 1-day view attribution to Google's 30-day click window is like measuring distance in miles versus kilometers—the numbers will never align. When attribution windows differ, you're not just comparing apples to oranges; you're making budget decisions based on fundamentally incompatible data sets. This misalignment causes marketers to over-invest in platforms that appear to perform better simply because they use longer attribution windows.
The Strategy Explained
Attribution windows determine how long after an ad interaction a platform can claim credit for a conversion. Facebook's default shifted to 7-day click and 1-day view following iOS privacy updates, while Google offers various window options including 30-day, 60-day, and 90-day click windows.
The key to fair comparison is standardization. By setting both platforms to the same attribution windows, you create an apples-to-apples performance view. This doesn't mean one window is universally correct—it means you're measuring the same time period across both platforms.
Consider your actual sales cycle when choosing windows. If your average customer converts within three days of first seeing an ad, a 7-day window captures most relevant conversions. If you're in B2B with longer consideration periods, you might need 30-day windows to see the full picture.
Implementation Steps
1. Analyze your historical conversion data to identify your typical time-to-conversion—look at how many days typically pass between first ad interaction and purchase.
2. Set matching attribution windows in both platforms based on your sales cycle, choosing windows that capture the majority of your conversions without inflating numbers with loosely related touchpoints.
3. Run parallel reporting for one month using both your old settings and new aligned windows to quantify the impact of this change before making budget adjustments.
Pro Tips
Shorter attribution windows provide cleaner data and reduce overlap between platforms, but they may undercount conversions from longer sales cycles. If you're unsure which window to choose, start with 7-day click windows on both platforms—this matches Facebook's post-iOS default and provides conservative, reliable data for most direct-response campaigns.
3. Implement Server-Side Tracking for Accurate Cross-Platform Data
The Challenge It Solves
Browser-based tracking is dying, and it's taking your conversion data with it. iOS App Tracking Transparency, cookie restrictions, and ad blockers create massive blind spots in your attribution. When Facebook's pixel or Google's tag can't fire due to browser limitations, both platforms miss conversions they actually drove. This isn't a small problem—many advertisers find that 20-40% of their actual conversions go unreported, leading to undervalued campaigns and poor optimization decisions.
The Strategy Explained
Server-side tracking bypasses browser limitations by sending conversion data directly from your server to ad platforms. Instead of relying on JavaScript pixels that browsers can block, your backend system securely transmits conversion events through APIs like Facebook's Conversions API and Google's Enhanced Conversions.
This approach captures conversions that browser-based tracking misses. When someone opts out of tracking on iOS, blocks cookies, or uses privacy-focused browsers, traditional pixels fail. Server-side tracking still works because it operates outside the browser environment.
The implementation requires technical setup, but the payoff is substantial. You recover lost conversion data, improve attribution accuracy across both platforms, and provide ad algorithms with better information for optimization. This means more accurate ROAS reporting and better automated bidding performance.
Implementation Steps
1. Set up Facebook's Conversions API integration through your website platform, CRM, or a tag management solution that supports server-side tracking.
2. Implement Google Ads Enhanced Conversions by passing hashed customer data from your server to Google alongside conversion events.
3. Run both browser-based and server-side tracking in parallel initially, then compare conversion counts to quantify how much data you were previously missing.
Pro Tips
Server-side tracking isn't just about recovering lost conversions—it also improves data quality by reducing duplicate events and providing more reliable user matching. If technical implementation feels overwhelming, platforms like Cometly handle server-side tracking automatically while providing unified attribution across all your marketing channels.
4. Build a Unified Attribution Dashboard Outside Platform Silos
The Challenge It Solves
Jumping between Facebook Ads Manager, Google Ads, and your analytics platform creates a fragmented view of performance. Each platform shows different numbers, uses different metrics, and naturally emphasizes its own contribution. This forces you to manually reconcile data in spreadsheets, wasting hours on data wrangling instead of strategic analysis. Worse, you never get a clear answer to the most important question: which combination of channels actually drives revenue?
The Strategy Explained
A unified attribution dashboard connects all your marketing data sources to a single reporting interface that shows true cross-platform performance. Instead of trusting what Facebook or Google claims individually, you're looking at actual revenue data from your CRM or e-commerce platform matched back to ad spend across all channels.
This approach treats ad platforms as data sources, not sources of truth. Your dashboard pulls spend data from Facebook and Google, matches it to actual conversions from your order system, and calculates unified metrics like blended ROAS, customer acquisition cost, and lifetime value across all channels.
The power comes from seeing the full customer journey. When someone clicks a Facebook ad, searches your brand on Google, then converts, both platforms claim credit. Your unified dashboard shows this as one customer journey with multiple touchpoints, giving you accurate attribution without double-counting revenue.
Implementation Steps
1. Connect your ad platforms, website analytics, and revenue data (CRM or e-commerce platform) to a unified attribution tool that can match conversions back to marketing touchpoints.
2. Define your key performance metrics—blended ROAS, true CAC, contribution margin by channel—and build dashboards that show these metrics across all platforms in one view.
3. Set up automated reporting that delivers daily or weekly performance summaries, eliminating the need to manually compile data from multiple sources.
Pro Tips
Your unified dashboard should become your primary decision-making tool, not just a reporting add-on. Make it your team's single source of truth for budget allocation meetings. When platform-specific reports show different numbers, reference your unified dashboard to cut through the noise and focus on actual business outcomes.
5. Use Incrementality Testing to Validate Platform Claims
The Challenge It Solves
Attribution models show correlation, not causation. Just because Facebook reports 100 conversions doesn't mean those 100 sales wouldn't have happened without the ads. Some customers were already planning to buy, some would have found you through organic search, and some clicked your ad but were really influenced by a different marketing touchpoint. Without testing true incrementality, you risk over-investing in channels that take credit for sales they didn't actually cause.
The Strategy Explained
Incrementality testing measures the actual lift your ads create by comparing a group exposed to your ads against a control group that isn't. This approach answers the critical question: how many additional conversions did this campaign actually generate?
The most common incrementality test is a geo-based holdout experiment. You pause ads in certain geographic regions while continuing them in others, then compare conversion rates between the test and control groups. The difference represents true incremental impact.
Another approach is audience-based holdouts, where you exclude a random segment of your target audience from seeing ads, then measure how their conversion behavior differs from the exposed group. This method works particularly well for brand awareness campaigns where you're testing upper-funnel impact.
The results often surprise marketers. You might discover that your Facebook retargeting campaigns show great attribution numbers but minimal incrementality because those users would have converted anyway. Or you might find that brand campaigns with weak last-click attribution actually drive significant incremental revenue.
Implementation Steps
1. Design a geo-based holdout test by selecting matched geographic markets—split them into test (ads running) and control (ads paused) groups with similar historical performance.
2. Run the test for at least two weeks to account for weekly fluctuations, tracking conversions in both test and control regions through your analytics platform.
3. Calculate incremental ROAS by comparing the conversion lift in test regions against ad spend, giving you a true measure of advertising effectiveness beyond attribution claims.
Pro Tips
Run incrementality tests quarterly rather than continuously—constant testing disrupts campaign performance. Use the insights to validate your attribution model assumptions and adjust budget allocation based on proven incremental impact. If a channel shows strong attribution but weak incrementality, consider reducing spend and reallocating to channels with better true lift.
6. Map the Customer Journey to Understand Platform Roles
The Challenge It Solves
Treating Facebook and Google as competing channels misses the reality of how customers actually buy. Someone might discover your product through a Facebook ad, research it on Google days later, compare options, then finally convert after clicking a retargeting ad. When you view these platforms in isolation, you miss how they work together throughout the customer journey. This leads to budget cuts on channels that play crucial but non-converting roles, damaging overall performance.
The Strategy Explained
Customer journey mapping reveals how different channels contribute at various stages of the buying process. Facebook typically excels at awareness and discovery—introducing your product to cold audiences who aren't actively searching for solutions. Google dominates intent-driven moments—capturing demand from people actively looking for what you offer.
Understanding these distinct roles changes how you evaluate performance. A Facebook campaign might show weak last-click attribution but be essential for generating the initial awareness that leads to branded Google searches. A Google brand campaign might show strong ROAS but only because Facebook ads created that brand awareness first.
Multi-touch attribution models help visualize these relationships. Position-based attribution, for example, gives credit to both the first touchpoint (often Facebook) and the last touchpoint (often Google), acknowledging that both played important roles. Time-decay models recognize that touchpoints closer to conversion typically have more influence, while still crediting earlier interactions.
Implementation Steps
1. Use your analytics platform to build path reports showing the sequence of touchpoints leading to conversions—identify common patterns like "Facebook ad → Google search → conversion."
2. Segment your customer journey by product type or customer segment to understand how paths differ for various audiences and offerings.
3. Assign strategic roles to each platform based on journey data—position Facebook as your awareness driver and Google as your intent capturer, then optimize each platform for its specific role rather than treating both as direct-response channels.
Pro Tips
Don't expect every channel to show strong last-click attribution. Channels that introduce customers to your brand (like Facebook prospecting) naturally show weaker last-click numbers but may be essential for filling your funnel. Judge each platform by its role in the journey, not by a single attribution metric.
7. Create a Blended ROAS Framework for Budget Decisions
The Challenge It Solves
When Facebook reports 4x ROAS and Google shows 6x ROAS, the natural instinct is to shift budget toward Google. But this ignores how channels work together and leads to short-sighted optimization. Cutting Facebook might tank your Google performance because you're no longer generating the awareness that drives branded searches. Making budget decisions based on platform-reported ROAS alone is like judging basketball players only by points scored, ignoring assists, defense, and teamwork.
The Strategy Explained
Blended ROAS calculates your overall return across all marketing channels combined, giving you a unified performance metric that accounts for cross-channel dynamics. Instead of optimizing each platform in isolation, you're maximizing total marketing efficiency.
The calculation is straightforward: total revenue divided by total ad spend across all platforms. If you spend $10,000 on Facebook and $15,000 on Google, generating $125,000 in attributed revenue, your blended ROAS is 5x. This number becomes your north star for budget allocation.
The framework extends beyond simple ROAS. Calculate blended customer acquisition cost, blended contribution margin, and blended lifetime value to understand true profitability. These metrics reveal whether your marketing mix is actually profitable once you account for all costs and customer behavior.
Use blended metrics to guide incremental budget decisions. When you increase Facebook spend by $5,000, track the impact on blended ROAS rather than just Facebook ROAS. This captures any positive or negative effects on Google performance, giving you a complete picture of the budget change's impact.
Implementation Steps
1. Calculate your current blended ROAS by dividing total revenue by total ad spend across Facebook, Google, and any other paid channels you're running.
2. Set blended ROAS targets based on your business goals and profit margins—this becomes your benchmark for evaluating overall marketing performance.
3. Test budget shifts using blended metrics as your success measure—increase spend on one platform and track changes in blended ROAS to see if the shift improved overall efficiency or just shifted attribution.
Pro Tips
Blended ROAS works best when paired with incrementality testing. Use incrementality tests to validate that your marketing is actually driving the revenue your blended ROAS suggests, not just claiming credit for organic sales. Update your blended ROAS targets quarterly as your business scales and your marketing mix matures.
Your Cross-Platform Attribution Roadmap
Reconciling Facebook and Google attribution doesn't require choosing one platform's truth over another—it requires building your own source of truth. Start by aligning attribution windows for fair comparison, then implement server-side tracking to capture the conversions both platforms miss. Build a unified dashboard that connects ad spend to actual revenue, and validate your findings with incrementality tests.
Understanding that each platform plays a different role in your customer journey helps you set realistic expectations and allocate budget based on true performance, not inflated platform claims. Facebook excels at awareness and discovery, introducing your brand to new audiences. Google captures intent-driven demand from people actively searching for solutions. Both matter, but they matter differently.
The marketers who master cross-platform attribution don't just save ad spend—they scale with confidence knowing exactly which channels drive real revenue. They stop arguing about which platform's numbers are "right" and start focusing on the metrics that actually matter: blended ROAS, true customer acquisition cost, and incremental lift.
Your attribution framework should evolve as your marketing matures. Start with the fundamentals—aligned windows and server-side tracking. Layer in unified reporting and journey mapping as you scale. Add incrementality testing when you're ready to validate platform claims with hard evidence.
Ready to elevate your marketing game with precision and confidence? Discover how Cometly's AI-driven recommendations can transform your ad strategy—Get your free demo today and start capturing every touchpoint to maximize your conversions.