If you don’t know what you’re measuring, you can’t improve it. It's a simple truth, but it’s amazing how often it gets ignored in marketing. To truly understand if your marketing is working, you have to move past vague hopes and set clear, specific goals that are tied directly to your company's bigger business objectives. Every action, every dollar spent, needs a purpose and a way to measure its impact.
Building a Foundation with Clear Marketing Goals
 How to Measure Marketing Effectiveness & Maximize ROI
Before you ever log into an analytics platform or start building a fancy dashboard, the most important work happens. A lot of marketing campaigns don’t fail because the ads were bad or the copy was off—they fail because no one ever defined what "success" actually looked like. Asking "is our marketing working?" without a clear benchmark is like asking for directions without knowing where you want to go.
This foundation isn’t built on fluffy ambitions like "get more leads" or "increase sales." It’s constructed with precise, intentional goals that connect what marketing does every day to the overall health of the business.
Moving Beyond Vague Ambitions
The first mental shift is to stop seeing marketing goals as a separate to-do list. They should be a direct reflection of what the business is trying to achieve. If the company needs to boost profitability, a relevant marketing goal isn’t just "more sales," but something sharp like, "decrease Customer Acquisition Cost (CAC) by 15%."
This is the kind of specificity that turns measurement from a boring reporting task into a powerful strategic tool. It gives you the "why" behind every metric you track.
Let's look at a couple of real-world examples:
- An e-commerce brand's business goal: Improve customer loyalty and get more repeat business.
- A poor marketing goal: "Engage customers more." (What does that even mean?)
- A strong marketing goal: "Increase the 90-day repeat purchase rate from 20% to 25% by the end of Q3."
- A B2B SaaS company's business goal: Shorten a long and painful sales cycle.
- A poor marketing goal: "Generate more MQLs." (More isn't always better.)
- A strong marketing goal: "Reduce the average MQL-to-SQL conversion time from 45 days to 30 days within six months."
See the difference? This level of detail gives your measurement efforts immediate focus and a clear purpose.
Adopting the SMART Framework
The SMART framework is an oldie but a goodie for a reason. It’s a reliable way to make sure your goals are well-defined and, more importantly, trackable.
- Specific: Nail down exactly what you want to achieve. Who’s involved? What are the constraints?
- Measurable: Define how you'll track progress. What specific numbers will tell you if you're on the right path?
- Achievable: Be honest with yourself. Is the goal tough but still possible with the team and budget you have?
- Relevant: Does this goal actually matter to the business? Will hitting it make a real impact on the bottom line?
- Time-bound: Give it a deadline. A goal without a deadline is just a dream.
Key Takeaway: A goal that isn't written down with a specific metric and a deadline is just a wish. The SMART framework forces the clarity you need for any kind of effective measurement.
This foundational work pays off, big time. A 2025 study from Boston Consulting Group found that marketing leaders who put best-in-class measurement practices in place—including standardized KPI frameworks—see up to 70% higher revenue growth than their peers. It's a straight line from having solid processes to getting better business results. You can find more details in the full BCG research about these marketing measurement leaders and their strategies.
Actionable KPIs vs. Vanity Metrics
Once you have clear goals, it becomes much easier to separate the metrics that matter from the ones that just make you feel good. Vanity metrics, like social media likes or total page views, are often all sizzle and no steak. They look impressive on a report but don’t usually connect to real business outcomes.
Actionable KPIs, on the other hand, are the numbers tied directly to your SMART goals. They tell you about the true health of your marketing efforts.
To help you get started, here's a table that connects common business goals to the KPIs you should actually be tracking.
Essential Marketing KPIs by Business Goal
Business GoalPrimary Marketing KPIsWhat It Tells YouIncrease Brand Awareness• Social Media Reach• Share of Voice (SOV)• Website TrafficHow visible your brand is to your target audience and your position relative to competitors.Generate More Leads• Cost Per Lead (CPL)• Conversion Rate (Leads)• Marketing Qualified Leads (MQLs)The efficiency and effectiveness of your lead generation campaigns and channels.Improve Customer Loyalty• Customer Lifetime Value (CLV)• Repeat Purchase Rate• Churn RateHow well you retain customers and build long-term value from your existing customer base.Boost Sales & Revenue• Return on Ad Spend (ROAS)• Customer Acquisition Cost (CAC)• Sales Conversion RateThe direct financial impact of your marketing efforts and the profitability of your campaigns.Shorten the Sales Cycle• MQL-to-SQL Conversion Rate• Average Sales Cycle Length• Funnel VelocityHow quickly leads are moving through your pipeline and converting into paying customers.
For a SaaS company trying to lower its CAC, the metrics that matter aren't just traffic numbers; they're Cost Per Lead, Lead-to-Customer Conversion Rate, and the CAC itself. These are the numbers that justify budgets, guide strategic decisions, and ultimately prove marketing's value. Getting this groundwork right ensures your measurement plan delivers real clarity, not just a mountain of data.
Choosing the Metrics That Actually Matter
 How to Measure Marketing Effectiveness & Maximize ROI
Once your goals are locked in, you hit the next major hurdle: cutting through the overwhelming noise of data to pick metrics that actually signal growth. Too many marketers drown in a sea of analytics, tracking everything but understanding nothing.
The secret isn't more data; it's the right data.
The right metrics aren't one-size-fits-all. The Key Performance Indicators (KPIs) that matter for a B2B tech firm are completely different from those of a direct-to-consumer (DTC) e-commerce brand. It all comes down to context and what aligns with your specific business model.
For example, a B2B tech company with a long, complex sales cycle needs to be obsessed with funnel efficiency. Their most critical metrics are likely MQL-to-SQL Conversion Rate, Cost Per Lead (CPL), and Sales Cycle Length. These KPIs tell them if marketing is handing off qualified, high-intent leads to sales, directly impacting the revenue pipeline.
A DTC e-commerce brand, however, lives and dies by transactional speed and customer loyalty. Their go-to metrics would be Average Order Value (AOV), Repeat Purchase Rate, and Customer Lifetime Value (CLV). These numbers reveal if they’re successfully encouraging bigger purchases and building a loyal base that drives profitable, long-term growth.
Categorizing Your Core Marketing Metrics
To bring some order to the chaos, it helps to group your metrics by their role in the marketing funnel. This approach ensures you have a balanced view of performance, from initial awareness all the way to long-term loyalty.
- Brand Awareness Metrics: These tell you how visible your brand is in the market. Focus on Share of Voice (SOV) to see how you stack up against competitors and Website Traffic from direct and branded search queries.
- Lead Generation Metrics: This is all about capturing interest efficiently. Key numbers here include Conversion Rate on landing pages, Cost Per Lead (CPL), and the total number of Marketing Qualified Leads (MQLs).
- Customer Acquisition Metrics: Here, you measure the final push to purchase. Keep a close eye on your Customer Acquisition Cost (CAC), Return on Ad Spend (ROAS), and Sales Conversion Rate.
- Retention and Loyalty Metrics: This category reveals the health of your customer relationships. You’ll want to monitor Churn Rate (how many customers you lose), Customer Lifetime Value (CLV), and Net Promoter Score (NPS).
Expert Tip: Don't just track the final outcome. Monitoring intermediate metrics helps you identify bottlenecks. If your MQL count is high but your CAC is soaring, there’s likely a disconnect between marketing's lead quality and sales' ability to close—pointing to a specific problem you can solve.
Building Your Mission Control Dashboard
After you've handpicked your core KPIs, the next step is to pull them into one place. Your goal is to build a "mission control" dashboard that gives you an at-a-glance view of your marketing engine's health. This isn't just another report; it's a strategic tool designed for quick, decisive action.
A well-designed dashboard should surface the most critical top-level metrics while still letting you drill down into the specifics. For example, if you're evaluating a campaign, understanding key influencer marketing KPIs is crucial for that specific channel, and your dashboard needs to reflect that granularity.
The power of a central dashboard is that it forces you to prioritize. When you're limited to a single screen, you have to choose the handful of metrics that truly define success. This focus keeps you from getting lost in vanity metrics and aligns your team on what actually drives growth. By mastering the art of KPI selection and presentation, you can develop powerful insights using various marketing analytics techniques that turn data into action. This approach transforms measurement from a reactive reporting task into a proactive, strategic advantage.
Setting Up Your Analytics and Tracking Toolkit
 How to Measure Marketing Effectiveness & Maximize ROI
All the goal-setting in the world won't matter if you can't actually measure what's happening. Your goals and KPIs are useless without a reliable system to capture the data. To get a true read on marketing effectiveness, you need a solid, interconnected tech stack. This isn't about buying the most expensive software; it's about building a toolkit where data flows seamlessly, giving you a complete and honest picture of performance.
Think of your setup as the plumbing in your marketing house. If it’s leaky or the pipes aren't connected, you'll never get a clear idea of what's working.
The Core of Your Toolkit: Google Analytics 4
For most businesses, the journey into analytics starts with Google Analytics 4 (GA4). This is your command center for understanding how people interact with your website and apps. GA4 ditched the old session-based model for an event-based one, which gives you a much more flexible and user-focused view of behavior.
Getting GA4 set up correctly is non-negotiable. This means doing more than just slapping the tracking code on your site. You have to configure custom events that tie directly back to your marketing goals.
- For an e-commerce store: This means setting up events for
add_to_cart,begin_checkout, and, most importantly,purchase. - For a SaaS company: You should be tracking events like
sign_up,demo_request, andtrial_start.
These events are the raw ingredients for your KPIs. Without them, you’re stuck looking at page views and session counts, which almost never tell the full story of your marketing impact.
Key Insight: Your analytics setup should be a direct reflection of your business objectives. If your goal is to generate high-quality leads, your GA4 configuration must be able to tell the difference between a casual browser and someone who actually filled out your lead form.
Bridging Marketing and Sales with a CRM
While GA4 gives you a great view of what happens on your website, its visibility ends once a lead is captured. That’s where a Customer Relationship Management (CRM) system like HubSpot or Salesforce becomes critical. Integrating your CRM with your marketing platforms closes the loop between a marketing action and a sales outcome.
This connection is what allows you to answer the really important questions:
- Which of our campaigns are bringing in leads that actually become paying customers?
- What's the real Customer Lifetime Value (CLV) of leads from different channels?
- How long is the sales cycle for leads from our blog versus leads from paid ads?
Without this link, your marketing team is flying blind, optimizing for MQLs that might never convert to anything real. By connecting these two systems, you can shift your focus to metrics that actually reflect revenue, like your MQL-to-SQL Conversion Rate and Pipeline Contribution. When you're ready to dig deeper, this integration unlocks a whole new world of essential marketing and digital performance metrics.
Keeping Your Data Clean with UTM Parameters
A connected tech stack is only as strong as the data flowing through it. If your data is inconsistent or messy, you’ll end up with flawed conclusions. This is where Urchin Tracking Module (UTM) parameters become one of your most valuable tools for data hygiene.
UTMs are just simple tags you add to the end of a URL to track where your traffic is coming from. They tell Google Analytics—and by extension, your CRM—the exact source, medium, and campaign that sent a visitor your way.
A well-structured UTM link might look like this:yourwebsite.com/landing-page?utm_source=linkedin&utm_medium=paid_social&utm_campaign=q3_product_launch
This one tag tells you the click came from a paid social ad on LinkedIn that was part of your Q3 product launch campaign. Adopting a strict, standardized UTM naming convention across your entire team is one of the highest-impact things you can do to improve your measurement. It ensures every click is attributed correctly, preventing your analytics from turning into a useless mess of "direct/none" traffic.
This clean data is what ultimately gives you the power to make sharp, confident decisions about where to put your marketing budget for the best possible returns.
Understanding Modern Attribution Modeling
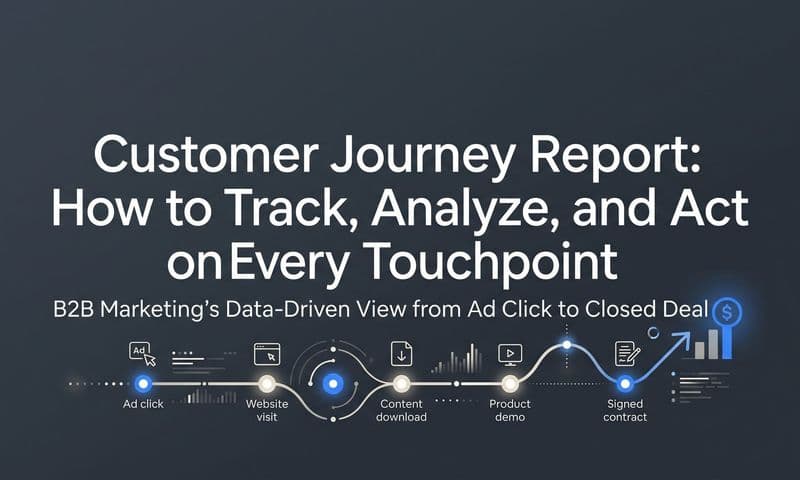
The modern customer journey is rarely a straight line. Think about it. A potential customer might see your ad on Instagram, read one of your blog posts a week later after a Google search, get hit with a retargeting ad on LinkedIn, and finally click a link in your email newsletter to make a purchase.
So, which one of those touchpoints gets the credit? This is the central puzzle that attribution modeling aims to solve.
Attribution is simply the process of assigning value to the different marketing touchpoints that lead to a conversion. Without it, you're just guessing where to put your budget. A solid approach to attribution is fundamental to measuring marketing effectiveness accurately.
The Classic Attribution Models
To get a handle on modern methods, it helps to start with the foundational models. Each one tells a different story about the customer journey, and while they can be a bit simplistic, they highlight different strategic priorities. You can dive deeper in our complete guide on how to measure marketing attribution.
- First-Touch Attribution: This model gives 100% of the credit to the very first interaction a customer has with your brand. It’s great for understanding which channels are best at generating initial awareness. If a user first discovers you through a podcast sponsorship and later converts, the podcast gets all the glory.
- Last-Touch Attribution: The polar opposite of first-touch, this gives 100% of the credit to the final interaction before a conversion. It's the default in many platforms because it's easy to track and emphasizes what closes the deal. If that same user clicked a Google Ad right before buying, the ad gets all the credit, completely ignoring the podcast that started it all.
- Linear Attribution: This model splits credit equally among all touchpoints in the path. If there were four interactions (podcast, blog, Google Ad, email), each would get 25% of the credit. It at least acknowledges that multiple touchpoints matter, but it wrongly assumes they all have the same impact.
Key Takeaway: While these classic models are a decent starting point, they often oversimplify a complex process. First-touch overvalues awareness, last-touch overvalues closing, and linear treats every interaction like it’s equal. The real world is far more nuanced.
This infographic breaks down the high-level process of collecting and analyzing data for any measurement model you choose.
 How to Measure Marketing Effectiveness & Maximize ROI
This flow really drives home one point: no matter which attribution model you pick, the output is only as reliable as the data you gather, clean, and analyze.
Advanced Measurement for a Privacy-First World
As privacy regulations tighten and user-level tracking gets harder, marketers are shifting toward more sophisticated, privacy-safe methods. Two methods, in particular, have become essential for measuring marketing effectiveness today: incrementality testing and Media Mix Modeling.
Answering "What If" with Incrementality Testing
Incrementality testing moves beyond just assigning credit and instead answers a far more powerful question: “Did this marketing activity cause a conversion that wouldn't have happened otherwise?” It measures the true lift of a campaign.
The process is straightforward. You split an audience into two groups:
- Test Group: Sees the ad or campaign.
- Control Group: Does not see the ad or campaign.
By comparing the conversion rates between the two, you can isolate the actual, causal impact of your marketing. If the test group's conversion rate is 5% and the control group's is 2%, you can confidently say your campaign drove a 3% incremental lift. This method provides some of the cleanest, most defensible data on campaign effectiveness.
The Return of Media Mix Modeling
Another significant evolution in measurement is the revival of Media Mix Modeling (MMM). This is a statistical technique that analyzes aggregated historical data—like sales, seasonality, and ad spend across all channels—to determine the overall impact of each channel on revenue.
Because MMM uses high-level, anonymized data, it's completely privacy-compliant. No cookies or individual user tracking required. This shift is a direct response to growing data restrictions, and it's gaining serious momentum.
In fact, a 2024 EMARKETER survey found that 61% of marketers plan to improve their measurement strategies by adopting MMM.
By combining the big-picture view of MMM with the specific, causal insights from incrementality tests, you can build a robust and future-proof system for measuring marketing effectiveness. This multi-layered approach gives you the confidence to make smarter budget decisions, even as the digital landscape continues to change.
Integrating Purpose-Driven Metrics Into Your Model
For a long time, measuring marketing effectiveness was all about the numbers on a spreadsheet—financial returns, ROAS, and not much else. But that's changing. Today, consumers are voting with their wallets, and they're increasingly choosing brands whose values mirror their own. This makes purpose-driven marketing a real competitive advantage, not just a feel-good initiative.
This shift means your measurement model has to evolve, too. Quantifying your brand’s impact on sustainability, diversity, or social good is no longer a “nice-to-have.” It’s becoming a critical piece of the modern marketing scorecard.
Beyond ROAS: The New Brand KPIs
The smartest brands are looking past traditional ROI to include metrics that show their character and commitment. This requires a new playbook of KPIs that can capture these less tangible, but increasingly vital, aspects of performance.
Some of the emerging metrics gaining serious traction include:
- Carbon Footprint Reduction: This involves measuring the drop in carbon emissions tied to your marketing activities—everything from the energy used by digital ads to the logistics of physical events.
- Workplace Diversity Metrics: Are your campaigns and your marketing team truly representative? This metric tracks the diversity you feature in your ads and within your own team to ensure you're practicing what you preach.
- Supply Chain Transparency: Here, you're quantifying and communicating ethical sourcing and labor practices, weaving that story into your brand narrative and marketing materials.
- Social Return on Investment (SROI): This is a framework for putting a number on the social, environmental, and economic value your marketing creates, measured against its cost.
For example, a fashion brand could start measuring the percentage of its ad campaigns that feature materials from certified sustainable sources. A tech company might track the diversity ratios in its advertising and partner with non-profits, using SROI to measure the real-world impact.
“Effective measurement is no longer just about what marketing achieved in sales, but what it contributed to society. Brands that measure their purpose are building deeper trust and loyalty with conscious consumers.”
This deeper level of analysis feeds directly into your long-term brand health. It proves that your brand doesn’t just sell things—it actually stands for something meaningful.
Incorporating Purpose Into Your Measurement Framework
Getting started with this doesn't mean you have to rip up your current measurement system and start from scratch. The key is to start small. Begin by identifying one or two purpose-driven goals that genuinely align with your brand's core mission.
A major trend we're seeing is the integration of these new metrics directly into established frameworks like Media Mix Modeling (MMM). For the first time, leading brands are measuring impacts like Carbon Footprint Reduction and Social Return on Investment (SROI) right alongside their sales data. This is a huge shift, redefining marketing effectiveness to include broader social contributions. If you're curious about where this is all headed, you can read more about the future of marketing measurement on Analytic Edge.
To get started, try these actionable steps:
- Identify Your Core Values: What social or environmental issues do your brand and your customers actually care about? Start there.
- Set a Tangible Goal: Make it specific and measurable. Something like, "Increase the use of underrepresented creators in our campaigns by 30% this year."
- Find a Relevant Metric: Assign a KPI to that goal. For the example above, it could be the percentage of your creative budget allocated to diverse creators.
By weaving these purpose-driven metrics into your existing models, you get a much more complete picture of your marketing's total impact. This approach not only strengthens your brand equity but also helps you optimize marketing spend by investing in campaigns that deliver both financial and social returns.
Turning Your Data and Insights Into Action
Collecting data and connecting your tech stack is foundational, but it’s not the finish line. The real power in measuring marketing effectiveness comes from what you do next. Raw numbers sitting in a dashboard are just potential; their value is only unlocked when you translate them into strategic action.
This is where you close the loop—turning sharp analysis and key insights into tangible, real-world improvements. The goal is to build a repeatable process for reviewing performance, spotting opportunities, and systematically making your marketing better and better over time.
Creating a Rhythm of Review and Analysis
Effective measurement isn’t a one-and-done project. It’s an ongoing discipline. To make this manageable, you need to establish a consistent rhythm for checking in on your dashboards. This simple habit stops you from only looking at data when a fire needs putting out.
A practical approach involves different levels of review at different intervals:
- Daily Check-in (15 minutes): A quick, top-level glance. Are your campaigns live? Is ad spend pacing correctly? Are there any sudden, drastic drops in performance that scream "technical issue"?
- Weekly Tactical Review (1 hour): This is where you dig into campaign-level performance. How is that new ad creative performing against the control? Is a specific channel’s CPL trending up or down? This is your chance to make smaller adjustments, like shifting budget between ad sets.
- Monthly Strategic Review (2-3 hours): Now you zoom out and look at the big picture. Are you on track to hit your quarterly KPIs? What broader trends are emerging across channels? This is the time to ask bigger questions about your overall strategy and plan major tests for the upcoming month.
This structured approach transforms measurement from a chaotic, reactive task into a proactive, strategic habit.
From Observation to Hypothesis
During your reviews, you'll start spotting patterns and outliers. The key is to move from simply observing these data points to forming a clear hypothesis about why they are happening.
For instance, you might observe that your landing page conversion rate dropped by 20% last week. A poor analysis just stops there. A great analysis digs deeper.
Your observation should spark a hypothesis, something like this: "We believe the conversion rate dropped because the new headline we launched doesn't resonate with the audience from our LinkedIn ads, creating a message mismatch."
Key Insight: A hypothesis is a testable idea, not just a random guess. Frame it as: "We believe [this is happening] because [of this reason]." This structure automatically points you toward a specific action you can take to prove or disprove it.
Once you have a solid hypothesis, you have the foundation for your next step: systematic optimization. You can then take this knowledge and apply it to a variety of strategies to improve your marketing ROI across the board.
Fostering a Culture of Experimentation
The single most powerful way to turn insights into action is through a relentless process of testing and iteration. This means fostering a culture where experimentation is encouraged and failure is treated as a learning opportunity, not a career-ending mistake.
A/B testing (or split testing) is your primary tool here. It’s all about testing one change at a time to see exactly how it affects performance.
You can—and absolutely should—test everything:
- Ad Creative: Pit different images, videos, and ad copy against each other.
- Landing Pages: Experiment with headlines, call-to-action buttons, page layouts, and form fields.
- Email Campaigns: Test your subject lines, sending times, and the content inside the email.
- Offers: Test a free trial against a product demo, or a 10% discount against free shipping.
Let's go back to our landing page example. With the hypothesis that the new headline caused the performance drop, your A/B test is clear: run the old headline against the new one for the same audience. The results will give you a definitive, data-backed answer, not just an opinion from the highest-paid person in the room.
This creates a powerful feedback loop: you measure performance, analyze the data to form a hypothesis, run an A/B test to get a clear answer, and then implement the winning variation. This cycle of measure, analyze, optimize, and repeat is the engine that drives continuous improvement and ensures your marketing efforts lead to real, sustainable business growth.
Ready to turn your data into revenue? Cometly is the marketing attribution platform that unifies all your data, tracks every touchpoint, and provides the clear insights you need to optimize ad spend and scale with confidence. See how Cometly can transform your marketing effectiveness.