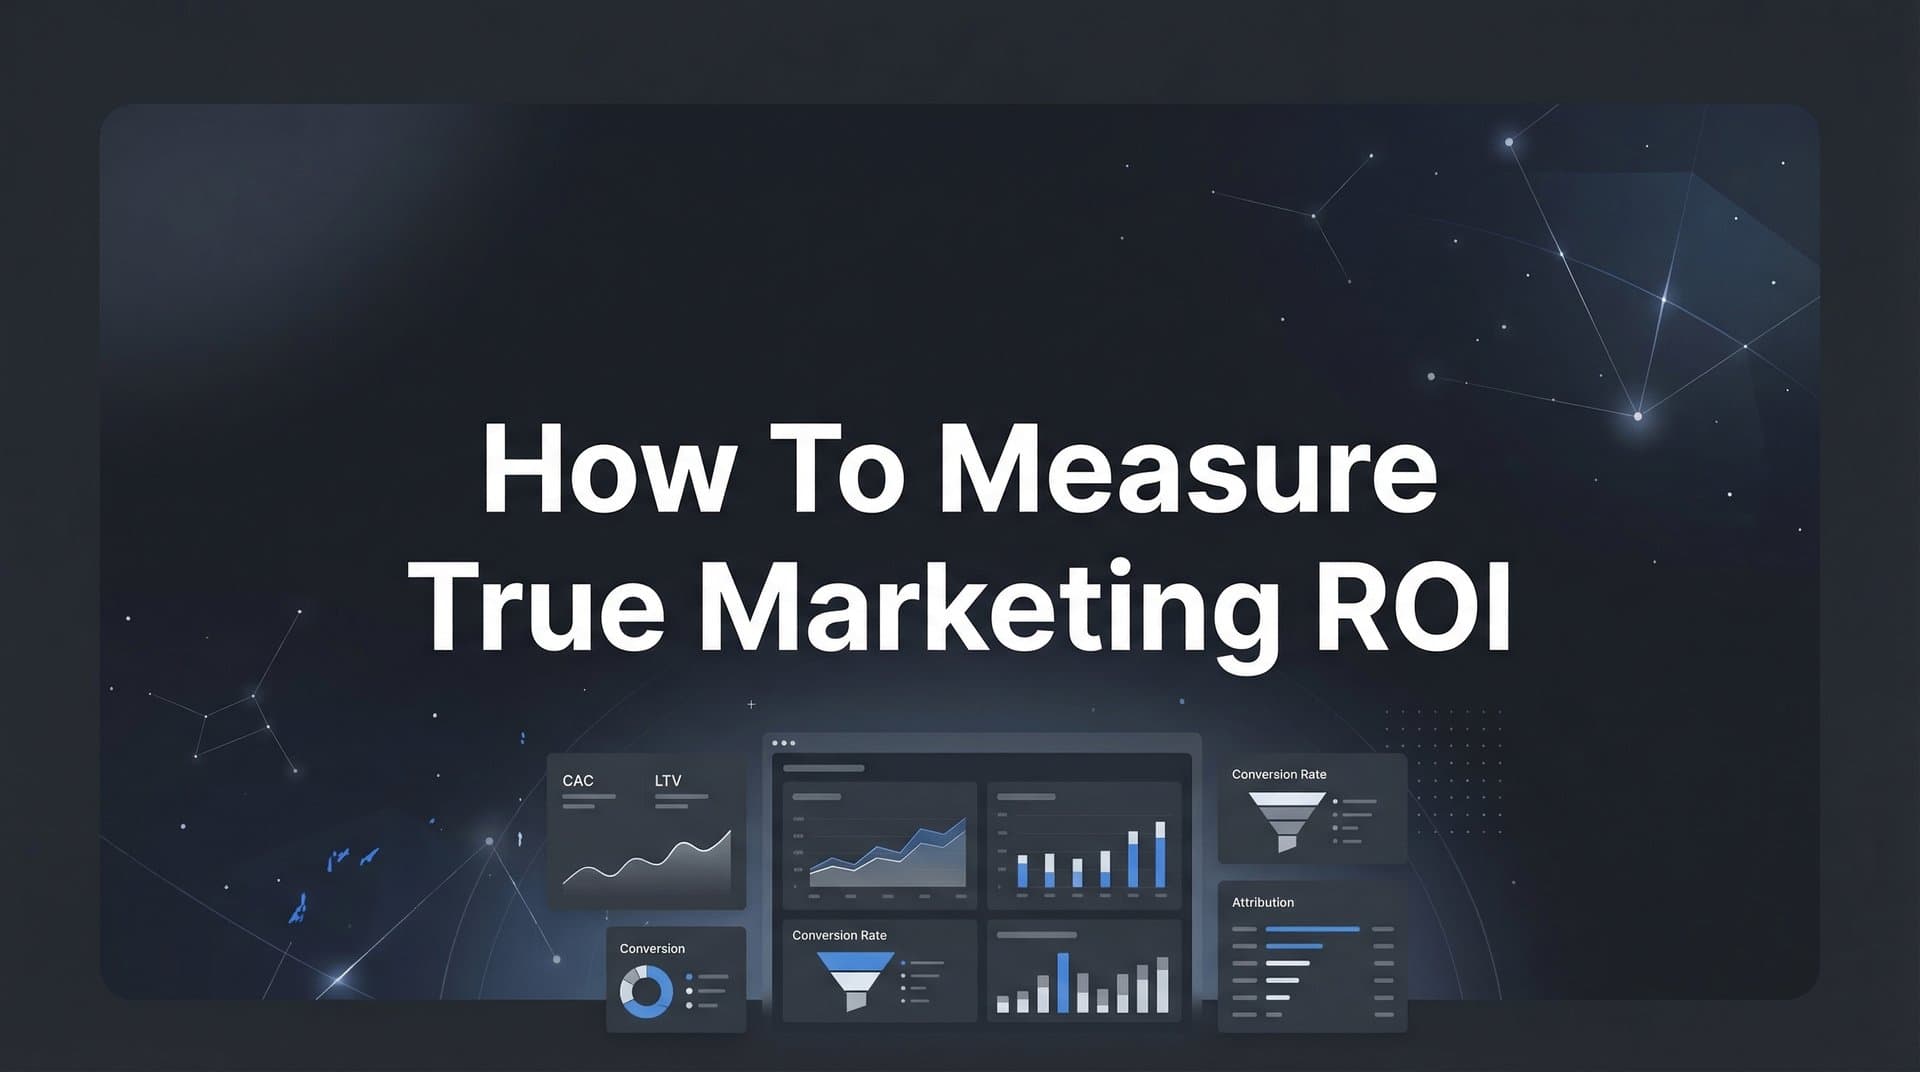
Most marketers know their ad spend, but few can confidently answer the question: "Which campaigns actually drive revenue?" The gap between vanity metrics and true marketing ROI costs businesses thousands in wasted ad spend every month.
Traditional platform reporting shows clicks and conversions, but it cannot tell you which touchpoints influenced a customer who saw your Facebook ad, clicked a Google search result, and finally converted through an email campaign. You see impressive click-through rates and platform-reported conversions, yet when you check your actual revenue numbers, the story looks completely different.
True marketing ROI measurement requires tracking the complete customer journey, connecting marketing activities to actual revenue, and understanding which channels deserve credit for each sale. Without this complete picture, you are essentially flying blind, making budget decisions based on incomplete data that may be leading you in the wrong direction.
This guide walks you through the exact process to set up accurate ROI tracking, from defining your revenue metrics to implementing multi-touch attribution. By the end, you will have a clear framework to measure what actually matters and make confident budget decisions based on real data.
Step 1: Define Your Revenue Metrics and Attribution Goals
Before you can measure ROI accurately, you need to define what "revenue" actually means for your business. This sounds simple, but different business models require different approaches to revenue measurement.
For e-commerce businesses, revenue might be the immediate purchase value. For SaaS companies, it could be the first month's subscription value, annual contract value, or projected lifetime value. For B2B companies with longer sales cycles, you might need to track both marketing qualified leads and closed deals separately to understand the full impact of your marketing efforts.
Start with these questions: What specific revenue event should your marketing be measured against? Is it the initial sale, the total contract value, or the predicted lifetime value of each customer? Your answer shapes everything that follows.
Next, establish clear attribution questions you need answered. The most common question marketers face is understanding the difference between channels that introduce customers to your brand versus channels that close the sale. A customer might discover you through a Facebook ad, research you through organic search, and finally convert through a retargeting campaign. Which channel deserves credit?
Document your current measurement gaps and pain points. Maybe you can track online conversions but lose visibility when customers call your sales team. Perhaps you know which ads get clicks but cannot connect those clicks to actual closed deals in your CRM. Write down every place where your tracking breaks or goes dark.
Establish baseline metrics to measure improvement against. Pull your current numbers for cost per acquisition, conversion rates by channel, and overall marketing ROI based on whatever tracking you have now. These baselines will help you quantify the improvement once you implement proper marketing attribution tracking.
Create a simple document that includes: Your revenue definition, the specific attribution questions you need answered, your current tracking gaps, and your baseline performance metrics. This document becomes your north star as you build out your measurement system.
The goal here is clarity. You cannot measure what you have not defined, and you cannot improve what you are not measuring consistently. Spend time getting this foundation right before moving to the technical implementation.
Step 2: Map Your Complete Customer Journey
Your customers rarely take a straight path from ad click to purchase. They bounce between channels, devices, and touchpoints before making a buying decision. To measure true ROI, you need to understand this complete journey.
Start by identifying all possible touchpoints from first ad impression to closed revenue. This includes paid advertising touchpoints like Facebook ads, Google search ads, display ads, and LinkedIn sponsored content. It also includes organic touchpoints like search engine results, social media posts, email campaigns, and direct website visits.
Document the typical path customers take across channels. Look at your existing data to find patterns. Do customers typically discover you through paid search and then return through direct traffic? Do they see multiple ad impressions before clicking? Do they visit your site multiple times before converting?
Many businesses find that their highest-value customers interact with five to seven touchpoints before making a purchase. Understanding this pattern helps you appreciate why single-touch attribution models miss so much of the story.
Note where tracking currently breaks down or loses visibility. Common blind spots include phone calls that originated from digital ads, in-store purchases influenced by online marketing, conversions that happen after customers switch devices, and sales that close through your sales team after marketing generated the initial lead.
Create a visual journey map showing online and offline touchpoints. You do not need fancy software for this. A simple spreadsheet or diagram that shows the typical customer journey from awareness to purchase will work perfectly. Include every touchpoint where a customer might interact with your marketing.
For each touchpoint, note what data you can currently capture and what data you are missing. If someone clicks your Google ad, can you track them all the way to a closed sale in your CRM? If they call your phone number after seeing a Facebook ad, does that conversion get attributed back to the ad that drove it?
Pay special attention to cross-device behavior. A customer might see your ad on their phone during their morning commute, research your product on their work computer during lunch, and finally make a purchase on their tablet at home. Traditional cookie-based tracking loses this customer across these device switches, making your attribution data incomplete. Learning how to measure cross-channel marketing performance becomes essential in these scenarios.
This mapping exercise reveals the gaps in your current tracking and shows you exactly where you need to improve data collection. Once you see the complete picture of how customers actually buy from you, the limitations of platform-reported metrics become obvious.
Step 3: Connect Your Marketing Platforms to Your CRM
Your CRM holds the truth about which marketing activities actually drive revenue. Your ad platforms hold detailed data about impressions, clicks, and platform-reported conversions. The key to accurate ROI measurement is connecting these two systems so you can see which marketing touchpoints led to actual closed deals.
Start by integrating your ad platforms with your revenue source of truth. This means connecting Meta Ads, Google Ads, LinkedIn Campaign Manager, and any other advertising platforms you use to your CRM system. Most modern CRMs offer native integrations or API connections that make this possible.
The goal is to create a data flow where marketing touchpoint data flows into your CRM and gets associated with the customer records that eventually convert into revenue. When a lead closes into a customer, you should be able to look back and see every marketing touchpoint that influenced that journey. Understanding how to connect all marketing data sources is fundamental to this process.
Set up proper UTM parameters and tracking codes across all campaigns. UTM parameters are the tags you add to your URLs that tell analytics tools where traffic came from. Create a consistent naming convention and apply it religiously across every campaign, ad set, and individual ad.
A solid UTM structure includes the source (facebook, google, linkedin), the medium (cpc, display, email), the campaign name, and optionally the content or ad variation. Consistency here is critical. If you use "Facebook" in some UTMs and "fb" in others, your reporting will be fragmented and unreliable. For a deeper dive, explore what UTM tracking is and how it can help your marketing.
Implement server-side tracking to capture data that browser-based tracking misses. iOS privacy changes and cookie restrictions have made browser-based tracking increasingly unreliable. Server-side tracking sends conversion data directly from your server to your analytics and attribution tools, bypassing browser limitations entirely.
This approach captures conversions that browser-based tracking would miss, like customers who have tracking prevention enabled, customers who convert on a different device than they clicked the ad on, and conversions that happen after cookies expire. For accurate attribution, server-side tracking has become essential rather than optional.
Verify data is flowing correctly between systems before proceeding. Run test campaigns and manually check that the data appears correctly in both your ad platforms and your CRM. Click your own ads, fill out forms, and make test purchases. Then verify that these actions show up with the correct attribution data in your CRM.
Look for common integration issues like missing UTM parameters, conversion events that fire multiple times, or data that takes too long to sync between systems. Fix these problems now before you start making budget decisions based on the data.
This technical foundation determines the accuracy of everything that follows. Invest the time to get your integrations right, implement server-side tracking, and verify data quality. Your future self will thank you when you are making confident budget decisions based on reliable data.
Step 4: Choose and Implement Your Attribution Model
Attribution models determine how credit for a conversion gets distributed across the various marketing touchpoints that influenced it. The model you choose dramatically affects which channels appear to drive the most value, so understanding the options is critical.
First-touch attribution gives all credit to the first touchpoint that introduced a customer to your brand. If someone clicked your Facebook ad, then later found you through Google search, and finally converted through an email campaign, first-touch attribution would give 100% credit to the Facebook ad. This model helps you understand which channels are best at generating awareness and bringing new prospects into your funnel.
Last-touch attribution does the opposite, giving all credit to the final touchpoint before conversion. Using the same example, last-touch would give 100% credit to the email campaign. This model shows you which channels are best at closing deals, but it completely ignores the journey that brought customers to that final touchpoint.
Multi-touch attribution distributes credit across all touchpoints in the customer journey. Different multi-touch models distribute credit differently. Linear attribution splits credit evenly across all touchpoints. Time-decay attribution gives more credit to touchpoints closer to the conversion. Position-based attribution gives more credit to the first and last touchpoints while distributing remaining credit to middle touchpoints. Understanding cross-channel attribution helps you see how these models impact your ROI calculations.
Select the model that matches your sales cycle length and buying process. For businesses with short sales cycles and simple customer journeys, last-touch attribution might provide sufficient insight. For businesses with longer sales cycles and multiple marketing channels, multi-touch attribution provides a more complete and accurate picture.
Companies with sales cycles longer than a few days typically benefit from multi-touch models because customers interact with multiple touchpoints before buying. If your customers typically see three to five marketing touchpoints before converting, a single-touch model will systematically undervalue most of your marketing channels.
Configure your attribution tool to credit touchpoints according to your chosen model. Most modern attribution platforms let you select from standard models or create custom models that match your specific business logic. Set up your primary model, but also configure alternative models for comparison.
Plan to compare multiple models to understand different perspectives on channel value. Look at your data through first-touch, last-touch, and at least one multi-touch model. The differences between these views reveal important insights about how your channels work together.
For example, you might discover that paid search gets significant credit in last-touch attribution but less credit in first-touch attribution. This tells you that paid search is effective at capturing demand and closing sales, but other channels are doing the heavy lifting of creating awareness and generating that demand in the first place.
Understanding these dynamics helps you make smarter budget allocation decisions. Instead of simply cutting budgets from channels that show low ROI in last-touch attribution, you can see which channels play important supporting roles earlier in the customer journey.
Step 5: Calculate True ROI for Each Channel and Campaign
With proper attribution in place, you can now calculate ROI based on actual attributed revenue rather than platform-reported conversions. This is where you finally get answers to the questions that matter most: which channels actually drive revenue, and which campaigns deserve more budget?
Pull attributed revenue data for each marketing channel from your attribution platform. This data shows how much revenue each channel influenced based on your chosen attribution model. Unlike platform-reported conversion values, this attributed revenue connects directly to actual closed deals in your CRM.
Apply the ROI formula: (Revenue Attributed minus Cost) divided by Cost, multiplied by 100. If you spent $10,000 on Facebook ads and your attribution platform shows those ads influenced $35,000 in revenue, your ROI calculation would be: ($35,000 minus $10,000) divided by $10,000, multiplied by 100, which equals 250% ROI.
This means for every dollar you spent on Facebook ads, you generated $2.50 in profit. That is the kind of clarity that drives confident budget decisions. For a detailed breakdown, see our guide on how to calculate true marketing ROI.
Account for customer acquisition cost and lifetime value in your calculations. If you sell subscriptions or have repeat customers, the immediate revenue from a first purchase tells only part of the story. Calculate the projected lifetime value of customers acquired through each channel to understand the true long-term ROI.
A channel might have a lower immediate ROI but acquire customers with higher lifetime value and better retention rates. Incorporating LTV into your ROI calculations prevents you from cutting budgets from channels that drive your most valuable customers.
Segment ROI by campaign, audience, and creative to find top performers. Do not stop at channel-level ROI. Drill down into specific campaigns within each channel. You might find that your Facebook ads overall show positive ROI, but one campaign is crushing it while another is barely breaking even.
Look at ROI by audience segment. Are your ads targeting previous website visitors generating better ROI than cold prospecting campaigns? Are certain demographic or interest-based audiences significantly more profitable than others?
Analyze ROI by creative type and messaging. Do video ads outperform static images? Do certain value propositions or offers drive better returns? This granular analysis helps you optimize not just which channels to invest in, but exactly how to deploy budget within those channels for maximum return.
Create a simple spreadsheet that lists each channel and major campaign with columns for spend, attributed revenue, and calculated ROI. Sort by ROI to instantly see your top performers and underperformers. This becomes your decision-making tool for budget allocation.
Update this analysis regularly as you gather more data. ROI is not static. Performance changes over time as markets shift, competition increases, and audience saturation occurs. Monthly ROI analysis helps you spot trends before they significantly impact results.
Step 6: Build Your ROI Dashboard and Reporting Cadence
Data is only valuable if you can access it easily and act on it quickly. A well-designed ROI dashboard transforms raw attribution data into actionable insights that drive better marketing decisions.
Create a centralized dashboard showing ROI by channel, campaign, and time period. This dashboard should answer your most important questions at a glance: which channels are profitable, which campaigns are working, and how performance is trending over time.
Include these essential metrics: total spend by channel, attributed revenue by channel, ROI percentage by channel, cost per acquisition, and customer lifetime value. Add trend lines that show how these metrics are changing week over week and month over month. Selecting the right marketing measurement tools makes building these dashboards significantly easier.
Set up automated reports for weekly and monthly performance reviews. Weekly reports help you catch performance changes quickly and make tactical adjustments. Monthly reports provide the bigger picture view needed for strategic budget allocation decisions.
Your weekly report might be a simple email that shows ROI by channel for the past seven days compared to the previous week. Your monthly report should be more comprehensive, including detailed campaign analysis, audience performance breakdowns, and strategic recommendations for the coming month.
Include trend data to spot performance changes before they impact results. A single week of declining ROI might be noise, but a three-week downward trend signals a real problem that needs attention. Trend data helps you distinguish between normal fluctuations and meaningful changes that require action.
Share insights with stakeholders in a format that drives action. Your CEO does not need to see every metric. They need to see total marketing spend, total attributed revenue, overall ROI, and how these numbers compare to last month and last quarter. Your marketing team needs the detailed campaign and audience breakdowns that inform optimization decisions. Learning how to prove marketing ROI to executives ensures your reports resonate with leadership.
Create different dashboard views for different audiences. Executive dashboards should be high-level and strategic. Operational dashboards for your marketing team should be detailed and tactical. Both are important, but they serve different purposes.
Schedule regular review meetings where you discuss dashboard insights and make decisions based on the data. A monthly marketing performance review where you analyze ROI trends, discuss what is working, and decide on budget adjustments turns your dashboard from a reporting tool into a decision-making system.
Build alerts for significant performance changes. If ROI for a major channel drops below a certain threshold, you want to know immediately rather than discovering it in next week's report. Automated alerts help you respond to problems quickly and capitalize on opportunities faster.
Moving Forward with Confidence
Measuring true marketing ROI is not a one-time project but an ongoing practice that improves over time. Start by defining what revenue means for your business, then systematically connect your marketing touchpoints to actual sales data. The marketers who win are those who move beyond platform-reported metrics and build systems that show the complete picture of what drives growth.
The difference between guessing and knowing which campaigns drive revenue is the difference between wasting budget and scaling profitably. When you can see which ads and channels actually generate revenue, budget decisions become clear. You stop throwing money at channels because they "feel" right and start investing based on data that shows real returns.
Quick Checklist:
Revenue metrics and attribution goals documented
Customer journey mapped with all touchpoints identified
Ad platforms connected to CRM with server-side tracking
Attribution model selected and configured
ROI calculated by channel and campaign
Dashboard built with automated reporting
The framework you have built gives you a sustainable competitive advantage. While your competitors make budget decisions based on incomplete platform data, you are making decisions based on the complete picture of what actually drives revenue. That clarity compounds over time as you continuously optimize toward real business outcomes rather than vanity metrics.
Ready to elevate your marketing game with precision and confidence? Discover how Cometly's AI-driven recommendations can transform your ad strategy. Get your free demo today and start capturing every touchpoint to maximize your conversions.