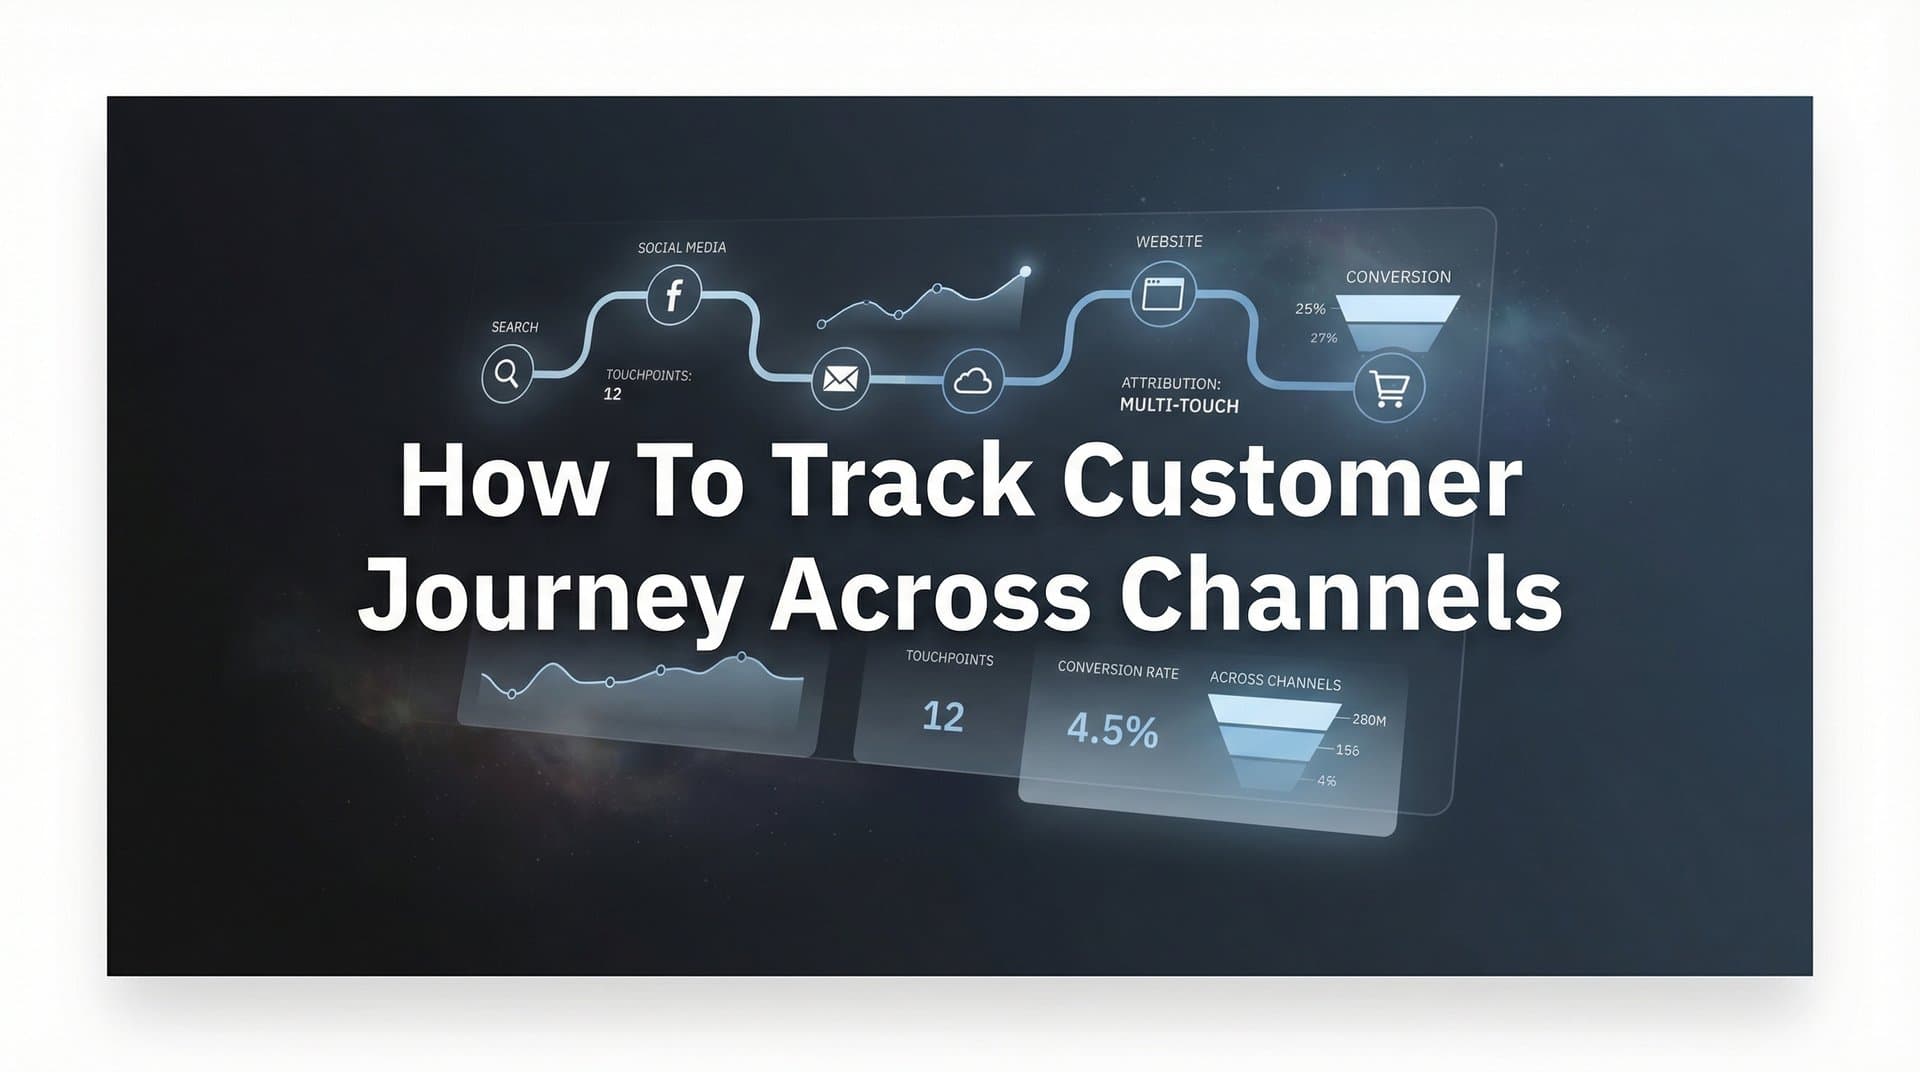
A customer clicks your Facebook ad on Monday morning. They visit your site but don't convert. Tuesday, they search your brand name on Google and read a blog post. Wednesday, they open your email newsletter. Thursday, they see a LinkedIn ad and finally book a demo. Which channel gets credit for that conversion?
If you're relying on default platform reporting, each ad platform claims the win. Facebook says it drove the conversion. Google says it did. LinkedIn takes credit too. You're left with overlapping attribution, inflated ROI reports, and no clear picture of what actually worked.
This fragmented view costs you real money. You might cut budget from channels that start customer journeys because they don't show last-click conversions. Or you might overspend on retargeting because it looks like your best performer, when it's really just capturing demand created elsewhere.
Modern customers interact with brands across multiple channels before converting. The average B2B buyer engages with your marketing at least seven times before making a purchase decision. For SaaS companies with longer sales cycles, that number climbs even higher. Each interaction plays a role in moving prospects closer to conversion, but without proper tracking, you only see isolated snapshots instead of the complete story.
Privacy changes have made this problem worse. iOS App Tracking Transparency, browser cookie restrictions, and ad blockers create gaps in your data. Traditional pixel-based tracking misses significant portions of user behavior, leaving you with incomplete customer journeys and unreliable attribution.
This guide walks you through building a complete cross-channel tracking system. You'll learn how to capture every touchpoint, connect interactions across platforms, and see which channels truly drive revenue. By the end, you'll have a unified view of customer journeys from first click to final purchase, enabling smarter budget decisions and better campaign optimization.
Whether you're running paid campaigns across Meta, Google, LinkedIn, or managing organic and email touchpoints, these steps will give you the visibility you need to understand what's really working.
Step 1: Map Your Current Marketing Channels and Touchpoints
Before you can track customer journeys, you need to know exactly what you're tracking. Start by creating a comprehensive inventory of every marketing channel and touchpoint where customers interact with your brand.
List all active paid advertising channels. This includes Meta ads, Google Ads, LinkedIn campaigns, TikTok, Twitter, YouTube, and any other platforms where you're spending money. Document not just the platforms, but the specific campaign types running on each. Are you running search ads, display campaigns, video ads, or shopping feeds? Each requires different tracking considerations.
Next, map your organic channels. Organic search traffic, social media posts, content marketing, referral sources, and direct traffic all play roles in customer journeys. Even if you're not paying for these channels, they influence conversions and deserve tracking attention.
Don't forget owned channels. Email marketing, SMS campaigns, push notifications, and in-app messages create touchpoints that move customers through your funnel. These often get overlooked in attribution systems, but they're critical for understanding the complete journey.
Now identify the conversion events that matter at each stage. Early-stage events might include blog post views, resource downloads, or webinar registrations. Mid-stage events could be demo requests, free trial signups, or product page visits. Late-stage events include purchases, subscription upgrades, or contract signings.
Document the typical paths you currently observe in your analytics. Look at your existing data to spot patterns. Do customers usually discover you through paid search and convert after email nurture? Do they start with organic content and later click retargeting ads? These patterns reveal which touchpoint combinations drive conversions.
Create a simple spreadsheet with three columns: Channel, Touchpoint Type, and Conversion Events. Fill it out systematically. This becomes your tracking blueprint, ensuring nothing gets missed when you implement your system. Understanding customer journey touchpoints is essential for building this foundation.
Pay special attention to touchpoints that happen off your website. Sales calls, demo presentations, trade show interactions, and offline events all influence buying decisions. While these are harder to track automatically, they need to be part of your journey map so you can manually attribute them later.
Success indicator: You have a complete list documenting every marketing channel, the specific touchpoints within each channel, and the conversion events you need to track. This list should include at least 10-15 distinct touchpoints across paid, organic, and owned channels.
Step 2: Implement Server-Side Tracking for Accurate Data Collection
Browser-based tracking is broken. iOS privacy changes, ad blockers, and cookie restrictions mean client-side pixels miss a significant portion of user behavior. If you're relying solely on Facebook Pixel or Google Tag Manager running in browsers, you're working with incomplete data.
Server-side tracking solves this problem by capturing events on your server before they reach the user's browser. When someone takes an action on your site, your server records it directly and sends that data to your analytics and attribution systems. This bypasses browser restrictions and gives you far more reliable data.
The technical setup varies by platform, but the concept remains consistent. Instead of loading tracking scripts in the user's browser, you configure your server to send event data via APIs. When a user submits a form, your server captures that submission and fires tracking events to Meta's Conversions API, Google's server-side tracking, and your attribution platform simultaneously.
Start by identifying which events you need to track server-side. High-value events like purchases, lead submissions, and account creations should always use server-side tracking. These conversions matter most for your business, so you can't afford to lose them to browser restrictions.
You'll need technical resources to implement this properly. If you have a development team, they can set up server-side tracking using Meta's Conversions API, Google's Measurement Protocol, or similar tools from other platforms. If you're not technical, look for attribution platforms that handle server-side tracking for you with minimal code changes. Learning how tracking pixels work helps you understand why server-side alternatives are necessary.
Configure your server to capture key user identifiers. Email addresses, phone numbers, and user IDs help match server-side events back to specific users. This identifier matching is crucial because it allows platforms to connect your server events with the ad clicks that initiated the journey.
Test your implementation thoroughly. Fire test events and verify they appear in your ad platform dashboards and attribution system. Compare server-side event volumes to your previous client-side tracking. You should see an increase in captured events, especially for iOS users and visitors using ad blockers.
Monitor event match quality scores in platforms like Meta. Higher match quality means your server events include enough user information to match them back to ad interactions. Poor match quality reduces the effectiveness of server-side tracking, so optimize your data collection to include as many user identifiers as possible.
Success indicator: Server-side events are firing correctly for your key conversion actions. You can see these events in your ad platform reporting, and your overall event capture rate has increased compared to client-side tracking alone. Match quality scores are above 70% in Meta's Events Manager.
Step 3: Connect Your Ad Platforms to a Unified Attribution System
Each ad platform reports data in its own silo. Meta claims credit for conversions. Google does the same. LinkedIn takes credit too. Without a unified system, you're left reconciling conflicting reports and guessing which numbers to trust.
A unified attribution system pulls data from all your ad platforms into one central dashboard. This gives you a single source of truth for campaign performance, spend, and conversions across every channel you're running.
Start by integrating your major ad platforms. Connect Meta Ads, Google Ads, LinkedIn Campaign Manager, TikTok Ads, and any other platforms where you're spending significant budget. Most attribution tools offer native integrations that sync data automatically via APIs, so you don't need to export and upload reports manually. This approach helps you track conversions across multiple ad platforms effectively.
Verify that UTM parameters are configured consistently across all campaigns. UTM tags are the tracking codes appended to your URLs that identify traffic sources. Use a standardized naming convention for utm_source, utm_medium, and utm_campaign across all platforms. Inconsistent tagging creates attribution gaps and makes it impossible to track journeys accurately.
Capture platform-specific click IDs whenever possible. Facebook's fbclid, Google's gclid, and LinkedIn's li_fat_id help attribution systems match ad clicks to conversions with high accuracy. Configure your landing pages to capture these parameters and pass them through your conversion funnel.
Ensure ad spend data syncs correctly. Your attribution system needs accurate spend numbers to calculate ROI and cost per acquisition. Most platforms allow API access to spend data, but verify that the numbers in your unified dashboard match what you see in each ad platform's native interface.
Set up proper conversion event mapping. The "Purchase" event in Meta needs to map to the same conversion in your attribution system as the "Conversion" event in Google Ads. Inconsistent event naming creates duplicate or missing conversions in your reports.
Test the full integration by running a small test campaign and tracking it end-to-end. Fire a conversion and verify it appears correctly in your unified dashboard with accurate source attribution, spend data, and conversion value.
Success indicator: All your ad platforms are reporting data in a single unified view. Spend numbers match native platform reporting, conversions are properly mapped across platforms, and you can see cross-channel performance without switching between multiple dashboards.
Step 4: Integrate Your CRM to Track Post-Click Journey Events
The customer journey doesn't end when someone fills out a form. For most businesses, especially in B2B and SaaS, the real value comes from what happens after the initial conversion. Leads get qualified, opportunities are created, deals close, and customers expand over time.
Connecting your CRM to your attribution system reveals which marketing touchpoints drive not just leads, but qualified leads and actual revenue. This connection transforms attribution from a top-of-funnel metric into a full-funnel revenue tracking system.
Start by mapping CRM stages to marketing events. When a lead moves from "New" to "Qualified," that's a trackable event. When an opportunity is created, that's another event. When a deal closes, that's your ultimate conversion event. Each stage transition represents progress through the customer journey and should be captured in your attribution system.
Set up bi-directional data sync between your CRM and attribution platform. Marketing data should flow into the CRM, enriching contact records with information about which ads, campaigns, and channels influenced each lead. Simultaneously, CRM data should flow back to your attribution system, showing which marketing touchpoints ultimately drove closed revenue. Understanding SaaS revenue attribution is particularly valuable for B2B companies implementing this approach.
Most modern CRMs offer API integrations that make this sync possible. Salesforce, HubSpot, Pipedrive, and other platforms can connect to attribution tools to share data automatically. Configure the integration to update in real time or near real time, so your attribution data stays current as deals progress.
Capture the full timeline of interactions. When a lead clicks an ad, visits your site, downloads a resource, receives nurture emails, and finally converts, all those touchpoints should be visible in both your CRM and attribution system. This timeline shows the complete journey from first touch to closed deal.
Pay special attention to revenue values. When a deal closes in your CRM, that revenue amount should appear in your attribution reporting. This allows you to calculate true ROI by comparing ad spend to actual revenue generated, not just lead volume.
Configure lead source tracking carefully. Many CRMs have a "Lead Source" field that captures where the lead originated. Ensure this field is populated accurately from your marketing data, so you can segment and analyze performance by original source even months after the initial conversion.
Success indicator: Marketing touchpoints are visible in your CRM contact records, showing the full journey history for each lead. Simultaneously, CRM events like opportunity creation and closed deals appear in your attribution reporting, allowing you to track marketing performance all the way to revenue.
Step 5: Configure Multi-Touch Attribution Models for Your Business
Not all touchpoints contribute equally to conversions. The first ad that introduces your brand plays a different role than the retargeting ad that closes the deal. Multi-touch attribution models help you distribute conversion credit across the customer journey in ways that reflect each touchpoint's actual contribution.
First-touch attribution gives all credit to the initial interaction. This model highlights which channels are best at generating awareness and starting customer journeys. It's useful for understanding top-of-funnel performance, but it ignores everything that happens after that first click.
Last-touch attribution does the opposite, crediting only the final interaction before conversion. This model shows which channels are best at closing deals, but it overlooks the awareness and consideration touchpoints that made that final conversion possible.
Linear attribution spreads credit evenly across all touchpoints in the journey. If a customer had five interactions before converting, each touchpoint gets 20% of the credit. This model acknowledges that multiple channels contributed, but it assumes all contributions were equal, which is rarely true.
Time-decay attribution gives more credit to recent interactions while still acknowledging earlier touchpoints. The logic is that touchpoints closer to conversion had more influence on the final decision. This model works well for businesses with longer sales cycles where recent engagement matters most.
Position-based attribution, also called U-shaped attribution, gives 40% credit to the first touch, 40% to the last touch, and distributes the remaining 20% among middle touchpoints. This model recognizes that both awareness and closing interactions are particularly important. For a deeper dive into these concepts, explore customer journey attribution methodologies.
Data-driven attribution uses machine learning to analyze your actual conversion patterns and assign credit based on statistical contribution. This is the most sophisticated approach, but it requires significant data volume to work effectively. Platforms with thousands of conversions can use data-driven models to uncover which touchpoints truly drive results.
Choose the model that aligns with your business reality. If you have a short sales cycle with few touchpoints, last-touch might suffice. If you run complex B2B campaigns with long consideration periods, position-based or data-driven models provide more accurate insights.
Compare multiple models side by side. Most attribution platforms let you view the same data through different attribution lenses. Look at how channel performance changes across models. If a channel performs well in first-touch but poorly in last-touch, it's great at awareness but weak at conversion. Use these insights to optimize channel strategy.
Success indicator: You've selected an attribution model that reflects your customer journey reality. You can compare how different models credit your channels, and you understand which touchpoints drive awareness versus which ones close deals.
Step 6: Set Up Conversion Sync to Improve Ad Platform Optimization
Ad platforms like Meta and Google use machine learning to optimize your campaigns. They analyze which users convert and find more people like them. But these algorithms only work well when they receive accurate conversion data. If your conversion tracking is incomplete due to iOS restrictions or cookie blocking, the algorithm optimizes based on partial information.
Conversion sync solves this problem by sending enriched conversion data back to ad platforms via server-side APIs. When someone converts on your site, you send that conversion event to Meta's Conversions API and Google's API with complete user information and accurate attribution. This gives ad algorithms better signals about which users actually convert.
Start by identifying which conversion events matter most for your business. Focus on high-value events like purchases, qualified lead submissions, demo bookings, or trial signups. These are the conversions you want ad platforms to optimize toward, so they need the most accurate data. Implementing proper tracking conversions across multiple channels ensures your data remains consistent.
Configure your conversion sync to include as much user information as possible. Email addresses, phone numbers, IP addresses, and user agent data help platforms match conversions back to ad interactions. The more matching parameters you include, the better the match rate and the more effective the optimization becomes.
Send conversion value data when applicable. If you're running e-commerce, send the actual purchase amount. If you're in B2B, send the potential deal value or customer lifetime value. Value-based optimization allows platforms to find users who generate higher revenue, not just higher conversion volume.
Monitor the impact on campaign performance over time. Conversion sync doesn't produce instant results. Ad algorithms need time to learn from the improved data and adjust targeting accordingly. Over weeks and months, you should see improvements in cost per acquisition and conversion quality as platforms optimize based on more complete information.
Use event deduplication to avoid double-counting conversions. When you implement server-side conversion sync alongside browser pixels, configure deduplication so platforms don't count the same conversion twice. Most platforms offer event ID parameters that help identify and merge duplicate events.
Success indicator: Ad platforms are receiving accurate conversion data via server-side APIs. Match rates are high, event volumes have increased compared to pixel-only tracking, and you're seeing improved campaign performance as algorithms optimize based on better data.
Step 7: Build Dashboards to Visualize Complete Customer Journeys
Data without visualization is just noise. The final step is building dashboards that transform your tracking infrastructure into actionable insights. You need reports that show complete customer journeys, reveal which channels drive revenue, and highlight optimization opportunities.
Start with a journey path report that shows the sequence of touchpoints leading to conversions. This visualization reveals common patterns. You might discover that customers who engage with three or more touchpoints convert at twice the rate of single-touch visitors. Or you might find that email touchpoints significantly increase conversion likelihood when combined with paid ads.
Create channel performance comparisons using your chosen attribution model. Show each channel's contribution to conversions, revenue generated, cost per acquisition, and ROI. This single-view comparison makes it obvious which channels deserve more budget and which need optimization or cuts. Learning how to optimize ad spend across multiple channels becomes much easier with proper visualization.
Build conversion funnel reports that show drop-off points across the customer journey. Where do prospects abandon the journey? Which touchpoints have the highest fall-off rates? These insights reveal friction points that need fixing.
Set up cohort analysis to track how customer behavior changes over time. Compare conversion rates, journey lengths, and channel mix across different time periods. Are recent customers taking longer to convert? Are certain channels performing better or worse than they did last quarter?
Configure automated alerts for anomalies in your tracking or performance. If conversion volume suddenly drops, you need to know immediately. If a channel's cost per acquisition spikes, that requires investigation. Automated monitoring ensures you catch problems before they waste significant budget.
Create executive summaries that distill complex attribution data into simple insights. Not everyone needs to see the full customer journey details. Build high-level reports showing total conversions, revenue attributed to marketing, overall ROI, and top-performing channels for stakeholders who need quick insights. Leveraging customer journey analytics helps you create these meaningful reports.
Make your dashboards accessible to everyone who needs them. Marketing teams should see campaign-level details. Sales teams benefit from seeing which marketing touchpoints influenced their leads. Executives need high-level ROI metrics. Configure permissions and views so each team sees the data most relevant to their decisions.
Success indicator: Your dashboards clearly show complete customer journeys from first touch to conversion. You can instantly see which channels and campaigns drive real revenue, and you've configured alerts that notify you of tracking issues or performance changes.
Putting It All Together: Your Cross-Channel Tracking Checklist
You now have the blueprint for end-to-end customer journey tracking. When implemented correctly, this system reveals the complete story of how customers discover, consider, and convert across all your marketing channels.
Quick implementation checklist: All marketing channels and touchpoints are mapped and documented. Server-side tracking is capturing events that browser pixels miss. Ad platforms are integrated into a unified attribution system with accurate spend and conversion data. Your CRM is connected with bi-directional sync showing marketing touchpoints in contact records and revenue data in attribution reports. Attribution models are configured to match your business reality. Conversion sync is feeding enriched data back to ad platforms to improve optimization. Dashboards are visualizing complete customer journeys and revealing which channels truly drive revenue.
The real power comes from acting on these insights. When you discover that customers who engage with email after clicking an ad convert at three times the rate of ad-only visitors, you can build campaigns that drive email engagement. When you see that a channel you considered cutting actually starts 60% of your converting journeys, you can invest with confidence instead of making budget cuts that hurt performance.
Cross-channel attribution isn't just about tracking. It's about understanding which marketing investments actually drive growth so you can make smarter decisions with your budget. Instead of spreading spend across channels based on assumptions or last-click data, you can allocate budget based on each channel's true contribution to revenue.
Start with Step 1 today. Map your channels and touchpoints this week. Implement server-side tracking next week. Work through each step systematically, and within a month, you'll have complete visibility into customer journeys that drive better marketing decisions.
The businesses that win in marketing aren't necessarily the ones with the biggest budgets. They're the ones with the clearest understanding of what's working. When you can see the complete customer journey, you can optimize every touchpoint, eliminate wasted spend, and scale the channels that truly drive growth.
Ready to elevate your marketing game with precision and confidence? Discover how Cometly's AI-driven recommendations can transform your ad strategy. Get your free demo today and start capturing every touchpoint to maximize your conversions.