Marketing analytics isn't about collecting data—it's about making better decisions faster than your competitors. While most marketing teams drown in dashboards showing vanity metrics, the teams winning market share are using analytics to predict customer behavior, optimize campaigns in real-time, and prove ROI down to the individual touchpoint.
The difference between good marketing and great marketing is measurement. Without analytics, you're guessing. With analytics, you're testing, learning, and scaling what works while cutting what doesn't.
This guide breaks down everything you need to know about modern marketing analytics: what it actually measures, how to build a system that drives decisions instead of just reports, and the specific tools that turn raw data into competitive advantage.
What Marketing Analytics Actually Measures (And Why It Matters)
Marketing analytics is the practice of measuring, managing, and analyzing marketing performance to maximize effectiveness and optimize return on investment. But that textbook definition misses the point entirely.
Real marketing analytics answers three questions that determine whether your marketing budget grows or shrinks: Which campaigns are actually profitable? Which customer acquisition channels deliver the highest lifetime value? And where should you invest your next dollar for maximum return?
The core components of marketing analytics break down into five categories:
Performance Metrics: These are your scoreboard numbers. Revenue generated, cost per acquisition, return on ad spend, conversion rates, and customer lifetime value. Performance metrics tell you if you're winning or losing, but they don't tell you why or what to do about it.
Attribution Data: This is where most marketing teams fail. Attribution connects customer actions back to the marketing touchpoints that influenced them. Did that customer convert because of your Facebook ad, your email campaign, or your retargeting sequence? Without proper attribution, you're optimizing in the dark.
Customer Journey Analytics: Customers don't convert in a straight line. They research, compare, abandon carts, come back weeks later, and interact with multiple touchpoints before buying. Journey analytics maps these paths so you can identify patterns, remove friction points, and optimize the entire experience instead of individual channels.
Behavioral Data: What are people actually doing on your website, in your emails, and with your content? Behavioral analytics tracks engagement patterns, content consumption, feature usage, and interaction sequences that predict conversion likelihood and customer value.
Predictive Indicators: The most valuable analytics don't just report what happened—they forecast what's coming. Lead scoring models that predict conversion probability. Churn risk scores that identify customers likely to cancel. Lifetime value predictions that tell you how much to spend acquiring different customer segments.
The marketing teams that dominate their industries aren't just tracking these metrics—they're connecting them into a unified system that shows exactly how marketing investment translates into business outcomes.
From Data Collection to Strategic Insight
Here's where most marketing teams get stuck: they collect mountains of data but can't turn it into decisions. The difference between data collection and strategic insight is the difference between a thermometer and a thermostat—one tells you the temperature, the other changes it.
Traditional marketing analytics meant tracking surface-level activity. Website visitors. Email open rates. Ad impressions. These descriptive metrics documented what happened, but they couldn't tell you why it happened or what to do about it.
Modern marketing analytics has evolved far beyond simple scorekeeping. It's about connecting customer behavior patterns to business outcomes and predicting future performance before you spend the budget.
Think of analytics maturity as a ladder with four distinct rungs:
Descriptive Analytics: What happened? This is where most teams start. You're tracking traffic, clicks, impressions, and conversions. Your dashboard shows numbers going up or down. You know your cost per click increased 15% last month, but you don't know why or what to do about it.
Diagnostic Analytics: Why did it happen? This is where you start investigating patterns. You're using attribution models to understand which touchpoints influenced conversions. You're analyzing customer journey data to identify where prospects drop off. You're comparing audience segments to understand what makes high-value customers different from low-value ones.
Predictive Analytics: What will happen? Now you're forecasting future performance based on historical patterns. You can predict which prospects are most likely to convert, which customers are at risk of churning, and which campaigns will deliver the best ROI before you scale them. Teams reaching the predictive marketing analytics stage can forecast campaign performance and customer lifetime value before spending budget, creating significant competitive advantage.
Prescriptive Analytics: What should we do? This is the holy grail. Your analytics system doesn't just predict outcomes—it recommends specific actions. It tells you to shift 20% of your budget from Facebook to Google because the data shows Google drives higher lifetime value customers. It suggests which creative variations to test next based on performance patterns across similar campaigns.
The gap between descriptive and prescriptive analytics is where competitive advantage lives. Most companies are stuck at the "what happened" stage. The companies winning their markets have climbed to "what should we do."
Building Your Marketing Analytics Stack
Your analytics stack is the technology infrastructure that collects, processes, and visualizes marketing data. A poorly designed stack creates data silos, reporting delays, and decision paralysis. A well-designed stack delivers real-time insights that drive immediate action.
The foundation of any analytics stack is your data collection layer. This includes tracking pixels, SDKs, and integrations that capture customer interactions across every touchpoint. Website behavior, ad clicks, email engagement, CRM activities, and purchase transactions all need to flow into a central system.
Most marketing teams make a critical mistake here: they use platform-native analytics (Facebook Ads Manager, Google Analytics, email platform reports) as their source of truth. The problem? Each platform uses different attribution models, tracking windows, and conversion definitions. Your Facebook dashboard will show different conversion numbers than your Google Analytics, which shows different numbers than your CRM.
The solution is a unified tracking system that captures first-party data before it hits individual platforms. This gives you a single source of truth that reconciles discrepancies and shows the complete customer journey across all channels.
Your data warehouse is where all this information lives. Modern marketing teams use cloud data warehouses like Snowflake, BigQuery, or Redshift to store raw event data, customer profiles, and transaction records. This creates a permanent, queryable record of every marketing interaction.
The transformation layer sits between raw data and reporting. This is where you clean data, apply attribution models, calculate custom metrics, and create the aggregated tables that power your dashboards. Tools like dbt (data build tool) have become standard for managing these transformations in code.
Your visualization layer is what most people think of as "analytics"—the dashboards and reports that display insights. But here's the key: your dashboards should be decision interfaces, not just data displays. Every chart should answer a specific question that leads to a specific action.
The most sophisticated marketing teams add a reverse ETL layer that pushes insights back into operational systems. When your analytics identifies a high-value prospect, that information flows back to your CRM so sales can prioritize outreach. When a customer shows churn risk signals, your marketing automation system triggers a retention campaign.
Building this stack used to require a team of data engineers. Modern marketing analytics software platforms now provide pre-built integrations, automated data pipelines, and ready-to-use attribution models that compress months of engineering work into hours of configuration.
The Attribution Problem (And How to Solve It)
Attribution is the single biggest challenge in marketing analytics, and most companies are doing it wrong. The question seems simple: which marketing touchpoints deserve credit for a conversion? The answer determines where you invest your budget, which campaigns you scale, and which channels you cut.
The default attribution model in most platforms is last-click attribution. The last thing a customer clicked before converting gets 100% of the credit. This systematically undervalues awareness and consideration channels while overvaluing bottom-funnel tactics.
Imagine a customer who sees your Facebook ad, clicks through to read a blog post, signs up for your email list, receives a nurture sequence over two weeks, clicks a retargeting ad, and finally converts. Last-click attribution gives 100% credit to that retargeting ad and zero credit to everything else. You'd conclude that retargeting is your most profitable channel and scale it aggressively—while cutting the Facebook and email campaigns that actually drove the conversion.
First-click attribution makes the opposite mistake, giving all credit to the first touchpoint. Multi-touch attribution attempts to solve this by distributing credit across multiple touchpoints, but the question becomes: how do you distribute it fairly?
Linear attribution gives equal credit to every touchpoint. Time-decay attribution gives more credit to recent touchpoints. Position-based attribution (also called U-shaped) gives more credit to the first and last touchpoints. Each model tells a different story about which channels are working.
The most accurate approach is data-driven attribution, which uses machine learning to analyze thousands of conversion paths and determine which touchpoints actually influence outcomes. Instead of applying arbitrary rules about credit distribution, data-driven models calculate the incremental impact of each touchpoint based on how conversion rates change when that touchpoint is present versus absent.
But here's what most attribution guides won't tell you: attribution models don't matter if your tracking is broken. Before you worry about sophisticated attribution algorithms, you need to solve the fundamental tracking challenges that plague most marketing teams.
The iOS 14 update and increasing privacy restrictions have created massive blind spots in marketing attribution. When users opt out of tracking, platforms like Facebook marketing analytics lose visibility into conversion events. This creates a gap between the conversions you can see in your analytics and the conversions actually happening.
Server-side tracking solves this by capturing conversion events on your server before they're affected by browser restrictions or ad blockers. Instead of relying on pixels and cookies that users can block, you send conversion data directly from your server to advertising platforms. This recovers the attribution accuracy that privacy changes have eroded.
The most sophisticated marketing teams now use hybrid attribution that combines multiple data sources: platform attribution data, server-side conversion tracking, CRM data, and incrementality testing. This creates a more complete picture than any single attribution model can provide.
Reporting That Drives Decisions Instead of Confusion
Most marketing reports are useless. They're filled with vanity metrics, lack context, and don't connect to business outcomes. The result? Reports that take hours to create but minutes to ignore.
Effective marketing reporting starts with clarity about what decisions the report needs to inform. Are you deciding whether to increase budget on a campaign? You need profitability metrics and trend analysis. Are you optimizing landing page conversion rates? You need funnel analytics and segment comparisons. Are you planning next quarter's channel mix? You need attribution data and customer lifetime value by source.
Every report should answer three questions: What happened? Why did it happen? What should we do about it? Most reports stop after the first question. The best reports make the third question obvious.
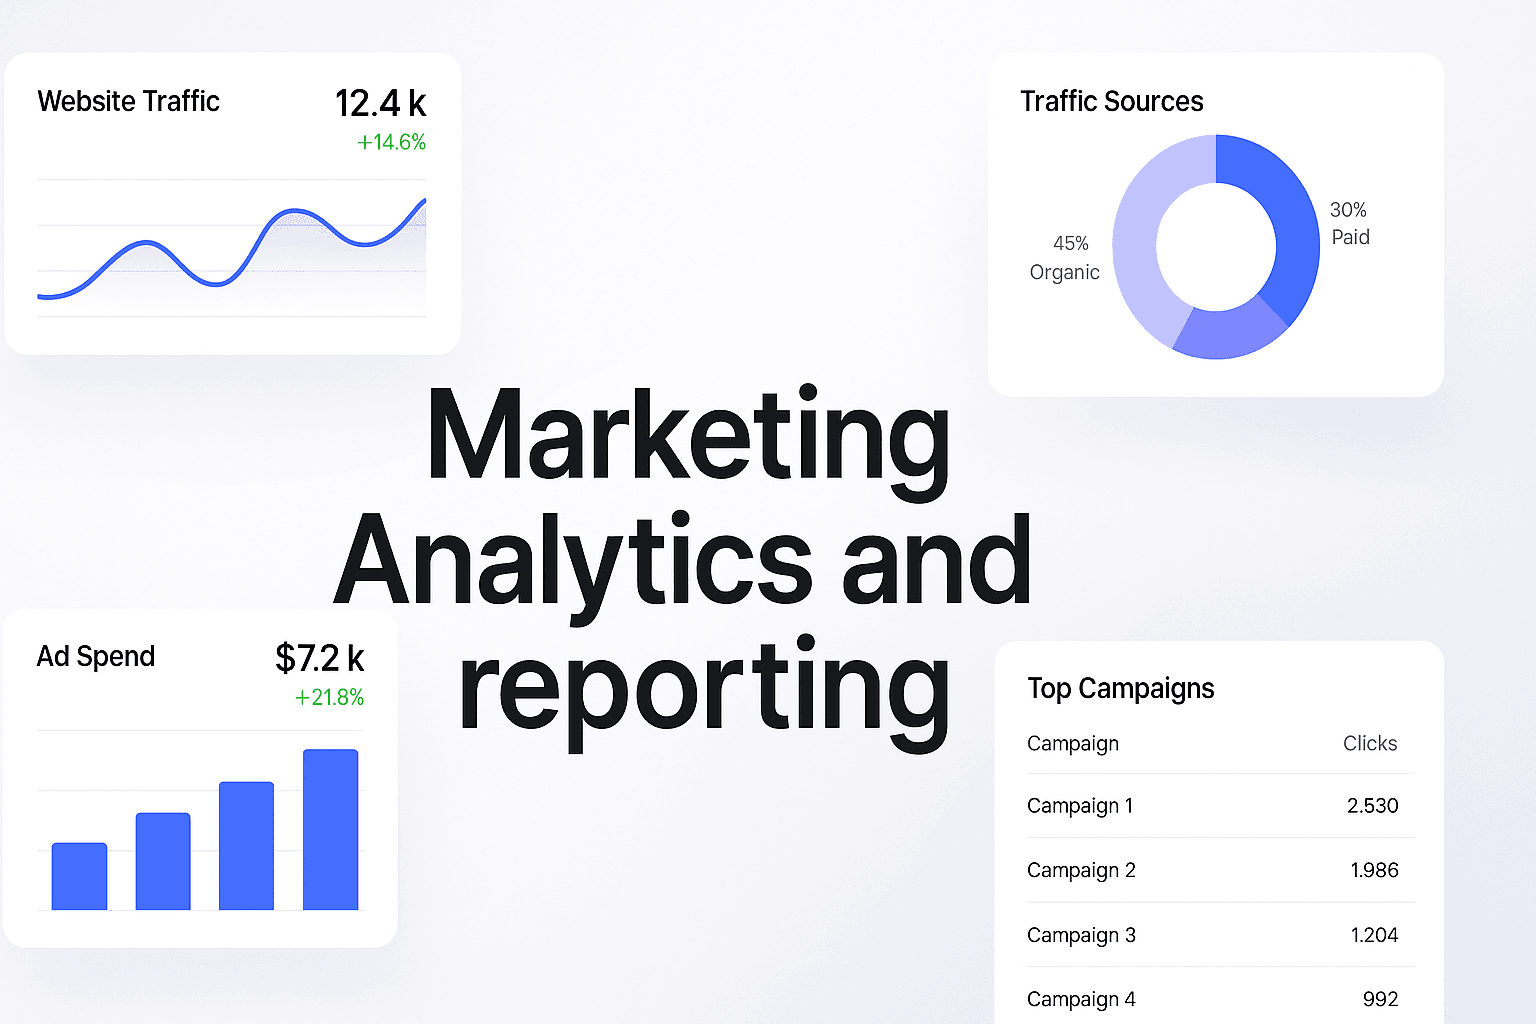
The structure of effective marketing reports follows a consistent hierarchy. Executive summaries highlight the three most important insights and their business impact. Performance overviews show key metrics with context (comparison to goals, previous periods, and benchmarks). Deep dives analyze specific channels, campaigns, or customer segments. Action items specify what changes to make based on the data.
Visualization matters more than most marketers realize. A well-designed chart communicates insights instantly. A poorly designed chart requires explanation and creates confusion. Use line charts for trends over time, bar charts for comparisons between categories, and scatter plots for relationships between variables. Avoid pie charts (humans are bad at comparing angles) and 3D effects (they distort perception without adding information).
The frequency of reporting should match the speed of decision-making. Real-time dashboards for metrics that require daily optimization (ad performance, website conversion rates). Weekly reports for tactical campaign management. Monthly reports for strategic planning and budget allocation. Quarterly reports for executive review and goal setting.
Automated reporting saves time but creates a new problem: report fatigue. When dashboards update automatically, people stop looking at them. The solution is alert-based reporting that notifies stakeholders only when metrics cross important thresholds or show unusual patterns. Your analytics system should be proactive, not passive.
The most valuable reports aren't the ones with the most data—they're the ones that change behavior. If your reports don't lead to different decisions and actions, they're just documentation theater.
Advanced Analytics Capabilities That Separate Leaders from Followers
Basic marketing analytics tells you what happened. Advanced marketing analytics tells you what to do next. The gap between these two capabilities is where market leaders separate from everyone else.
Cohort analysis is one of the most powerful but underutilized analytics techniques. Instead of looking at all customers as a single group, cohort analysis groups customers by when they were acquired and tracks how each cohort behaves over time. This reveals whether your customer quality is improving or declining, how retention rates change across cohorts, and whether recent product or marketing changes are having the intended effect.
Customer lifetime value (LTV) prediction transforms how you think about acquisition costs. Instead of optimizing for lowest cost per acquisition, you optimize for highest lifetime value. This often means spending more to acquire customers from channels that deliver higher-quality users, even if the initial conversion cost is higher.
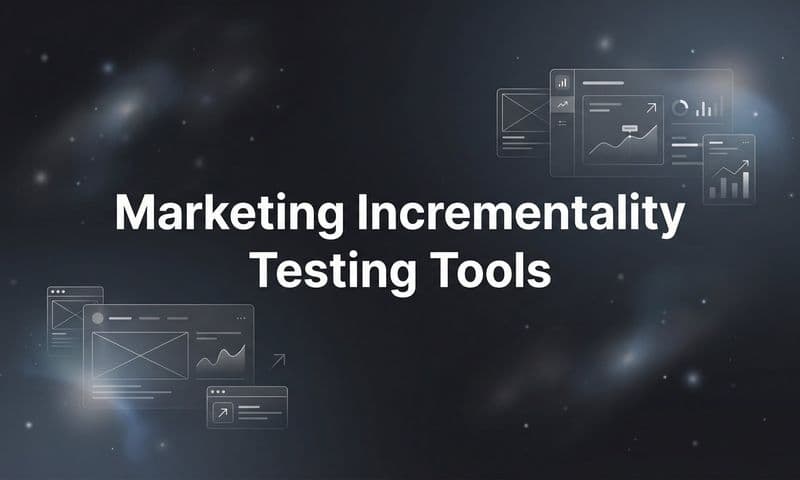
Incrementality testing answers the question that attribution models can't: what would have happened without this marketing activity? Some conversions would have happened anyway—these customers were already going to buy. Incrementality testing uses holdout groups and geo-experiments to measure the true causal impact of marketing spend, not just correlation.
Marketing mix modeling (MMM) takes a top-down approach to attribution by analyzing how changes in marketing spend across channels correlate with changes in overall sales. While digital attribution tracks individual customer journeys, MMM captures the impact of brand advertising, offline channels, and external factors like seasonality and competitive activity.
Real-time personalization uses analytics to adapt marketing messages and experiences based on customer behavior. When a visitor shows high purchase intent signals, they see different content than someone in early research mode. When a customer's behavior suggests churn risk, they receive targeted retention offers. This requires analytics infrastructure that can score customers and trigger actions in milliseconds, not hours.
Predictive lead scoring ranks prospects by conversion probability before sales contacts them. Instead of working leads in chronological order or based on simple demographic criteria, sales teams prioritize the prospects most likely to close. This can double or triple sales productivity by focusing effort where it matters most.
The common thread across all these advanced capabilities is that they're predictive and prescriptive rather than descriptive. They don't just report what happened—they forecast what will happen and recommend what to do about it.
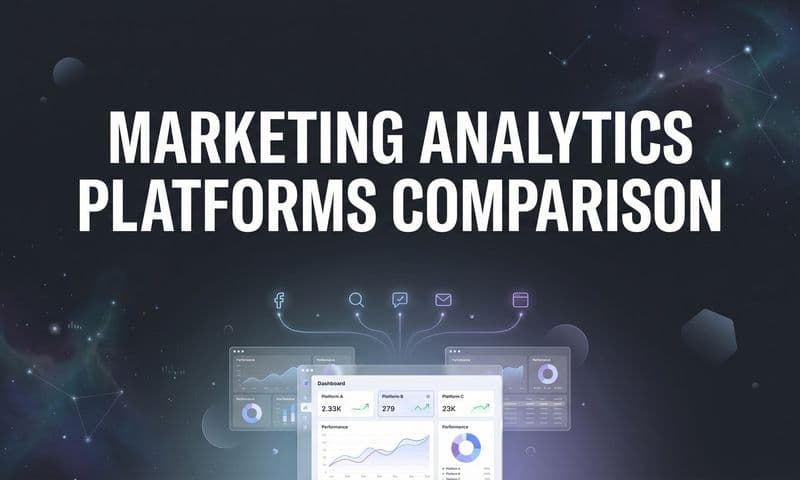
Choosing the Right Analytics Tools for Your Needs
The marketing analytics tools landscape is overwhelming. Hundreds of platforms promise to solve your analytics challenges, but most marketing teams end up with a fragmented stack that creates more problems than it solves.
Your analytics tool selection should start with your specific use cases, not feature lists. Are you primarily focused on paid advertising attribution? Customer journey analytics? Marketing automation reporting? Multi-channel campaign analysis? Different tools excel at different use cases.
Google Analytics is the default choice for website analytics, but it has significant limitations for marketing attribution. It uses last-click attribution by default, has limited cross-device tracking, and struggles with long conversion cycles. GA4 (the newest version) improved some of these issues but introduced new complexity that many teams find overwhelming.
Dedicated attribution platforms like Cometly, HockeyStack, and Hyros focus specifically on solving multi-touch attribution and connecting marketing spend to revenue. These platforms typically offer server-side tracking, custom attribution models, and deeper integration with advertising platforms than general analytics tools.
Business intelligence platforms like Tableau, Looker, and Power BI excel at creating custom dashboards and reports from multiple data sources. They're powerful for teams with data warehouses who need flexible visualization capabilities, but they require more technical expertise to set up and maintain.
All-in-one marketing platforms like HubSpot and Salesforce Marketing Cloud include built-in analytics, but these are typically limited to activities within their own ecosystem. They work well for teams using a single platform for most marketing activities but create blind spots for multi-channel campaigns.
The most effective analytics stacks combine specialized tools for different use cases. A typical setup might include: a dedicated attribution platform for tracking marketing performance, a data warehouse for storing raw data, a business intelligence tool for custom reporting, and platform-native analytics for tactical optimization within individual channels.
When evaluating tools for marketing analytics, prioritize integration capabilities over feature lists. The best tool with poor integrations creates data silos. A simpler tool that connects everything is more valuable than a sophisticated tool that operates in isolation.
Consider the technical resources required for implementation and maintenance. Some platforms require data engineering teams to set up and manage. Others offer no-code configuration that marketing teams can handle themselves. Match the tool complexity to your team's capabilities.
Finally, evaluate the vendor's approach to privacy and data governance. With increasing regulations like GDPR and CCPA, your analytics tools need to support compliant data collection, storage, and processing. This includes features like consent management, data retention controls, and the ability to delete user data on request.
Common Analytics Mistakes That Waste Budget and Mislead Strategy
Even sophisticated marketing teams make analytics mistakes that lead to bad decisions and wasted budget. Understanding these common pitfalls helps you avoid them.
The biggest mistake is optimizing for the wrong metrics. Vanity metrics like traffic, impressions, and social media followers feel good but don't connect to business outcomes. Teams that optimize for these metrics often increase activity while decreasing profitability. Focus on metrics that directly tie to revenue: customer acquisition cost, lifetime value, return on ad spend, and contribution margin.
Ignoring statistical significance leads to false conclusions. When you run an A/B test and see a 5% improvement with only 100 conversions, that difference could easily be random chance. Most marketing platforms don't calculate statistical significance automatically, so teams make decisions based on noise rather than signal. Use a sample size calculator before launching tests and wait for statistical significance before declaring winners.
Attribution window selection dramatically affects which channels appear profitable. A 7-day attribution window will undervalue channels with longer consideration cycles. A 90-day window might give credit to touchpoints that had minimal influence. There's no perfect answer, but you need to understand how your attribution window choice affects your analysis and adjust it based on your typical sales cycle length.
Correlation versus causation confusion is analytics 101, but marketing teams still fall into this trap constantly. Just because high-value customers engage with your email newsletter doesn't mean the newsletter creates high-value customers—it might just be that high-value customers are more engaged overall. Use incrementality testing and controlled experiments to establish causation, not just correlation.
Data quality issues undermine even the most sophisticated analytics. Broken tracking, duplicate records, incorrect tagging, and inconsistent naming conventions create garbage data that leads to garbage insights. Invest in data quality monitoring and regular audits to catch issues before they corrupt your analysis.
Analysis paralysis happens when teams have so much data that they can't make decisions. Every question leads to three more questions. Every report generates requests for deeper dives. The solution is to establish clear decision frameworks that specify what data is needed for each type of decision and what threshold triggers action.
Recency bias causes teams to overreact to short-term fluctuations while missing long-term trends. A bad week doesn't mean your strategy is broken. A good month doesn't mean you've solved everything. Use appropriate time windows for analysis and look for sustained patterns rather than reacting to every spike or dip.
The most expensive mistake is not connecting analytics to action. Teams spend thousands of hours building dashboards and running reports, but if those insights don't change what you do, they're worthless. Every analytics initiative should have a clear path from insight to action to outcome.
The Future of Marketing Analytics: AI, Privacy, and Predictive Intelligence
Marketing analytics is evolving faster than most teams can keep up. Three major trends are reshaping how marketing performance gets measured and optimized.
Artificial intelligence is moving from buzzword to practical reality in marketing analytics. AI-powered analytics platforms can now identify patterns humans would miss, predict customer behavior with increasing accuracy, and automatically optimize campaigns based on performance data. The most impactful applications aren't replacing human decision-making—they're augmenting it by surfacing insights and recommendations that humans can act on.
Predictive analytics is becoming table stakes rather than advanced capability. The question is no longer whether you can predict customer lifetime value or conversion probability, but how accurately you can predict it and how quickly you can act on those predictions. Machine learning models trained on your historical data can forecast campaign performance, identify customers at risk of churning, and recommend optimal budget allocation across channels.
Privacy regulations and browser changes are forcing a fundamental shift in how marketing analytics works. Third-party cookies are disappearing. Device tracking is becoming restricted. Platform attribution is becoming less accurate. The solution is a return to first-party data: information you collect directly from customers through your own properties and systems.
Server-side tracking is becoming essential rather than optional. By capturing conversion events on your server before they're affected by browser restrictions, you maintain attribution accuracy even as privacy protections increase. This requires more technical implementation than pixel-based tracking, but it's becoming the only reliable way to measure marketing performance.
Unified customer data platforms (CDPs) are consolidating the fragmented data scattered across marketing tools, CRM systems, and data warehouses. A CDP creates a single customer profile that combines behavioral data, transaction history, and engagement across all channels. This unified view enables more accurate attribution, better personalization, and deeper customer insights.
Real-time analytics is replacing batch reporting. Instead of waiting until tomorrow to see yesterday's performance, marketing teams are optimizing campaigns based on data from the last hour. This requires infrastructure that can process and analyze data streams in real-time, but the competitive advantage of faster optimization cycles is significant.
The integration of marketing analytics with business intelligence is blurring the line between marketing metrics and business metrics. CMOs are increasingly accountable for revenue, not just leads or traffic. This requires analytics that connect marketing activities to financial outcomes: customer acquisition cost versus lifetime value, marketing contribution to revenue, and return on marketing investment calculated the same way as other business investments.
The marketing teams that thrive in this evolving landscape will be those that invest in analytics infrastructure now, build capabilities in predictive modeling and AI, and create organizational processes that turn insights into action quickly.
Building an Analytics-Driven Marketing Organization
Technology and tools are necessary but not sufficient for analytics success. The hardest part of marketing analytics isn't technical—it's organizational. How do you build a culture where decisions are driven by data rather than opinions, intuition, or whoever speaks loudest in meetings?
It starts with executive commitment. When leadership consistently asks "what does the data say?" before making decisions, the entire organization follows. When executives make gut-feel decisions that contradict the data, they signal that analytics is optional rather than essential.
Analytics literacy needs to be a core competency for marketing teams. This doesn't mean everyone needs to be a data scientist, but everyone should understand basic concepts like statistical significance, attribution models, and how to interpret common visualizations. Regular training and accessible documentation help build this capability.
Clear ownership and accountability prevent analytics from becoming everyone's responsibility and therefore no one's responsibility. Designate specific people responsible for data quality, report creation, and insight generation. Make analytics performance part of how marketing team members are evaluated.
Standardized metrics and definitions eliminate the confusion that happens when different teams calculate the same metric differently. Create a data dictionary that defines how every important metric is calculated, what data sources feed it, and what business questions it answers. When everyone uses the same definitions, conversations become productive instead of devolving into arguments about whose numbers are right.
Regular analytics reviews create rhythm and accountability. Weekly performance reviews for tactical optimization. Monthly deep dives into channel performance and customer segments. Quarterly strategic reviews that inform budget allocation and planning. These recurring meetings force teams to actually look at the data and make decisions based on what they find.
Experimentation culture is the natural extension of analytics-driven decision making. Instead of debating which approach is better, test both and let the data decide. This requires infrastructure for running controlled experiments, processes for designing valid tests, and patience to wait for statistical significance before declaring winners.
The goal isn't to eliminate intuition and experience from marketing decisions—it's to combine human judgment with data insights. The best marketing decisions come from experienced marketers who use analytics to validate their hypotheses, identify blind spots, and quantify the impact of their choices.
Taking Action: Your Analytics Implementation Roadmap
Reading about marketing analytics is easy. Implementing it is hard. Here's a practical roadmap for building analytics capabilities that actually drive better marketing performance.
Phase 1: Foundation (Weeks 1-4)
Start by auditing your current analytics setup. What tools are you using? What data are you collecting? Where are the gaps? Document your current state before trying to improve it.
Fix your tracking infrastructure. Implement proper UTM parameter conventions for all campaigns. Set up conversion tracking for every important customer action. Deploy server-side tracking if you're relying solely on pixels. Broken tracking is the most common reason analytics initiatives fail.
Define your key metrics and how they're calculated. What does "conversion" mean for your business? How do you calculate customer lifetime value? What attribution model will you use? Get alignment on these definitions before building reports.
Phase 2: Visibility (Weeks 5-8)
Build your core dashboards. Start with a high-level executive dashboard showing the metrics that matter most to business outcomes. Add channel-specific dashboards for tactical optimization. Create customer journey visualizations that show how people move through your funnel.
Implement proper attribution tracking. Choose an attribution model that matches your business (multi-touch for complex B2B sales, last-click might be fine for simple e-commerce). Set up the infrastructure to track customer journeys across channels and devices.
Establish reporting cadence and ownership. Who creates which reports? When are they delivered? Who's responsible for analysis and recommendations? Make this explicit rather than assuming it will happen organically.
Phase 3: Optimization (Weeks 9-16)
Start running controlled experiments. A/B test landing pages, ad creative, email subject lines, and campaign targeting. Build the muscle of hypothesis-driven testing rather than random changes.
Implement automated alerts for important metric changes. You shouldn't have to check dashboards constantly—the system should notify you when something requires attention.
Begin cohort analysis to understand how customer quality changes over time. Are recent customers more or less valuable than those acquired six months ago? This informs whether your marketing is improving or declining in effectiveness.
Phase 4: Prediction (Weeks 17-24)
Build predictive models for customer lifetime value. Use historical data to forecast how much different customer segments are worth over time. This transforms how you think about acquisition costs and channel profitability.
Implement lead scoring to prioritize sales follow-up. Use behavioral signals and demographic data to predict which prospects are most likely to convert.
Start incrementality testing to measure true marketing impact. Run geo-experiments or holdout tests to understand what would happen without specific marketing activities.
Phase 5: Intelligence (Ongoing)
Integrate AI-powered insights into your analytics workflow. Use machine learning to identify patterns, predict outcomes, and recommend actions.
Build closed-loop systems where analytics insights automatically trigger marketing actions. When a customer shows churn risk, launch a retention campaign. When a prospect reaches a lead score threshold, alert sales immediately.
Continuously refine your attribution models and analytics infrastructure as your business evolves. Analytics is never "done"—it's an ongoing process of measurement, learning, and optimization.
The teams that execute this roadmap systematically will have analytics capabilities that most competitors can't match. The teams that skip steps or rush through phases will end up with sophisticated-looking dashboards that don't actually improve marketing performance.
Start Measuring What Matters
Marketing analytics isn't about collecting more data—it's about making better decisions. The difference between marketing teams that grow and those that stagnate comes down to how quickly they can identify what's working, double down on it, and cut what isn't.
You don't need perfect analytics to start improving. You need tracking that's accurate enough to spot trends, attribution that's sophisticated enough to avoid major misallocations, and reporting that's clear enough to drive action. Start there, then iterate toward more advanced capabilities as your needs and resources grow.
The marketing teams winning their markets aren't the ones with the most data—they're the ones who turn insights into action fastest. Build your analytics infrastructure with that goal in mind, and you'll create a competitive advantage that compounds over time.
Ready to elevate your marketing game with precision and confidence? Discover how Cometly's AI-driven recommendations can transform your ad strategy—**Get your free demo** today and start capturing every touchpoint to maximize your conversions.