You just closed a $10,000 deal. Your dashboard shows the customer clicked a Facebook ad yesterday before converting. Case closed, right? Facebook gets the credit, and you shift more budget there.
But what if that customer first discovered you through a podcast mention three months ago, researched you via organic search twice, clicked a LinkedIn ad, downloaded a guide from an email campaign, and then—only then—clicked that Facebook ad before purchasing?
That Facebook ad might have been the final nudge, but it certainly wasn't the whole story. This is the challenge that post-purchase attribution analysis solves.
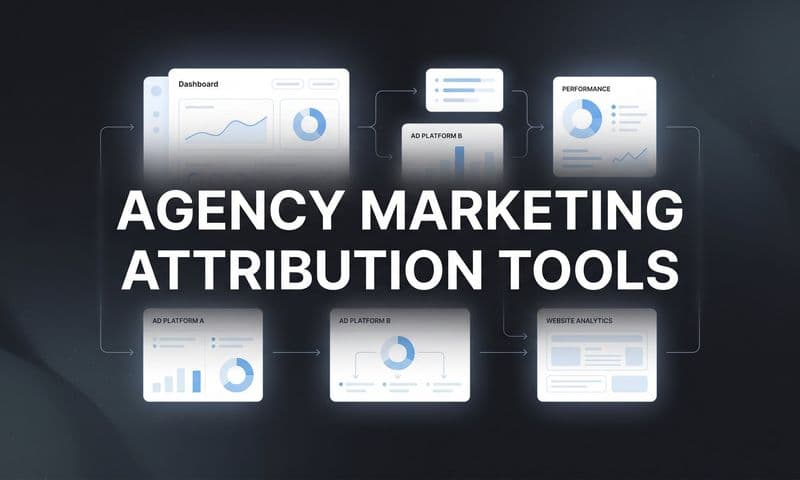
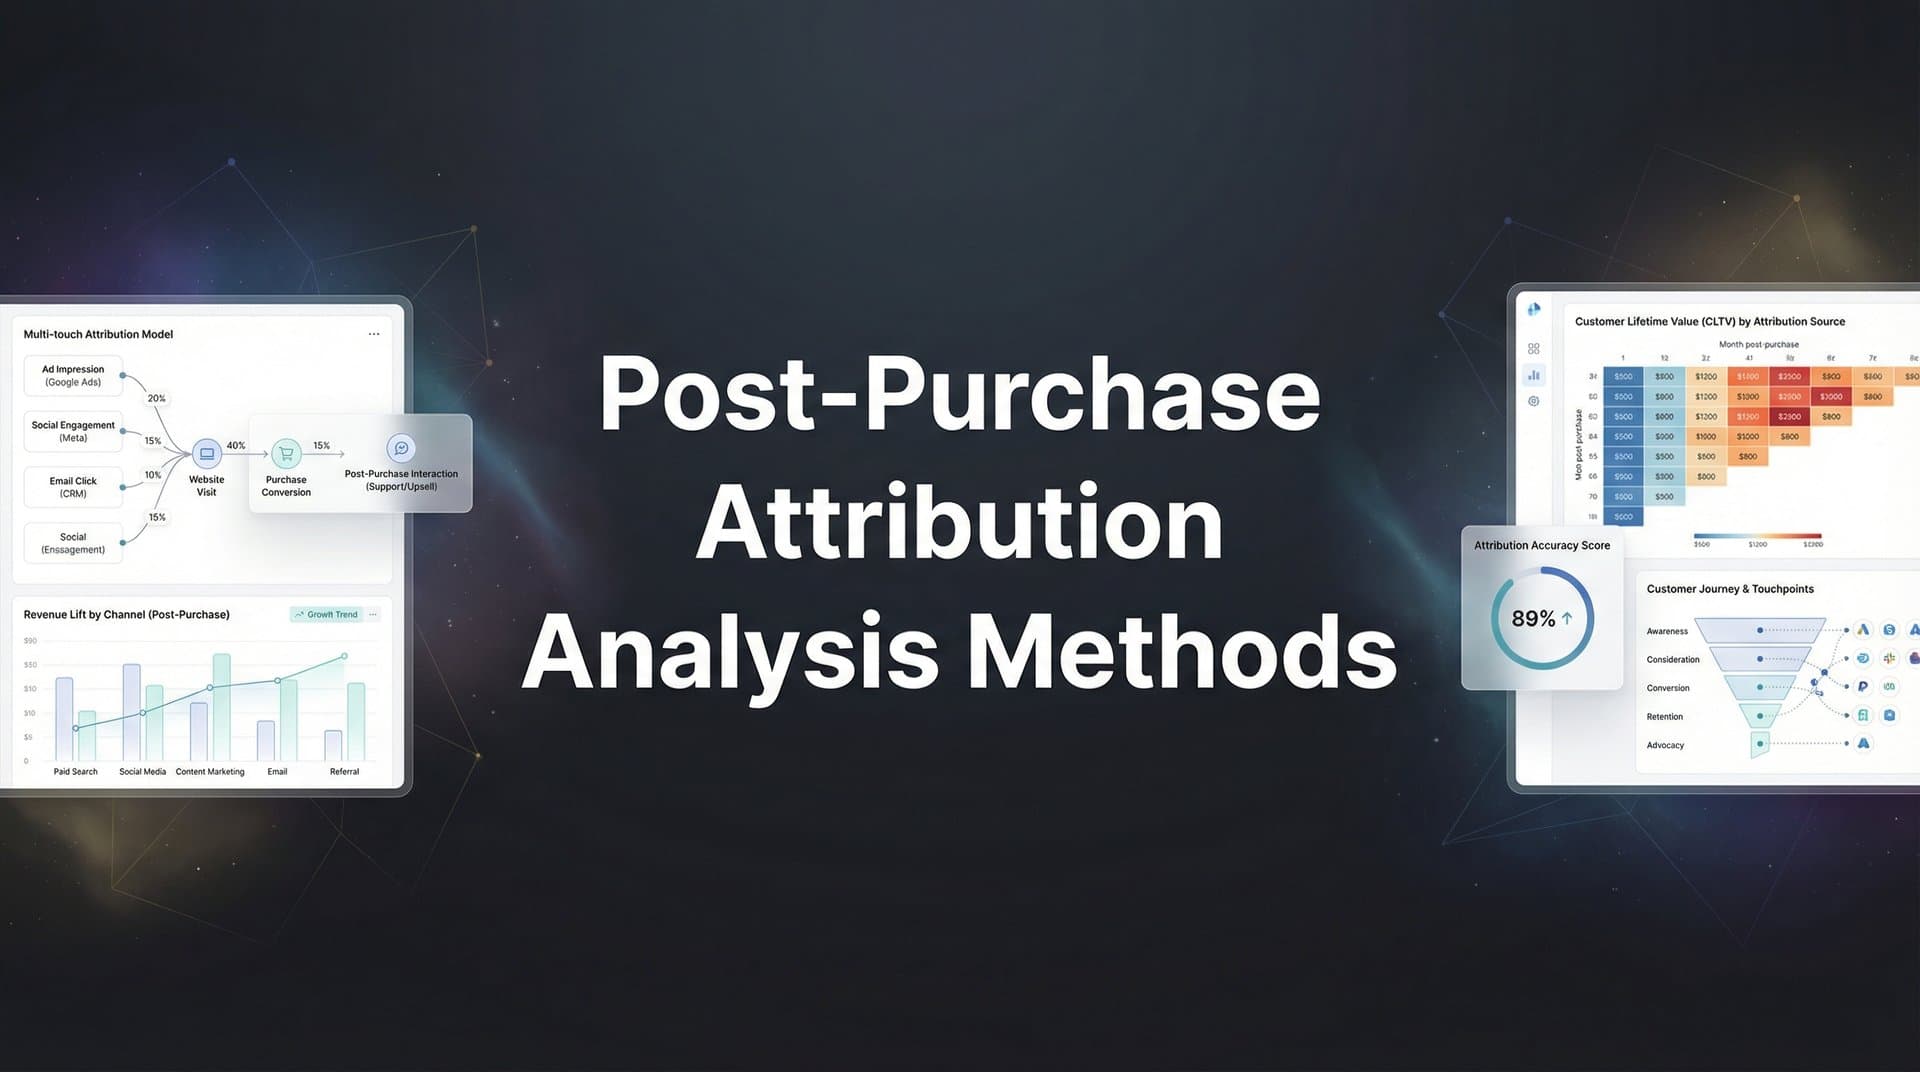
Most marketers celebrate when conversions happen, then move on to the next campaign. The real insights, however, come from what you analyze afterward. Post-purchase attribution analysis examines the complete customer journey after a sale occurs, revealing which touchpoints actually drove revenue versus which ones just looked good on paper.
Without this deeper analysis, you're essentially flying blind. You might be pouring budget into channels that get credit but don't deserve it, while starving the channels that genuinely build your pipeline.
This guide breaks down seven proven methods for analyzing attribution data after purchases happen. These approaches help you understand not just what converted, but why it converted and how to replicate that success across your campaigns.
1. Multi-Touch Attribution Model Comparison
The Challenge It Solves
Relying on a single attribution model gives you a single perspective—and that perspective might be completely misleading. Last-click attribution credits only the final touchpoint, ignoring everything that built awareness and consideration. First-click gives all credit to discovery, dismissing the channels that actually closed the deal.
The truth is that different models reveal different aspects of your marketing ecosystem. Without comparing multiple models side-by-side, you're making budget decisions based on incomplete information.
The Strategy Explained
Multi-touch attribution model comparison means running your purchase data through several attribution frameworks simultaneously to see how credit distribution changes across models. The four core models to compare are first-touch (credits the initial discovery point), last-touch (credits the final interaction), linear (distributes credit equally), and time-decay (weights recent touchpoints more heavily).
When you analyze the same conversion through these different lenses, patterns emerge. A channel that dominates in last-touch might barely register in first-touch, suggesting it's effective at closing but not at generating awareness. Conversely, a channel strong in first-touch but weak in last-touch excels at discovery but struggles to close deals independently.
This comparative approach reveals each channel's true role in your marketing ecosystem rather than forcing everything into a single narrative.
Implementation Steps
1. Export your conversion data with complete touchpoint sequences for a significant sample period—typically 30 to 90 days depending on your sales cycle length.
2. Calculate credit distribution for each conversion using first-touch, last-touch, linear, and time-decay models, creating parallel attribution reports for the same dataset.
3. Compare channel performance across models, noting where channels gain or lose credit as the model changes, and identify channels that perform consistently well across multiple models versus those that only shine in one.
4. Use the comparison insights to segment your channels by role—awareness generators, consideration builders, or conversion closers—and adjust budget allocation and messaging strategy accordingly.
Pro Tips
Don't search for the "correct" model. Instead, use the comparison to understand channel behavior. If a channel performs well only in last-touch, it's a closer that needs earlier-funnel support. If it shines in first-touch but fades in later models, it's an awareness driver that needs help from conversion-focused channels.
2. Cohort-Based Path Analysis
The Challenge It Solves
Aggregate attribution data masks critical differences in how various customer segments actually convert. A customer who discovers you through organic search follows a fundamentally different journey than someone who clicks a paid social ad. Lumping them together creates an averaged view that doesn't reflect how any actual customer behaves.
This averaging problem leads to misguided optimization. You might conclude that email performs poorly overall, missing that it's incredibly effective for organic search cohorts but weak for paid social cohorts.
The Strategy Explained
Cohort-based path analysis groups purchasers by their initial acquisition source, then analyzes the complete journey patterns within each cohort separately. You're essentially asking: "What does the typical path look like for someone who first found us through Google versus someone who clicked a Facebook ad?"
This approach reveals how different entry points lead to different journey patterns. Organic search cohorts might take longer paths with more research touchpoints. Paid social cohorts might convert faster but require more retargeting touches. Referral cohorts might need fewer total touchpoints but specific validation content.
Understanding these cohort-specific patterns lets you optimize the journey for how customers actually behave rather than how you wish they behaved.
Implementation Steps
1. Segment your converted customers into cohorts based on their first documented touchpoint—organic search, paid social, direct traffic, referral, email, paid search, and any other relevant acquisition sources.
2. Map the complete journey for each cohort, documenting average path length, common touchpoint sequences, time between touches, and typical content consumption patterns before conversion.
3. Identify the distinguishing characteristics of each cohort's journey—which channels appear most frequently after the initial touch, which content types drive progression, and what the typical time-to-conversion looks like.
4. Build cohort-specific optimization strategies that align with observed behavior patterns, creating tailored retargeting sequences, content recommendations, and channel mix strategies for each acquisition source.
Pro Tips
Pay special attention to cohorts with higher average order values or better lifetime value metrics. Even if a cohort converts at lower volume, if their journey pattern leads to more valuable customers, that acquisition source deserves more investment and specialized nurturing.
3. Time-to-Conversion Decay Analysis
The Challenge It Solves
Not all touchpoints carry equal weight simply because of their position in the customer journey—timing matters enormously. A touchpoint that occurred six months before purchase likely influenced the decision differently than one that happened six days before. Yet many attribution approaches either ignore timing completely or apply generic decay curves that don't reflect your actual sales cycle.
Without understanding how touchpoint influence changes over time, you can't optimize the rhythm and pacing of your marketing touches.
The Strategy Explained
Time-to-conversion decay analysis examines how the influence of touchpoints changes based on how much time elapsed between that touchpoint and the eventual purchase. This goes beyond standard time-decay attribution models by analyzing your specific data to understand your actual decay patterns.
The approach reveals critical timing insights. You might discover that touchpoints occurring 30-45 days before purchase have surprisingly high correlation with conversion, suggesting an optimal "warming period." Or you might find that touchpoints older than 90 days show minimal influence, indicating when prospects go cold and need re-acquisition rather than nurturing.
This analysis helps you understand not just which channels work, but when they work best in the customer lifecycle.
Implementation Steps
1. Calculate the time elapsed between each touchpoint and the eventual conversion for all converted customers, creating a dataset that shows touchpoint type, position in journey, and days-before-conversion.
2. Group touchpoints into time windows—such as 0-7 days, 8-30 days, 31-60 days, 61-90 days, and 90+ days before conversion—and analyze which channels and content types appear most frequently in each window.
3. Identify your optimal engagement windows by finding time periods where touchpoint frequency correlates most strongly with eventual conversion, and note where engagement drops off or becomes less predictive.
4. Adjust your campaign timing and retargeting windows based on these patterns, concentrating touches during high-influence periods and adjusting frequency caps to match observed decay patterns.
Pro Tips
Look for the "dead zone"—the time window where additional touches show minimal impact on conversion probability. This tells you when to pause nurturing and when to re-engage with fresh messaging. Many companies discover they're over-touching during low-influence periods and under-touching during critical windows.
4. Cross-Device Journey Reconstruction
The Challenge It Solves
Your customers don't live on a single device. They research on mobile during lunch, compare options on a tablet in the evening, and convert on desktop at work. Traditional cookie-based tracking treats each device as a separate person, fragmenting what's actually a single customer journey into multiple incomplete paths.
This fragmentation destroys attribution accuracy. You might think you have three different prospects at different journey stages when you actually have one prospect moving toward conversion across devices. The channel that "converted" on desktop might have been preceded by crucial mobile interactions you never connected.
The Strategy Explained
Cross-device journey reconstruction stitches together customer interactions across multiple devices using both deterministic matching (when customers log in or provide identifying information) and behavioral signals that suggest device connections. The goal is rebuilding the actual customer journey rather than the device-fragmented version your analytics show by default.
This reconstruction often reveals dramatically different attribution stories. What looked like a direct conversion on desktop might actually be the culmination of a mobile-heavy research journey. What seemed like mobile underperformance might actually show mobile driving awareness that desktop capitalizes on.
Server-side tracking significantly improves cross-device reconstruction by capturing data at the server level rather than relying solely on browser cookies, which don't transfer across devices.
Implementation Steps
1. Implement deterministic matching by connecting authenticated sessions where customers log in across devices, creating a unified profile that links all activity when identity is confirmed.
2. Layer in probabilistic signals for non-authenticated sessions by analyzing patterns like IP addresses, user agents, browsing behavior, timing patterns, and content consumption sequences that suggest device connections.
3. Reconstruct complete journeys by merging device-specific paths into unified customer paths, reordering touchpoints chronologically across all devices to see the true sequence.
4. Re-run your attribution analysis on these reconstructed journeys to see how credit distribution changes when you account for cross-device behavior, often revealing that mobile and tablet play larger roles than device-siloed data suggested.
Pro Tips
Pay attention to device role patterns. You might find that mobile consistently drives initial awareness, tablet handles mid-funnel research, and desktop closes conversions. This insight should inform where you invest in different journey stages—not which devices to abandon.
5. Incrementality Testing Post-Purchase
The Challenge It Solves
Attribution models show correlation—which touchpoints appeared before conversion—but correlation isn't causation. Just because a channel appears in converting customer journeys doesn't mean it caused those conversions. Some channels might be taking credit for conversions that would have happened anyway.
This is the "credit thief" problem. A channel might look effective in attribution reports while actually contributing nothing incremental. Without testing for true causal impact, you're optimizing based on associations rather than actual influence.
The Strategy Explained
Incrementality testing uses controlled experiments with holdout groups to measure the true incremental lift a channel or campaign provides. Instead of asking "Did this channel appear before conversion?" you're asking "Did this channel cause conversions that wouldn't have happened otherwise?"
The approach involves creating matched test and control groups, exposing only the test group to the marketing activity you're measuring, then comparing conversion rates between groups. The difference represents true incremental impact rather than correlated activity.
This testing reveals uncomfortable truths. Channels that look strong in attribution reports might show minimal incrementality, meaning they're reaching people who would have converted anyway. Conversely, channels with modest attribution scores might show strong incrementality, indicating they're genuinely creating new demand.
Implementation Steps
1. Design holdout experiments for channels or campaigns you want to test, creating statistically matched control groups that won't be exposed to the marketing activity while test groups receive normal exposure.
2. Run the experiment for a complete sales cycle to capture full conversion impact, ensuring both groups are large enough to detect meaningful differences and truly matched on key characteristics like past behavior and demographics.
3. Compare conversion rates, revenue, and customer lifetime value between test and control groups, calculating the incremental lift as the difference between groups rather than absolute test group performance.
4. Combine incrementality findings with attribution data to identify channels that both appear in customer journeys and cause incremental conversions versus those that only correlate with conversions that would happen regardless.
Pro Tips
Start incrementality testing with your highest-spend channels or those showing suspiciously strong last-touch attribution. These are often the channels most likely to be taking credit for conversions they didn't cause. The findings might be uncomfortable, but they'll save you from wasting budget on credit thieves.
6. Revenue-Weighted Touchpoint Scoring
The Challenge It Solves
Standard attribution analysis treats all conversions equally—a $50 purchase receives the same weight as a $5,000 purchase when calculating channel effectiveness. This conversion-counting approach ignores a critical dimension: not all customers are worth the same.
This equal-weighting problem leads to misguided optimization. You might shift budget toward channels that drive high conversion volume but low revenue, while underinvesting in channels that generate fewer conversions but much higher-value customers.
The Strategy Explained
Revenue-weighted touchpoint scoring adjusts attribution credit based on the actual revenue generated by each conversion rather than simply counting conversions. A touchpoint that appears in a $10,000 customer journey receives proportionally more credit than the same touchpoint in a $100 customer journey.
This approach reveals which channels and touchpoints correlate with high-value customer acquisition. You might discover that certain content pieces, ad campaigns, or channel combinations consistently appear in journeys leading to premium purchases, even if they don't drive the highest conversion volume.
The method helps you optimize for customer value rather than customer volume, which typically aligns better with actual business objectives.
Implementation Steps
1. Enrich your attribution data with revenue values for each conversion, including both initial purchase value and projected lifetime value if available, ensuring every touchpoint can be connected to the revenue it influenced.
2. Recalculate attribution credit using revenue as the weighting factor instead of conversion count, so a channel appearing in three $5,000 conversions receives more total credit than one appearing in ten $500 conversions.
3. Compare revenue-weighted attribution against conversion-counted attribution to identify channels that punch above or below their weight—those that drive fewer conversions but higher value versus those that drive volume but lower value.
4. Adjust budget allocation and campaign optimization to favor channels and touchpoints that correlate with high-value customer acquisition, even if this means accepting lower total conversion volume in exchange for higher revenue per conversion.
Pro Tips
Take this analysis further by segmenting based on customer lifetime value rather than just initial purchase value. Some channels might drive lower initial purchases but customers with better retention and expansion potential. Revenue-weighting based on LTV reveals these long-term value drivers that initial purchase data misses.
7. Assisted Conversion Impact Analysis
The Challenge It Solves
Last-click attribution gives all credit to the final touchpoint before conversion, completely ignoring every channel that helped build the path to that final click. This creates a distorted view where "closer" channels look like heroes while "builder" channels appear ineffective.
The result? You might cut budget from channels that are actually essential to your conversion ecosystem because they rarely get last-click credit, even though conversions collapse without them.
The Strategy Explained
Assisted conversion impact analysis specifically measures how often channels appear in converting customer journeys without receiving last-touch credit. It answers the question: "How many conversions would we lose if this channel disappeared, even though it's not getting credit in last-click models?"
The analysis calculates an assist ratio—how many times a channel assists conversions versus how many times it gets last-click credit. A high assist ratio indicates a channel that's crucial to the conversion ecosystem but undervalued in last-click models.
This reveals your ecosystem dynamics. Some channels (like brand search) might show strong last-click performance but weak assist rates, indicating they capture demand rather than create it. Others (like content marketing or social) might show weak last-click but strong assists, indicating they build demand that other channels capitalize on.
Implementation Steps
1. Identify all touchpoints that appear in converting customer journeys regardless of position, creating a complete inventory of channels that played any role in conversions even if they didn't get final credit.
2. Calculate assist metrics for each channel including total assists (appearances in converting paths without last-click), assist ratio (assists divided by last-click conversions), and assisted conversion value (revenue from conversions where the channel assisted but didn't close).
3. Map your conversion ecosystem by visualizing which channels commonly work together, identifying channel combinations that frequently appear in the same customer journeys and analyzing the typical sequence patterns.
4. Protect and invest in high-assist channels even if they show weak last-click performance, recognizing their role in building the pipeline that other channels convert, and test what happens to overall conversion rates when you reduce investment in these builder channels.
Pro Tips
Create channel dependency maps showing which channels rely on others for their effectiveness. Your paid search conversions might depend heavily on content marketing assists. Your retargeting success might depend on social media building initial awareness. Understanding these dependencies prevents you from accidentally breaking your conversion ecosystem by cutting a crucial assist channel.
Putting It All Together
Post-purchase attribution analysis transforms raw conversion data into a strategic advantage. Each of these seven methods reveals a different dimension of how your marketing actually works—not how you hoped it would work, but how it genuinely drives revenue.
Start with multi-touch model comparison to understand your baseline and see how different perspectives change the credit story. This foundation shows you which channels play multiple roles versus those with narrow functions.
Layer in cohort-based path analysis to understand how different customer segments actually move through your ecosystem. The insights here prevent you from optimizing for an average customer who doesn't exist.
Add time-to-conversion decay analysis to understand when touchpoints matter most, helping you concentrate efforts during high-influence windows rather than spreading touches evenly across time periods with vastly different impact.
The goal isn't finding a single "correct" attribution answer. That's a myth. The goal is building a complete, multidimensional picture of how your marketing ecosystem works together to drive revenue.
When you connect your ad platforms, CRM, and website data into a unified view, these analysis methods become exponentially more powerful. Complete data reveals the true customer journey from first click to final purchase, across devices, channels, and time periods.
This is where platforms built for comprehensive attribution excel. When you can capture every touchpoint—from ad clicks to CRM events—you're providing your analysis with the complete, enriched view it needs to generate genuine insights rather than partial guesses.
The marketers who master post-purchase attribution analysis don't just know what converted. They understand why it converted, which touchpoints genuinely drove the decision, which channels deserve more investment, and which ones are taking credit they don't deserve.
That understanding is the difference between hoping your marketing works and knowing exactly what's driving results.
Ready to elevate your marketing game with precision and confidence? Discover how Cometly's AI-driven recommendations can transform your ad strategy—Get your free demo today and start capturing every touchpoint to maximize your conversions.