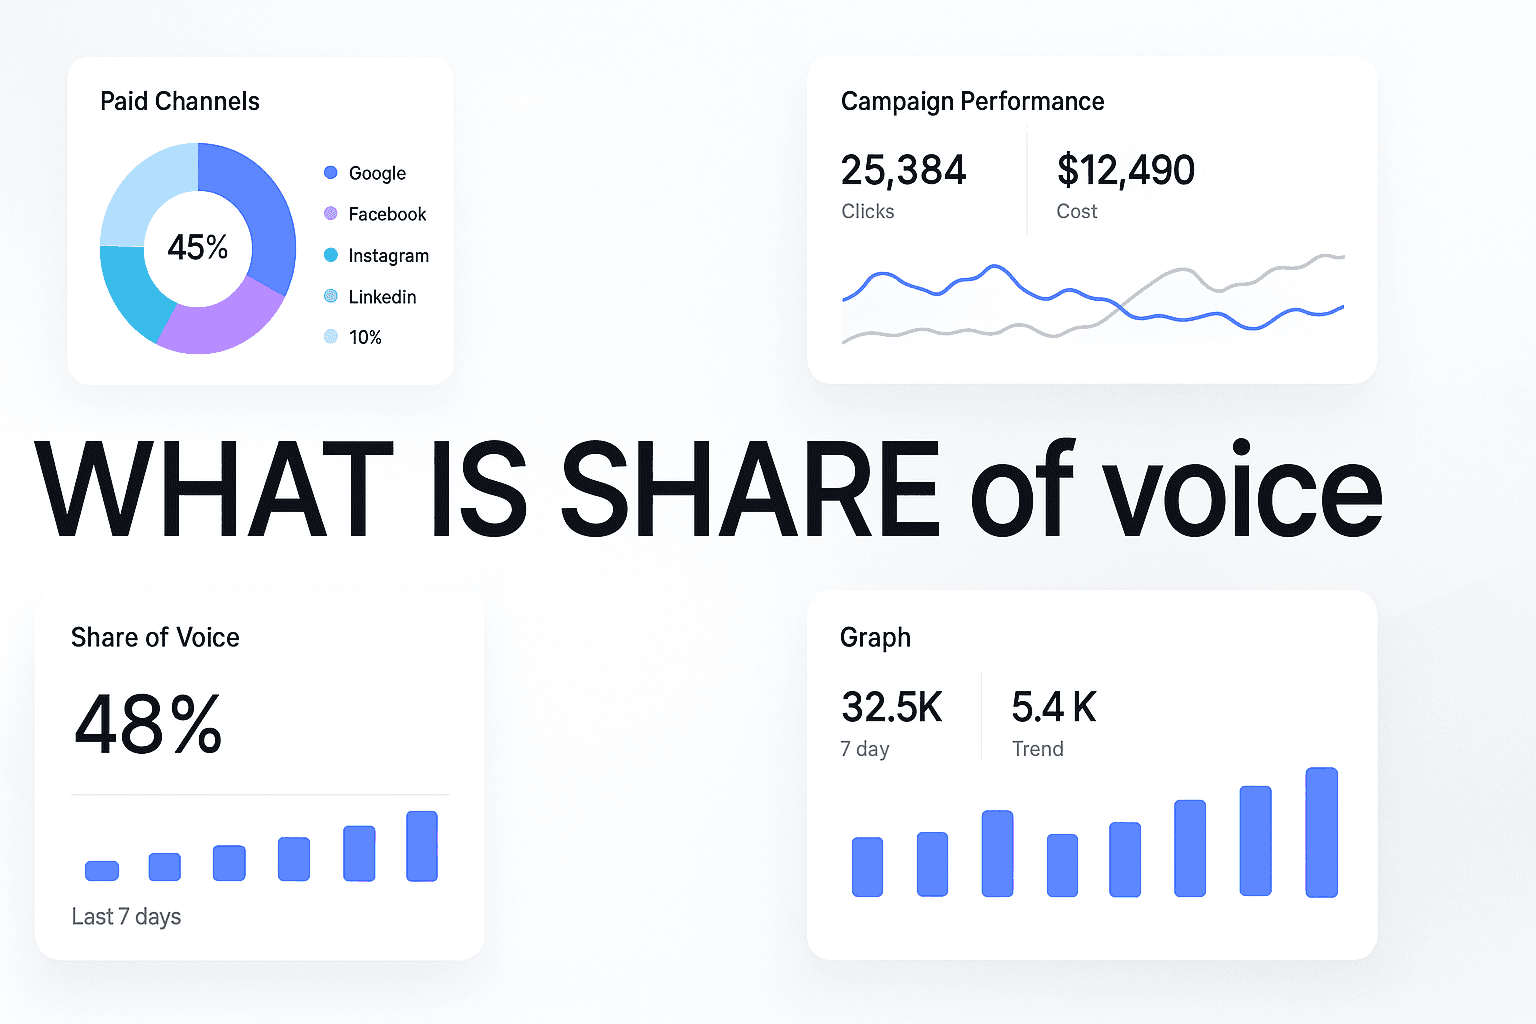
What Is Share of Voice? The Complete Guide to Measuring Your Brand's Market Presence
You're staring at your campaign dashboard at 2 AM, and the numbers look solid. Your click-through rates are up 15%. Cost per acquisition is trending down. Engagement metrics are climbing steadily across three platforms.
But here's the question keeping you awake: Are you actually winning?
Your competitors seem to be everywhere. Their ads pop up in every search. Their content floods social feeds. Their brand dominates industry conversations. Meanwhile, you're left wondering if your marketing budget is even making a dent in the competitive landscape—or if you're just shouting into a void while competitors own the conversation.
This is the visibility paradox that haunts modern marketers. You can measure your own performance down to the penny, but you have no idea how your brand presence compares to the competition. You're flying blind in a dogfight, making million-dollar budget decisions without knowing if you're gaining ground or falling behind.
The answer lies in a metric that most marketers have heard of but few truly understand: share of voice.
Share of voice reveals exactly where you stand in the competitive attention economy. It quantifies your brand's visibility relative to competitors across every channel where customers make decisions. More importantly, it connects the dots between marketing presence and market capture—showing you whether your visibility today is building the market share you'll own tomorrow.
This isn't just another vanity metric to add to your reporting deck. Share of voice is a leading indicator of business performance, a competitive intelligence tool, and a strategic framework for budget allocation all rolled into one measurement. When you understand SOV, you stop guessing about competitive positioning and start making data-driven decisions about where to invest, where to defend, and where to attack.
In this guide, you'll learn exactly what share of voice measures, how it's calculated across different channels, and why it matters more than ever in today's fragmented digital landscape. We'll break down the mechanics behind SOV measurement, explore how it connects to attribution and revenue outcomes, and show you how to build a measurement system that transforms competitive visibility from a mystery into a strategic advantage.
By the end, you'll know precisely how to measure your share of voice, interpret what those numbers mean for your business, and use SOV insights to outmaneuver competitors in the battle for customer attention.
Let's start with the fundamentals.
What Is Share of Voice?
Share of voice (SOV) measures your brand's visibility compared to competitors within a specific market or channel. It quantifies what percentage of the total conversation, advertising presence, or customer attention your brand captures relative to the entire competitive landscape.
Think of it this way: If you and four competitors are all advertising in the same space, and customers see 100 total brand impressions, share of voice tells you how many of those 100 impressions belong to your brand versus theirs.
The fundamental formula is straightforward:
Share of Voice = (Your Brand Metrics / Total Market Metrics) × 100
But here's where it gets interesting: "metrics" changes depending on what you're measuring. In paid search, you might track impression share. In social media, you could measure mention volume or engagement share. For traditional advertising, it might be ad spend relative to category spending. Each channel requires its own SOV calculation methodology, but the underlying principle remains constant—you're measuring your slice of the total attention pie.
Share of voice originated in traditional advertising, where it specifically measured your ad spend as a percentage of total category advertising spend. If your industry spent $10 million on TV advertising last quarter and you spent $2 million, your SOV was 20%. This metric helped advertisers understand whether they were investing enough to be heard above the competitive noise.
The digital revolution transformed SOV from a simple spend-based metric into a sophisticated measurement of actual visibility and engagement. Today's share of voice encompasses everything from marketing analytics tracking paid search impression share to social media conversation dominance to organic content visibility. The metric evolved because digital channels finally made it possible to measure actual audience exposure rather than just media investment.
This evolution matters because modern SOV reveals not just how much you're spending, but how effectively you're capturing attention. You can outspend competitors and still lose SOV if your targeting is poor, your creative underperforms, or your content fails to resonate. Conversely, you can punch above your weight class with strategic positioning and compelling messaging that generates disproportionate visibility relative to investment.
Share of voice differs fundamentally from market share, though the two metrics are closely related. Market share measures your actual business results—your percentage of total category sales or revenue. SOV measures your visibility and presence in the market. The relationship between these metrics is one of the most important dynamics in marketing strategy.
Here's the critical insight: Share of voice is a leading indicator of market share. Your visibility today predicts your market position tomorrow. Research consistently shows that brands with SOV higher than their market share tend to grow, while brands with SOV lower than their market share tend to decline. This relationship exists because visibility drives consideration, consideration drives purchase intent, and purchase intent eventually converts to market share.
The lag between SOV changes and market share impact varies by industry, purchase cycle, and competitive intensity. In fast-moving consumer goods with short purchase cycles, you might see SOV changes reflected in market share within weeks. In B2B software with 6-12 month sales cycles, the lag could be quarters or even years. But the directional relationship holds across categories: increase your share of voice above your market share, and you create the conditions for growth.
This predictive relationship makes SOV invaluable for strategic planning. It transforms marketing from a cost center into a growth investment with measurable leading indicators. When you track SOV alongside market share, you can identify competitive threats before they impact revenue, spot growth opportunities before competitors capitalize on them, and make confident budget decisions based on visibility gaps rather than gut instinct.
Why Share of Voice Matters for Your Business
Share of voice matters because it directly predicts business growth. This isn't marketing theory—it's backed by decades of research showing that brands with SOV exceeding their market share grow, while brands with SOV below their market share decline.
The relationship is remarkably consistent across industries. When your share of voice exceeds your market share by 10 percentage points, you can expect market share growth of approximately 0.5% over the following year. This "excess share of voice" (ESOV) principle, documented extensively by marketing effectiveness researchers, provides a quantifiable link between marketing investment and business outcomes.
Here's why this relationship exists: Share of voice creates mental availability. When customers encounter your brand more frequently than competitors, you occupy more mental real estate. When purchase occasions arise, brands with higher mental availability get considered first and chosen more often. Over time, this consideration advantage converts to market share gains.
The mechanism works in both directions. Brands that cut marketing investment to boost short-term profitability see their SOV decline relative to competitors. This visibility loss erodes mental availability, which eventually manifests as market share decline. The damage often doesn't appear immediately—it can take 6-18 months for SOV reductions to fully impact sales—which makes the metric especially dangerous to ignore.
For a deeper dive into this space, see our AI media buying software guide.
For growing businesses, SOV provides the roadmap for expansion. If you currently hold 5% market share but want to reach 10%, you need to achieve and maintain SOV above 10% for an extended period. The metric tells you exactly how much visibility you need to generate to support your growth ambitions, transforming vague goals like "increase brand awareness" into concrete targets like "achieve 12% SOV in paid search."
Share of voice reveals competitive dynamics that other metrics miss. Your own performance data shows how you're doing in isolation, but SOV shows how you're doing relative to the competition—and in business, relative performance is what matters.
When a competitor increases their advertising spend by 40%, your absolute metrics might look stable, but your SOV reveals you're losing ground. When you launch a successful content campaign, your engagement metrics show improvement, but SOV tells you whether you're actually gaining share or just keeping pace with competitors who are also improving.
This competitive context transforms how you interpret performance. A 15% increase in brand mentions sounds impressive until SOV analysis reveals that competitors grew mentions by 30%, meaning you actually lost ground. Conversely, flat year-over-year metrics might seem disappointing until SOV shows you maintained share while competitors declined, indicating you're winning by standing still.
SOV also exposes competitive vulnerabilities and opportunities. When you track SOV by channel, you can identify where competitors are overinvested (creating opportunities to outmaneuver them in underserved channels) and where they're dominant (requiring either increased investment or strategic repositioning). This intelligence guides budget allocation with precision impossible from internal metrics alone.
The competitive intelligence extends to timing and seasonality. SOV tracking reveals when competitors increase investment, launch campaigns, or pull back spending. These patterns help you identify optimal windows for aggressive investment (when competitors are quiet) and periods requiring defensive spending (when competitive pressure intensifies). You stop reacting to competitors blindly and start anticipating their moves based on historical SOV patterns.
Share of voice transforms budget allocation from guesswork into strategy. Instead of distributing marketing spend based on last year's allocation or executive preferences, you can invest based on visibility gaps and growth opportunities revealed by SOV analysis.
The framework is straightforward: Calculate your SOV by channel, compare it to your market share and growth targets, then allocate budget to close the gaps. If your market share is 8% but your paid search SOV is only 4%, you have a clear visibility deficit requiring investment. If your social media SOV is 15% but your market share is 8%, you're overinvested relative to results and might reallocate budget to underperforming channels.
This approach prevents common budget allocation mistakes. Many brands spread investment evenly across channels regardless of competitive dynamics, essentially funding competitors' dominance in channels where they're already winning. SOV analysis reveals where you're underinvested relative to opportunity and overinvested relative to returns, enabling strategic reallocation that maximizes visibility per dollar spent.
The budget allocation framework also accounts for competitive intensity. Achieving 20% SOV in a channel where the market leader holds 40% requires different investment than achieving 20% SOV in a fragmented channel where the leader holds 25%. SOV data reveals not just where to invest, but how much investment is required to reach meaningful visibility thresholds in each channel.
For agencies and marketing teams, SOV provides objective justification for budget requests. Instead of arguing for increased spend based on channel preferences or vendor relationships, you can demonstrate specific visibility gaps and quantify the investment required to close them. This evidence-based approach to budget allocation reduces political friction and aligns stakeholders around growth objectives rather than channel loyalties.
How to Calculate Share of Voice
Calculating share of voice requires three components: defining your competitive set, selecting the right metrics for each channel, and establishing a consistent measurement methodology. The specific calculation varies by channel, but the underlying framework remains constant.
Start by identifying your competitive set—the brands you're measuring against. This isn't necessarily your entire industry. For SOV purposes, focus on direct competitors who target the same customers and compete for the same attention. A luxury automotive brand measures SOV against other luxury brands, not the entire automotive market. A B2B SaaS company tracks SOV against direct feature competitors, not every software company.
Your competitive set should include 4-8 brands maximum. Too few competitors and you miss important market dynamics. Too many and the data becomes unwieldy without adding strategic value. Include your top 3-5 direct competitors plus 1-2 aspirational brands you're trying to displace. This combination provides both tactical competitive intelligence and strategic growth benchmarks.
The competitive set may vary by channel. Your paid search competitors might differ from your social media competitors if different brands dominate different channels. That's fine—SOV is channel-specific, and your competitive set should reflect the actual competitive dynamics in each space.
Once you've defined competitors, select the appropriate metrics for each channel you're measuring.
For paid search, the primary SOV metric is impression share—the percentage of total available impressions your ads captured. Google Ads and Microsoft Advertising provide impression share data directly in their platforms. Calculate SOV by comparing your impression share to competitors' impression share for the same keywords. If you're capturing 25% of impressions and competitors collectively capture the other 75%, your paid search SOV is 25%.
Impression share is the gold standard for paid search SOV because it measures actual visibility—how often customers saw your ads versus competitors' ads. It accounts for budget constraints, quality score, and competitive intensity automatically. A brand with unlimited budget but poor quality scores might have lower impression share than a competitor with smaller budget but better ad relevance.
For more granular analysis, calculate SOV at the keyword level or campaign level. High-value keywords might show different competitive dynamics than broader terms. Brand keywords typically show higher SOV than generic category terms. This granularity reveals where you're winning and losing in the paid search auction, guiding bid strategy and budget allocation.
Social media SOV typically measures mention volume—how often your brand is mentioned compared to competitors. Tools like Brandwatch, Sprout Social, or Mention track brand mentions across platforms and calculate your percentage of total conversation volume.
The basic formula: (Your Brand Mentions / Total Category Mentions) × 100 = Social SOV
But raw mention volume only tells part of the story. Sophisticated social SOV analysis incorporates engagement metrics—likes, shares, comments, and other interactions. A brand with fewer mentions but higher engagement per mention might have greater actual visibility than a brand with more mentions but lower engagement. Some practitioners calculate "engagement share of voice" by weighting mentions by their engagement levels.
Sentiment also matters for social SOV. A brand dominating conversation with negative mentions isn't winning—it's managing a crisis. Track positive, negative, and neutral sentiment separately, and consider calculating "positive SOV" (your share of positive mentions) as a more meaningful metric than raw mention volume.
Social SOV varies significantly by platform. Your Instagram SOV might differ dramatically from your LinkedIn SOV if different competitors dominate different platforms. Calculate platform-specific SOV to understand where you're winning and where you're losing in the social landscape.
Organic search SOV measures your visibility in unpaid search results compared to competitors. Unlike paid search impression share (which platforms provide directly), organic SOV requires third-party tools like Semrush, Ahrefs, or Sistrix that estimate search visibility across keyword sets.
These tools calculate organic SOV by tracking your rankings for target keywords, estimating the search volume for those keywords, and calculating the expected traffic based on position-specific click-through rates. Your organic SOV is your estimated traffic as a percentage of total estimated traffic for your keyword set.
The methodology accounts for the reality that ranking #1 captures more visibility than ranking #5, which captures more than ranking #10. A brand ranking #1 for 10 keywords might have higher organic SOV than a brand ranking #5 for 50 keywords, depending on the search volume distribution.
For accurate organic SOV measurement, define a consistent keyword set that represents your market. Include brand keywords (where you should dominate), category keywords (where you compete directly), and adjacent keywords (where you're trying to expand). Track the same keyword set over time to measure SOV trends rather than absolute values, which can fluctuate based on keyword selection.
Traditional advertising SOV—TV, radio, print, outdoor—typically measures spend share rather than impression share. The formula is straightforward: (Your Ad Spend / Total Category Ad Spend) × 100 = Traditional Media SOV
Industry reports from Nielsen, Kantar, or category-specific research firms provide total category spending data. Compare your investment to these benchmarks to calculate SOV. A brand spending $5 million on TV advertising in a category with $50 million total TV spend has 10% TV SOV.
Spend-based SOV is less precise than impression-based metrics because it assumes equal efficiency across competitors. A brand with better media buying, more compelling creative, or superior targeting might generate more actual visibility per dollar spent. But in traditional media where impression-level data is difficult to obtain, spend share provides a reasonable proxy for visibility share.
If you're evaluating vendors, our AI for media buying breakdown can help.
For more sophisticated traditional media SOV, incorporate gross rating points (GRPs) or target rating points (TRPs), which measure actual audience delivery rather than just spend. These metrics account for media efficiency and provide more accurate visibility measurement, though they require access to media planning data that may not be available for all competitors.
Share of Voice Across Different Marketing Channels
Share of voice manifests differently across marketing channels, each with unique measurement approaches, competitive dynamics, and strategic implications. Understanding these channel-specific nuances is essential for building a comprehensive SOV measurement system.
Paid search SOV operates in a real-time auction environment where visibility changes minute by minute based on bids, quality scores, and budget constraints. This dynamic nature makes paid search SOV both highly measurable and highly volatile.
The primary metric—impression share—reveals not just your current visibility but also your growth potential. Google Ads reports "lost impression share due to budget" and "lost impression share due to rank," showing exactly why you're not capturing 100% SOV. If you're losing 40% impression share to budget constraints, you know that increased investment would directly increase visibility. If you're losing impression share to rank, you need to improve quality score through better ad relevance, landing page experience, or expected click-through rate.
Paid search SOV varies dramatically by keyword type. Brand keywords (searches for your company name) should show 90%+ impression share—anything less means competitors are conquering your brand traffic. Generic category keywords typically show much lower SOV because more competitors bid on these terms and search volume is distributed across more queries. Long-tail keywords might show higher SOV if you've identified valuable terms competitors haven't targeted.
The strategic implication: Paid search SOV is highly controllable. Unlike organic search (where rankings take months to shift) or social media (where conversation volume depends on cultural factors beyond your control), you can increase paid search SOV immediately by raising bids or increasing budgets. This makes paid search an effective channel for rapidly closing visibility gaps when SOV analysis reveals you're underinvested relative to competitors.
Competitive intelligence in paid search SOV extends beyond impression share. Tools like Semrush, SpyFu, and Adbeat reveal which keywords competitors are bidding on, what ad copy they're testing, and how their investment levels change over time. This intelligence helps you identify gaps in competitors' strategies—valuable keywords they're not targeting, seasonal patterns in their investment, or creative approaches they haven't tested.
Social media SOV measures conversation dominance rather than advertising presence. While paid social ads contribute to overall social visibility, SOV in this channel primarily tracks organic mentions, engagement, and brand discussion volume.
The challenge with social SOV is that conversation volume doesn't always correlate with marketing investment. A brand can dominate social conversation through viral content, customer service issues, product launches, or cultural moments that have nothing to do with paid promotion. This makes social SOV less directly controllable than paid search SOV but potentially more valuable as a measure of genuine brand salience.
Social SOV reveals several strategic insights. First, it shows whether your content strategy is working. If you're publishing consistently but your mention volume isn't growing relative to competitors, your content isn't resonating. Second, it exposes conversation topics and themes. Analyzing what drives mentions for your brand versus competitors reveals messaging opportunities and positioning gaps. Third, it identifies influencers and advocates. Tracking who's mentioning your brand and how their audiences engage shows where you have organic amplification and where you need to build relationships.
Platform-specific social SOV matters because different audiences and conversation types dominate different platforms. A B2B software company might have strong LinkedIn SOV but weak Instagram SOV, which is fine if their customers live on LinkedIn. A consumer brand might dominate Instagram and TikTok while barely registering on LinkedIn, which aligns with their audience demographics. Calculate SOV by platform to ensure you're measuring visibility where your customers actually spend attention.
Engagement rate adds crucial context to social SOV. A brand with 30% mention share but 2% engagement rate has less actual visibility than a brand with 20% mention share but 8% engagement rate. The second brand's mentions are being seen, shared, and discussed more actively, creating greater mental availability despite lower raw volume. Track both mention SOV and engagement SOV to understand true social visibility.
Organic search SOV measures your visibility in unpaid search results—the rankings you've earned through content quality, technical optimization, and backlink authority rather than paid placement. This form of SOV is particularly valuable because it reflects sustained competitive advantage rather than temporary visibility purchased through advertising.
Organic SOV typically shows more stability than paid search SOV. Rankings change gradually based on content updates, algorithm changes, and competitive content efforts. This stability makes organic SOV a good measure of long-term brand strength and content strategy effectiveness. A brand with growing organic SOV is building durable visibility that persists regardless of advertising budget fluctuations.
The measurement methodology for organic SOV relies on tracking rankings across a defined keyword set and estimating traffic based on position-specific click-through rates. Tools like Semrush provide "visibility scores" that aggregate this data into a single metric comparable across competitors. Your organic SOV is your visibility score as a percentage of total visibility across your competitive set.
Keyword selection dramatically impacts organic SOV calculations. A narrow keyword set focused on high-volume category terms might show low SOV if competitors dominate those terms, while a broader set including long-tail variations might show higher SOV if you've built content depth. Define your keyword set based on actual customer search behavior rather than vanity terms, and track the same set consistently over time to measure trends.
Organic SOV reveals content strategy effectiveness and competitive positioning. If competitors are gaining organic SOV, they're publishing content that's outranking yours—a leading indicator that they're building mental availability in organic search. If you're gaining organic SOV, your content strategy is working and you're capturing more visibility in the channel where customers research and evaluate solutions.
The strategic value of organic SOV is its compounding nature. Unlike paid channels where visibility stops when budget runs out, organic visibility persists and often grows over time as content accumulates backlinks and authority. Investing in organic SOV is investing in an asset that generates returns long after the initial investment, making it particularly valuable for brands with limited advertising budgets or long customer lifecycles.
Traditional advertising SOV—television, radio, print, and outdoor—measures visibility in channels where digital measurement is limited or impossible. While these channels represent declining share of total media consumption, they remain important for many categories, particularly consumer packaged goods, automotive, and retail.
Traditional media SOV typically relies on spend-based measurement because impression-level data is difficult to obtain across competitors. Industry reports provide category spending benchmarks, and you compare your investment to calculate SOV. A brand spending $10 million on TV in a category with $100 million total TV spend has 10% TV SOV.
The limitation of spend-based SOV is that it assumes equal efficiency across competitors. A brand with better media buying might pay less per impression, generating higher actual visibility despite lower spend. A brand with more compelling creative might generate more attention per impression, creating greater mental availability despite equal impression delivery. Spend-based SOV is a directional indicator rather than a precise visibility measurement.
We compare the leading options in our AI media buying tool roundup.
For more accurate traditional media SOV, incorporate audience delivery metrics like gross rating points (GRPs) or target rating points (TRPs). These metrics measure actual audience reach and frequency, accounting for media efficiency differences. If available, GRP-based SOV provides better visibility measurement than spend-based SOV, though obtaining competitor GRP data often requires industry research subscriptions or media agency relationships.
Traditional media SOV remains strategically important in categories where these channels drive significant awareness and consideration. For mass-market consumer brands, TV SOV often correlates more strongly with market share than digital channel SOV because television still reaches the broadest audiences most efficiently. For local businesses, radio and outdoor SOV might matter more than social media SOV if those channels reach customers more effectively.
The key is matching SOV measurement to customer media consumption. If your customers watch TV, measure TV SOV. If they've cut the cord and live on streaming platforms, measure streaming/OTT SOV instead. SOV is only strategically valuable when measured in channels where your customers actually allocate attention.
Tools and Methods for Measuring Share of Voice
Measuring share of voice requires combining platform-native data, third-party tools, and manual competitive research. No single tool provides comprehensive SOV measurement across all channels, so building an effective measurement system means selecting the right combination of resources for your specific needs.
Google Ads provides impression share data directly in the platform, making paid search SOV measurement straightforward for your own campaigns. Navigate to the campaign or ad group level, add impression share columns to your reports, and you'll see your impression share percentage along with lost impression share due to budget and lost impression share due to rank.
This native data is accurate and free, but it only shows your own performance—not competitors'. For competitive paid search SOV, you need third-party tools that estimate competitor activity. Semrush, SpyFu, and Adbeat provide competitive intelligence showing which keywords competitors bid on, estimated spend levels, and ad copy variations. These tools don't provide exact competitor impression share (that data is proprietary to each advertiser), but they estimate competitive intensity and relative investment levels.
The methodology: Use Google Ads impression share for your own SOV baseline, then use competitive intelligence tools to estimate whether you're over- or under-invested relative to competitors. If SpyFu shows a competitor bidding on 500 keywords in your category while you're bidding on 200, you can infer they likely have higher SOV even without exact impression share data.
For social media SOV, tools like Brandwatch, Sprout Social, Mention, and Talkwalker track brand mentions across platforms and calculate your share of conversation. These tools monitor social platforms, news sites, blogs, forums, and review sites, aggregating all mentions of your brand and competitors into a unified dashboard.
The setup process requires defining your brand keywords (including common misspellings and abbreviations) and your competitive set. The tool then tracks mentions over time and calculates your percentage of total mention volume. More sophisticated tools also track sentiment, engagement metrics, influencer mentions, and conversation themes.
Social listening tools vary in platform coverage and data accuracy. Twitter/X data is typically most complete because the platform provides robust API access. Instagram and Facebook data is more limited due to privacy restrictions. TikTok coverage is emerging but still incomplete across most tools. When selecting a social listening tool, verify it covers the platforms where your customers are most active.
The limitation of social listening tools is that they track public mentions only. Private messages, closed groups, and dark social sharing (links shared through messaging apps) don't appear in SOV calculations. This means social SOV underestimates total conversation volume, though it presumably underestimates consistently across competitors, making relative SOV measurements still valuable.
Organic search SOV requires tools that track rankings across keyword sets and estimate traffic based on position and search volume. Semrush, Ahrefs, and Sistrix are the leading platforms for this measurement, each with slightly different methodologies but similar core functionality.
These tools work by tracking your rankings and competitor rankings for a defined keyword list, looking up search volume for each keyword, and applying position-specific click-through rate curves to estimate traffic. Your organic SOV is your estimated traffic as a percentage of total estimated traffic across your competitive set.
The accuracy of organic SOV measurement depends on keyword selection and search volume data quality. Google Keyword Planner provides search volume estimates, but these are ranges rather than exact numbers and may not reflect actual search behavior. Tools use various methods to refine these estimates, but all organic SOV calculations involve some estimation.
For practical organic SOV measurement, focus on trends rather than absolute numbers. Whether your organic SOV is exactly 23.4% or approximately 25% matters less than whether it's growing or declining relative to competitors. Track the same keyword set consistently over time, and use SOV changes as the strategic signal rather than treating the absolute percentage as precise.
Most tools also provide "visibility scores" that aggregate ranking data into a single metric. These scores use proprietary algorithms to weight rankings by search volume and position, creating a comparable metric across competitors. While the exact calculation varies by tool, visibility scores provide a useful shorthand for organic SOV that's easier to track than managing keyword-by-keyword data.
Traditional media SOV measurement typically relies on industry reports and media monitoring services rather than self-service tools. Nielsen provides TV advertising data, Kantar tracks multimedia advertising spend, and category-specific research firms often publish competitive spending reports.
These reports show total category advertising spend by channel, allowing you to calculate your SOV by comparing your spend to the category total. The data is typically released quarterly or annually, making traditional media SOV a lagging indicator compared to digital channel SOV, which you can measure in real-time.
For brands with significant traditional media investment, media agencies often provide competitive spending reports as part of their service. These reports aggregate data from multiple sources to show how your investment compares to competitors across TV, radio, print, and outdoor channels.
The limitation of traditional media SOV is data availability and timeliness. Competitive spending data is estimated rather than exact (competitors don't publish their media budgets), and the data is often several months old by the time it's available. This makes traditional media SOV useful for strategic planning and annual budget allocation but less valuable for tactical optimization.
Building a comprehensive SOV measurement system requires combining multiple data sources into a unified view. Most organizations use spreadsheets or business intelligence tools to aggregate SOV data from various platforms into a single dashboard.
The framework should include:
- Channel-specific SOV metrics (paid search impression share, social mention share, organic visibility share, etc.)
- Overall SOV across all measured channels (weighted by channel importance to your business)
- Trend data showing SOV changes over time
- Competitor-specific SOV to identify which competitors are gaining or losing visibility
- Market share data for comparison to SOV (to calculate excess share of voice)
The measurement cadence depends on channel volatility and business needs. Paid search SOV can be measured weekly or even daily because it changes rapidly. Social SOV typically makes sense to measure monthly because short-term fluctuations are less strategically meaningful. Organic SOV might be measured monthly or quarterly because rankings change gradually. Traditional media SOV is typically measured quarterly or annually based on data availability.
For most businesses, monthly SOV reporting provides the right balance of timeliness and strategic value. This cadence allows you to identify trends without overreacting to short-term noise, and it aligns with typical marketing planning and budget review cycles.
Interpreting Your Share of Voice Data
Collecting share of voice data is only valuable if you can interpret what the numbers mean for your business and translate insights into strategic action. SOV interpretation requires comparing your visibility to market share, identifying trends over time, and understanding competitive dynamics.
The most important SOV analysis compares your share of voice to your market share. This relationship reveals whether you're investing enough to grow, overinvesting relative to results, or underinvesting and risking decline.
The framework is straightforward:
- SOV > Market Share: You're overinvesting in visibility relative to your current market position. This creates excess share of voice (ESOV), which predicts future market share growth. The larger the gap, the faster you should expect to grow—assuming your product, pricing, and distribution support the increased demand your visibility is generating.
- SOV = Market Share: You're investing proportionally to your market position. This maintains your current competitive position but doesn't create conditions for growth. You're keeping pace with competitors but not gaining ground.
- SOV < Market Share: You're underinvesting in visibility relative to your market position. This predicts future market share decline as competitors with higher SOV capture more consideration and gradually erode your customer base.
The magnitude of the gap matters as much as the direction. Research suggests that each percentage point of ESOV (SOV exceeding market share) drives approximately 0.5% market share growth annually. A brand with 15% market share and 20% SOV (5 points of ESOV) can expect to grow market share to approximately 17.5% over the following year, assuming other factors remain constant.
This relationship provides a quantitative framework for growth planning. If you want to grow from 10% to 15% market share, you need to achieve and maintain approximately 20% SOV for an extended period. The metric transforms vague growth ambitions into concrete visibility targets.
Ready to elevate your marketing game with precision and confidence? Discover how Cometly's AI-driven recommendations can transform your ad strategy—**Get your free demo** today and start capturing every touchpoint to maximize your conversions.