Average Order Value (AOV) is one of those core eCommerce metrics that sounds simple on the surface. At its most basic, it tells you the average dollar amount spent every time a customer places an order on your site. Think of it as the typical size of a customer's shopping cart when they hit "buy."
But don't let its simplicity fool you. This single number holds the key to unlocking more profitable growth.
What Average Order Value Reveals About Your Business
 Boost your average order value with proven strategies
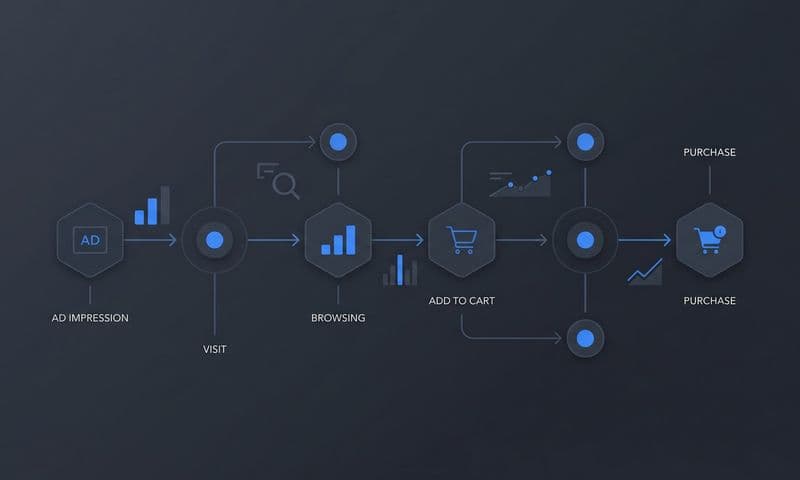
Most brands are obsessed with two things: driving more traffic and converting more visitors. And while those goals are obviously important, they completely overlook a powerful growth lever hiding in plain sight—getting each customer to spend just a little bit more per transaction. This is where your AOV becomes a game-changer.
Imagine AOV is like a car's fuel efficiency rating (MPG). It doesn't tell you how many trips you took or how many cars are on the road. Instead, it tells you how efficiently you're using the fuel you already have. A higher AOV means you're getting more mileage out of every single customer you convert.
To help you get a handle on the fundamentals, here’s a quick breakdown of what AOV really means for your day-to-day operations.
AOV Core Concepts At A Glance
A summary of the fundamental components of Average Order Value and its strategic importance.
Concept | What It Means for You | Why It's a Growth Lever |
|---|---|---|
Basic Definition | The average amount customers spend per order. | It's a direct measure of how much value you extract from each transaction. |
Calculation | Total Revenue ÷ Number of Orders. | A simple formula that provides a powerful health check on your sales strategy. |
Customer Behavior | It shows if customers are buying single items or multiple/premium products. | Higher AOV signals successful upselling, bundling, or effective product discovery. |
Profitability Impact | Increasing AOV often has a direct, positive effect on your profit margins. | You can grow revenue without necessarily increasing your customer acquisition costs. |
Ultimately, AOV isn't just a number to report—it’s a metric to influence. Getting it right can fundamentally change your business's trajectory.
The AOV Formula Explained
At its core, calculating AOV is refreshingly straightforward. It gives you a clean snapshot of customer purchasing behavior over any period you choose.
Average Order Value (AOV) = Total Revenue / Number of Orders
For example, if your store generated $50,000 in revenue from 1,000 separate orders last month, your AOV would be $50. This simple number is one of the most vital metrics you can track.
Why This Single Number Matters So Much
AOV is more than just a performance metric; it's a direct indicator of your business's health and profitability. A rising AOV creates a positive ripple effect across your entire operation, boosting your bottom line without needing a massive influx of new traffic.
Understanding AOV provides a snapshot of your business health, much like other vital key success indicators that measure overall performance. Here’s why it’s so critical:
- Increased Profitability: Every dollar you add to your AOV flows directly to your revenue, often with minimal extra cost. This is one of the fastest ways to widen your profit margins.
- Higher Return on Ad Spend (ROAS): When customers spend more per order, the value generated from each ad click goes up. This makes your entire marketing budget work harder, improving ROI on every campaign you run.
- Healthier Customer Lifetime Value (LTV): A higher AOV is often the first step toward a higher LTV. Customers who start with larger purchases are frequently more engaged and more likely to become loyal, repeat buyers. You can see how AOV connects with other metrics for eCommerce here.
- Efficient Growth: Boosting AOV lets you scale revenue from the customers you already have. It's almost always cheaper and more sustainable than constantly spending to acquire new ones.
In the end, tracking and improving your average order value means you’re not just making sales—you’re making each sale count for more. It shifts your focus from simply acquiring customers to maximizing the value of every single interaction.
Calculating AOV with Pinpoint Accuracy
The basic formula for average order value is simple, but relying on a single, blended number is like trying to navigate a city with a map of the entire country. It’s technically correct, but you’re missing the street-level detail you need to make smart decisions.
To actually understand what’s driving performance, you have to dissect your AOV with more precision. Think of it like a road trip: knowing your average speed is useful, but knowing your speed on highways versus city streets is far more actionable. The same logic applies to your business.
Segmenting AOV for Deeper Insights
Calculating AOV for different channels and customer groups shows you where your most valuable transactions are really coming from. It uncovers hidden opportunities and exposes weak spots in your marketing strategy.
Start by breaking down your AOV by these critical segments:
- Marketing Channel: Is your AOV higher from Google Ads, email marketing, or organic search? A customer clicking a retargeting ad for a high-end product will almost always behave differently than someone who stumbles upon your blog.
- Customer Cohort: Compare the AOV of first-time buyers versus repeat customers. You'll likely find that returning customers spend more because they already trust your brand. Knowing that exact difference helps you quantify the real value of loyalty.
- Device Type: Look at the AOV from desktop users versus mobile shoppers. Desktop users often build bigger carts, while mobile purchases can be more impulsive and smaller. This insight should directly inform your UX and promotional strategies for each platform.
When you isolate these variables, you move from a blurry, generalized metric to a high-definition picture of customer spending. This allows you to put your budget and effort where they’ll generate the highest return.
Common Pitfalls in AOV Calculation
An inaccurate AOV is worse than no AOV at all. It leads to flawed strategies and wasted ad spend because it creates a distorted view of your business's health.
The goal isn't just to calculate a number; it's to calculate the right number. Clean, accurate data is the foundation of any effective optimization strategy, ensuring your decisions are based on financial reality, not vanity metrics.
Be vigilant about sidestepping these common mistakes:
- Ignoring Returns and Refunds: If a customer buys three items for $150 but returns one worth $50, the final revenue for that order is $100. If you don’t subtract returns from your total revenue, you’ll artificially inflate your AOV and hide potential issues with product quality or descriptions.
- Mishandling Discounts: How you account for discounts is crucial. If a $100 order has a 20% discount, the actual revenue generated is $80. Your "Total Revenue" figure has to reflect the post-discount amount to get a true measure of what customers actually paid.
- Relying on Flawed Attribution: This is the biggest pitfall of them all. If your attribution model can't accurately assign sales to the correct marketing channels, your segmented AOV calculations are completely useless. You might end up giving credit to a low-value channel for a high-value sale, leading you to invest in all the wrong places.
Ultimately, accurate tracking is non-negotiable. Using a reliable attribution tool gives you the clean data needed to calculate AOV with confidence. This precision is essential for understanding your business and is a stepping stone to more advanced metrics. For a deeper dive into related concepts, learn more about how to calculate customer lifetime value (CLTV) and see how these metrics work together.
Benchmarking Your AOV Against the Competition
Calculating your average order value is step one, but the number itself doesn't tell you much on its own. Is your $50 AOV amazing? Or is it falling flat? Without context, it's just a number floating in a spreadsheet. This is where benchmarking comes in—it gives you the roadmap you need to set realistic goals and spot your biggest growth opportunities.
Think of it like checking your car's fuel efficiency. Knowing you get 30 miles per gallon is fine, but finding out similar models get 40 MPG tells you there's serious room to improve. Benchmarking your AOV against industry, channel, and device standards does the same thing for your business, turning raw data into a real competitive edge.
Understanding Industry AOV Norms
Average order value swings wildly from one industry to another. It's obvious that a customer buying a luxury watch will have a much higher AOV than someone grabbing a t-shirt. To set smart targets, you have to understand the unique buying habits within your specific market.
Here’s a quick look at how AOV can differ:
- Luxury & Jewelry: These sectors often have the highest AOVs, sometimes hitting $230-$417, thanks to high-ticket items.
- Electronics & Home Goods: These also pull in strong AOVs, as customers are typically making larger, more considered investments.
- Apparel & Accessories: This category has a massive range. Brand positioning is everything—fast fashion will naturally have a lower AOV than designer apparel.
- Beauty & Wellness: Subscriptions and product bundles are the big levers here, often pushing the AOV much higher than single-item purchases would suggest.
Comparing your performance to these benchmarks helps you figure out if your pricing, bundling, and upsell strategies are actually working for your niche. It tells you whether you're punching above your weight or leaving cash on the table.
How Different Channels and Devices Impact AOV
Not all traffic is created equal. The channel a customer uses to find your store and the device they shop on have a huge impact on their spending habits. Breaking down your AOV by these segments is critical for deciding where to put your marketing dollars.
Recent data paints a pretty clear picture. Globally, the average order value is now around $154, which is a healthy 3.08% jump year-over-year. But when you dig in, the regional differences are stark. The Americas lead with an AOV of $183, while APAC is lower at $135—partly because of a higher volume of small, frequent mobile orders. These numbers prove how vital it is to know your most valuable channels. For instance, direct traffic ($110.28 AOV) and email marketing ($112.39 AOV) consistently bring in higher-spending customers. If you want the full statistical breakdown, you can explore the latest average order value statistics from WiserReview.
A customer thoughtfully browsing on a desktop computer on a Sunday evening is in a completely different mindset than someone quickly scrolling through social media on their phone during a lunch break. Your AOV data will reflect this reality.
The chart below shows how different marketing channels typically stack up when it comes to average order value.
 Boost your average order value with proven strategies
As you can see, channels that build customer relationships over time, like email and organic search, often lead to higher-value orders. Paid ads, on the other hand, tend to capture more impulse-driven, lower-value purchases.
To help put this into perspective, we've compiled some typical benchmarks below. This data gives you a clearer picture of how different traffic sources and devices typically perform, helping you zero in on where your biggest opportunities lie.
Average Order Value Benchmarks By Channel And Device
Source/Device | Typical AOV | Strategic Focus |
|---|---|---|
Email Marketing | $112 | Nurture existing customers with targeted bundles, upsells, and loyalty offers. |
Direct Traffic | $110 | Optimize the homepage and navigation to guide high-intent visitors to premium products. |
Organic Search | $105 | Create content around high-value keywords that attract customers ready to make bigger purchases. |
Paid Ads (Social/Search) | $95 | Use retargeting to show higher-ticket items or bundles to users who have already shown interest. |
Desktop Users | $204 | Ensure the desktop experience is seamless for browsing multiple products and adding items to the cart. |
Mobile Users | $137 | Simplify the mobile checkout process and make it easy to discover upsells and bundles on smaller screens. |
This table isn't just a list of numbers—it's a strategic guide. If you see major gaps between these benchmarks and your own performance, you've just found a clear starting point for optimization.
Device usage tells a similar story. Desktop users consistently ring up a higher AOV—sometimes reaching $204—compared to mobile users, whose AOV often stays around $137. Why? The larger screen and more focused environment of a desktop just make it easier to browse multiple products and make bigger, more considered purchases.
This insight is incredibly actionable. If you notice a huge gap between your desktop and mobile AOV, it might be a sign that your mobile experience needs an overhaul to reduce friction and better showcase bundles or upsells.
Understanding these nuances is a core part of mastering your key eCommerce performance metrics. When you use benchmarks, you transform AOV from a simple metric into a powerful tool for making strategic decisions, ensuring every marketing dollar is invested for maximum impact.
Proven Strategies to Increase Your Average Order Value
 Boost your average order value with proven strategies
Knowing your average order value is one thing. Actually increasing it is where the real growth kicks in. The good news is that boosting your AOV doesn't require high-pressure sales tactics. It's all about making smarter, more valuable offers to customers right when they’re ready to buy.
This isn’t about tricking people into spending more. It’s about anticipating their needs and presenting helpful solutions that naturally increase their cart size. When you get this right, you don't just lift revenue—you actually improve the customer experience by helping them find other products they'll love.
Master the Art of Upselling and Cross-Selling
Upselling and cross-selling are classic for a reason: they work. An upsell encourages a customer to buy a more premium or upgraded version of a product. A cross-sell suggests complementary items that make their original purchase even better.
Think of Amazon's "Frequently Bought Together" section. It's the perfect cross-sell because it feels genuinely helpful. If you’re buying a camera, seeing a suggestion for a memory card and a case isn't pushy—it’s just plain smart. It solves a problem before the customer even has it.
Here’s how to do it right:
- Offer Timely Upsells: Present the premium option right on the product page. Show the "Pro" model next to the standard one and highlight the extra features.
- Suggest Relevant Cross-sells: Display complementary products in the cart or at checkout. If someone adds a dress to their cart, show them the perfect shoes to match.
- Use Post-Purchase Offers: A one-click upsell after the initial purchase is incredibly effective. They've already committed, so adding another item feels effortless.
Create Irresistible Product Bundles
Bundles are about packaging related products together and selling them as a single kit, usually at a slight discount. This works because it simplifies the decision for the customer and makes the value crystal clear.
Instead of hoping a customer hunts down three separate skincare products, you can offer a "Morning Routine Kit" that has everything they need. It takes the guesswork out and makes the purchase feel like a complete, intelligent solution. Suddenly, their focus shifts from the cost of each item to the total value of the package.
By curating logical product groups, you position your brand as an expert that understands the customer's needs. A well-designed bundle doesn't just sell products; it sells a solution, making the higher price point an easy decision.
Set Strategic Free Shipping Thresholds
Few things motivate a customer to add one more item to their cart like the promise of free shipping. A strategically placed shipping threshold is one of the easiest ways to nudge your AOV higher. The key is to set the minimum spend just a little bit above your current average order value.
For example, if your current AOV is $42, setting a free shipping threshold at $50 is a powerful move. It makes customers feel like they're earning a reward for spending a bit more, instead of just throwing money away on a shipping fee. It's a true win-win: they get something they value, and you get a bigger order. This is why so many successful brands focus on incentives like offering free freight to get customers over that spending hump.
Implement Loyalty Programs and Volume Tiers
Rewarding your best customers is just good business. A well-designed loyalty program can directly impact AOV by giving people a reason to spend more to unlock points, discounts, or other exclusive perks.
Volume discounts and tiered pricing work in a similar way by incentivizing bigger buys. Think "Buy 2, Get 1 Free" or a pricing model where the cost-per-item goes down as they add more to their cart. This is especially potent for consumable goods or anything people tend to stock up on.
- Tiered Rewards: Create levels like Bronze, Silver, and Gold that offer better perks as customers spend more.
- Gamified Experience: Show customers how close they are to the next reward. That little progress bar can be a powerful motivator.
- Exclusive Access: Give your most loyal, high-spending customers early access to new products or private sales.
Leverage Personalization for Smarter Recommendations
At the end of the day, every strategy on this list gets better with personalization. Use the data you have—like a customer's purchase history and browsing behavior—to power a recommendation engine that suggests products they’ll actually want.
If someone consistently buys your entry-level running shoes, your site could automatically recommend a premium, higher-priced model on their next visit. By showing people products that align with their genuine interests, you dramatically increase the odds of a larger purchase. This level of personalization turns your website into a helpful shopping assistant, guiding customers toward better products and, in turn, a higher AOV. It's a critical piece of any solid web conversion optimization strategy.
How to Track and Optimize AOV with Cometly
 Boost your average order value with proven strategies
Knowing the strategies to boost your average order value is one thing, but without a rock-solid way to measure your efforts, you’re just flying blind. This is where a powerful attribution platform like Cometly comes in, turning your AOV theories into tangible results. It helps you move from simply reporting on AOV to actively pulling it as a lever for profitable growth.
Think of Cometly as your command center. It gives you a single, real-time view of your AOV across every channel—paid ads, organic search, email, you name it. It cuts through the noise of siloed data, letting you see exactly how customers from different sources behave and, most importantly, how much they spend.
Gaining True Clarity with Server-Side Tracking
One of the biggest hurdles to optimizing AOV is bad data. Browser-side tracking gets hammered by ad blockers, cookie restrictions, and privacy updates, causing it to miss conversions or attribute them to the wrong source. You might think a campaign is a dud when, in reality, your tracking just isn't keeping up.
Cometly fixes this with robust server-side tracking. By tracking conversions directly from your server instead of a customer's browser, it captures every single transaction with near-perfect accuracy. The AOV data you see in your dashboard is what’s actually happening, not a rough estimate.
This accuracy is a complete game-changer:
- Trustworthy Per-Channel AOV: You can finally see, with confidence, whether your Google Ads are bringing in higher-value customers than your Facebook campaigns.
- Reliable Campaign Insights: Pinpoint the specific ads and creatives that consistently attract bigger spenders.
- Accurate Profitability Analysis: With clean data, you can correctly calculate your return on ad spend (ROAS) for campaigns designed to drive a higher AOV.
This unified approach bypasses browser limitations to provide a single source of truth. Cometly's conversion sync then feeds this hyper-accurate data back to your ad platforms, helping their algorithms find more customers who look just like your best ones.
Supercharging Your AOV Strategies with Data
With a foundation of accurate data, you can put those AOV-boosting strategies into overdrive. Cometly helps you identify your most valuable customer segments and channels, so you can tailor your offers for maximum impact.
For instance, you might discover that customers from your email list have an AOV that's 20% higher than those from social media ads. Armed with that insight, you can create exclusive, higher-value bundles just for your email subscribers, knowing they’re more likely to bite. This turns generic tactics into targeted, high-return plays.
Your marketing shouldn't be a guessing game. By pinpointing exactly which campaigns attract high-spending customers, you can stop wasting money on low-value traffic and double down on what truly drives profitable growth.
Optimizing Ad Spend with AI-Powered Recommendations
Cometly doesn’t just track; it helps you optimize. Its AI-powered tools analyze your campaign performance and serve up actionable recommendations. The system can flag which campaigns are consistently delivering a high AOV and suggest shifting more of your ad spend in their direction.
This creates a powerful feedback loop for growth:
- Track: Accurately measure AOV across all your channels.
- Analyze: Identify the campaigns, ads, and audiences that drive the highest value.
- Optimize: Reallocate your budget to focus on these top performers.
- Scale: Use what you've learned to inform future bundling, upselling, and pricing strategies.
By building Cometly into your workflow, you move beyond just calculating a metric and start actively shaping your average order value. To get a feel for how all the pieces fit together, you can explore the full suite of Cometly analytics features and see how it provides a complete picture of your marketing performance.
AOV FAQs
Even after you've got the basics down, a few questions always seem to come up when it's time to actually start boosting your Average Order Value. Nailing these details will help you fine-tune your strategy and dodge the common mistakes that trip up other brands.
What Is a Good Average Order Value?
There’s no magic number here. “Good” is completely relative. An e-commerce brand selling high-end furniture would be thrilled with an AOV in the thousands, while a specialty coffee shop might have a killer business with an AOV of $50.
Forget about universal benchmarks. Instead, focus on what matters for your business:
- Your Industry and Niche: Start by looking at your direct competitors. Their AOV gives you a realistic baseline to measure against, so you know if you're in the right ballpark.
- Your Profit Margins: A high AOV doesn't mean much if you aren't profitable. The goal is to make money, so your AOV needs to be high enough to comfortably cover your customer acquisition costs (CAC) and still leave a healthy profit.
- Your Business Model: If you run a subscription service, your initial AOV might seem low. But what really matters there is customer lifetime value (LTV), which could be massive over time.
Honestly, the best benchmark is your own past performance. A 10% year-over-year increase in your AOV is a much better indicator of success than hitting some random industry average.
How Does AOV Differ from Customer Lifetime Value?
It’s super common to mix up Average Order Value (AOV) and Customer Lifetime Value (LTV), but they tell two very different stories about your business. Think of it this way: AOV is a single snapshot, while LTV is the entire photo album.
Average Order Value (AOV) measures how much a customer spends in one specific transaction. It's a short-term metric focused on a single purchase.
Customer Lifetime Value (LTV) predicts the total amount of money a customer will spend with your brand over their entire relationship with you. It’s a long-term metric all about retention and repeat purchases.
AOV is actually a key ingredient that feeds into LTV. A customer who has a high AOV on their first purchase is often more likely to have a higher lifetime value down the road, because you’ve already set the stage for them to spend more with you. The two metrics work hand-in-hand to give you the full picture of your business's health.
Can I Increase AOV Without Offering Discounts?
Absolutely. In fact, you should. While discounts can give you a quick, temporary lift, leaning on them too heavily just eats away at your brand’s value and crushes your profit margins. The most sustainable way to increase your average order value is to add real value, not just slash prices.
Try some of these value-driven strategies instead:
- Create exclusive product bundles that solve a customer's entire problem at once.
- Offer premium services like expedited shipping, product protection plans, or one-on-one expert consultations.
- Launch a loyalty program that rewards customers for spending more with points, perks, or early access to new drops.
These tactics work because customers feel like they're getting something extra for their money, making the decision to spend more a no-brainer.
Ready to stop guessing and start growing? Cometly provides the hyper-accurate, real-time attribution data you need to pinpoint your most valuable customers and optimize every dollar of your ad spend.