
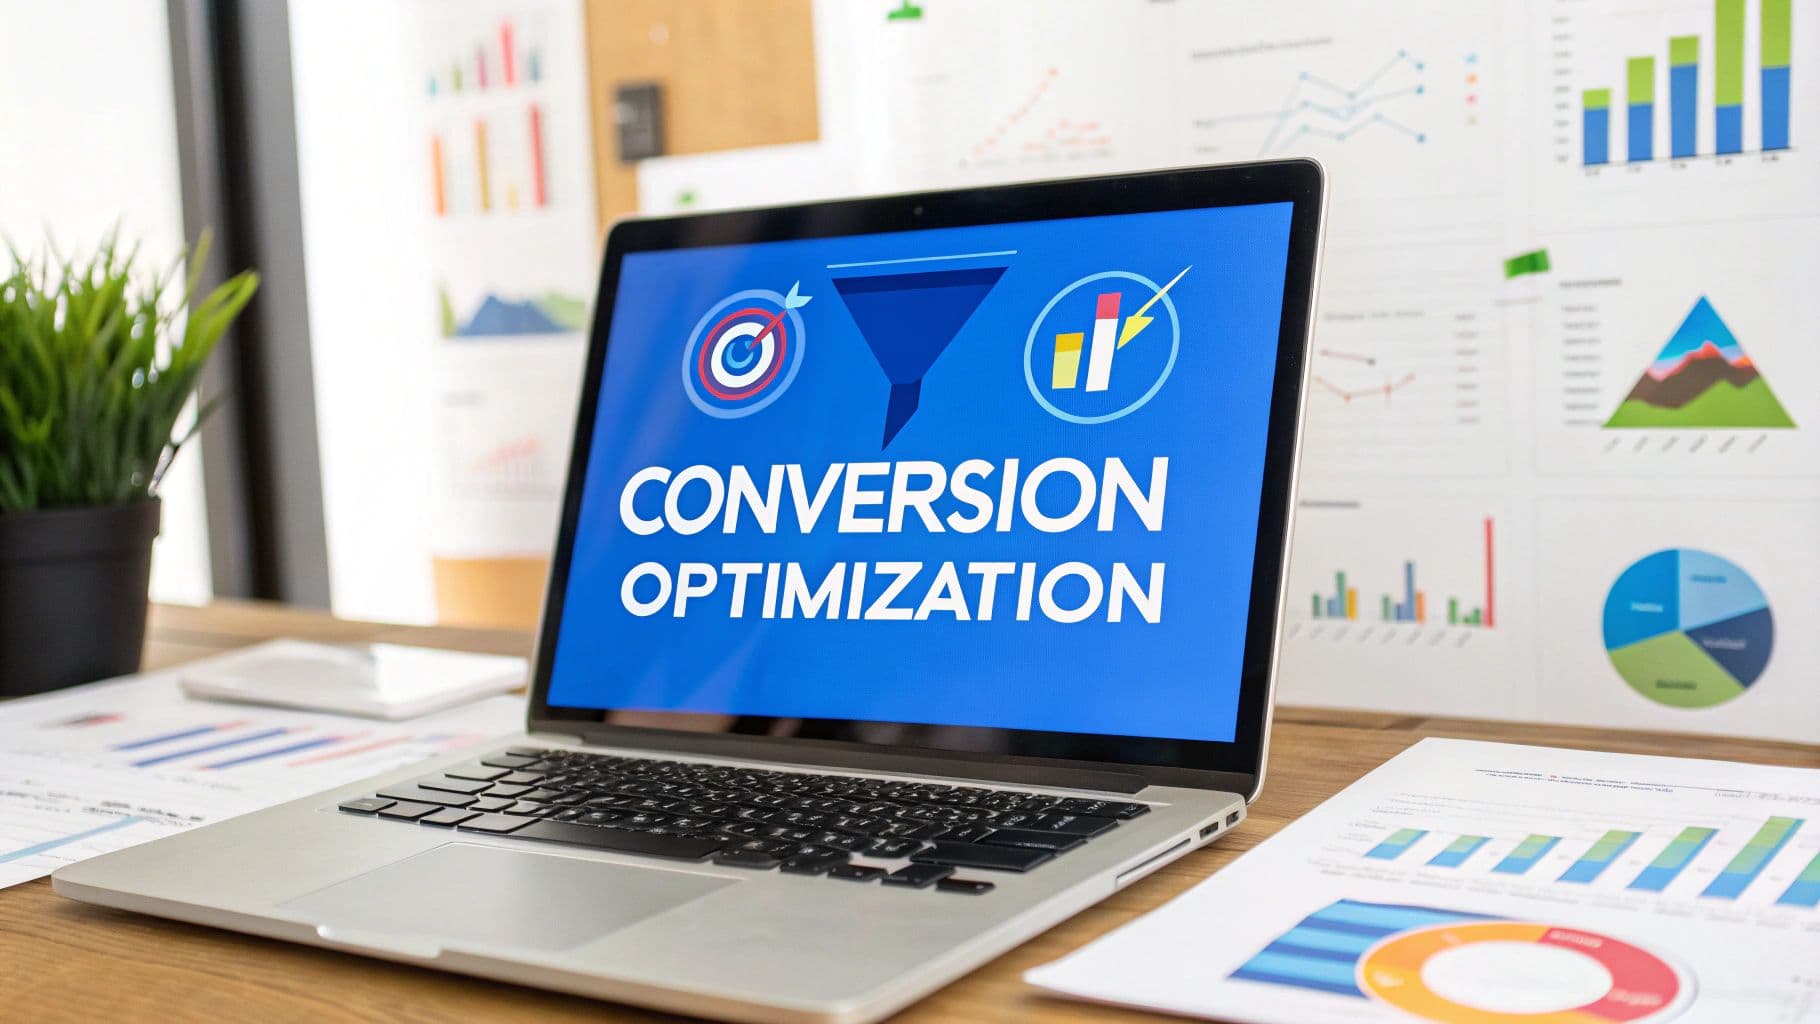
Web conversion optimization is the process of getting more of your website visitors to take a specific, desired action—like buying a product, booking a demo, or signing up for a newsletter. It's not about chasing more traffic; it's about getting more value from the traffic you already have. Think of it as turning curious window-shoppers into paying customers, all without having to spend an extra dime on ads.
What Is Web Conversion Optimization
Imagine your website is a high-end retail store. Getting people to your site through SEO or paid ads is like getting them to walk through the front door. But your job isn't done once they're inside. Web conversion optimization is the art and science of designing your store's layout, signage, and checkout process to make sure visitors not only find what they need but actually complete a purchase.
This isn't about guesswork. It’s a data-driven discipline focused on improving every single touchpoint that influences a user’s decision. Instead of throwing ideas at the wall to see what sticks, optimizers use analytics and user research to understand behavior, pinpoint friction, and run controlled experiments to prove that their changes actually work.
The Core of Conversion Optimization
At the heart of this practice is the conversion rate, a simple but incredibly powerful metric. It tells you exactly how effective your website is by calculating the percentage of visitors who complete a specific goal. To get a deeper understanding, check out our guide on what is a conversion rate in marketing.
The formula itself is pretty straightforward:
Conversion Rate = (Number of Conversions / Total Number of Visitors) x 100%
For example, if 500 visitors land on your product page in a week and 10 of them make a purchase, your conversion rate for that page is 2%. This number is your baseline—the starting point for every optimization effort you'll make. And while 2% might seem small, even tiny improvements can have a massive impact on your bottom line.
Why Small Improvements Matter
Boosting your conversion rate does more than just bring in revenue; it’s a clear sign that you're delivering a better user experience. By removing obstacles, clarifying your messaging, and making the path to purchase smoother, you make your site more efficient for everyone. This creates a powerful feedback loop where better customer satisfaction leads directly to higher profitability.
The gap between "average" and "great" performance reveals a massive opportunity. Across all industries, the average website conversion rate is just 2.9%. But the top 10% of websites are converting at over 11.45%. This huge difference proves that web conversion optimization isn't just about making marginal gains; it's a critical engine for growth.
Mapping Your Customer Journey to Find Leaks
You can't fix a leak you don't know exists. It's a simple truth, but it’s the absolute foundation of effective web conversion optimization.
Think of your website like a series of pipes. Visitors go in one end, and ideally, paying customers come out the other. If you're losing pressure somewhere along the way, you have to find the exact spots where people are dropping off.
This process is called customer journey mapping. It's how you turn abstract analytics data into a clear, actionable roadmap. By visualizing the path users take from their first click to their final purchase, you can pinpoint the specific stages where friction is sending them packing. This isn't about guesswork; it's about systematically finding the weak points in your conversion funnel.
The goal is to stop thinking in vague terms like "our sales are low" and start identifying specific, solvable problems like, "we have a 70% drop-off on our pricing page." Once you know where the problem is, you can start digging into why it's happening.
This diagram shows how everything you do in conversion optimization ladders up to your primary business goal: revenue.
 Web Conversion Optimization: Boost Conversions with Proven Tactics
As you can see, improving your conversion rate is the core mechanism for driving more revenue from the visitors you already have.
Identifying Your Key Funnel Stages
Every business has a slightly different path to conversion, but most follow a familiar pattern. By breaking that journey down into distinct stages, you can measure the transition rate between each step. This is what reveals the precise moments where your user experience is failing.
For an e-commerce store, a typical funnel might look like this:
- Homepage Visit: The user's first impression. Are they finding what they need?
- Product Page View: Does the page build desire and answer questions?
- Add to Cart: A clear signal of intent. What stops them here?
- Initiate Checkout: The final steps. Is the process simple and trustworthy?
- Completed Purchase: The ultimate conversion.
For a SaaS company, the journey is different but just as crucial:
- Landing Page Visit: Does the headline resonate with the user's pain point?
- Pricing Page View: Is the value clear and the pricing easy to understand?
- Sign Up for Trial: The first major commitment. What information are you asking for?
- Onboarding Completion: Are users reaching their "aha!" moment quickly?
- Upgrade to Paid Plan: The final business goal.
Asking the Right Questions at Each Stage
Once you've mapped out your funnel stages, you can analyze the drop-off rate between each one. A 20% drop from the homepage isn't unusual, but an 80% drop between adding to cart and starting checkout? That’s a massive red flag.
This data allows you to ask targeted questions that lead directly to powerful, testable hypotheses.
By focusing on the biggest leaks first, you ensure your optimization efforts are directed where they can have the most significant impact on your bottom line. It’s the difference between patching a pinhole and fixing a burst pipe.
Let's look at a couple of real-world scenarios:
- E-commerce: "Our analytics show that 65% of users abandon their cart after entering their shipping address. Hypothesis: Unexpectedly high shipping costs revealed at this final stage are causing sticker shock and driving them away."
- SaaS: "Only 15% of trial users ever complete our onboarding checklist. Hypothesis: The first step requires a complex integration that is creating too much friction for new users to bother with."
Mapping the journey is what gives you this level of clarity. To dive deeper, our guide on customer journey optimization provides more advanced techniques for analysis. But make no mistake—this foundational step is non-negotiable for any serious web conversion optimization program.
Uncovering the Why Behind User Actions
Analytics are great at telling you what’s happening on your site. They’ll show you which pages have sky-high drop-off rates, where your traffic is coming from, and what your conversion rate is. But they can't tell you why.
For real web conversion optimization, you have to go beyond the numbers and get inside the heads of the people using your site. This is where qualitative user research comes in, and it's a total game-changer.
Think of yourself as a detective. Your analytics data shows you where the "leak" is in your funnel, but qualitative methods let you dust for fingerprints and figure out what really happened. When you combine the "what" from your analytics with the "why" from user research, you stop guessing and start forming powerful, evidence-based hypotheses.
 Web Conversion Optimization: Boost Conversions with Proven Tactics
Seeing Your Website Through Your Users' Eyes
Imagine you could look right over a user’s shoulder as they try to navigate your website. You’d instantly see their confusion, hesitation, and moments of frustration. Well, modern tools let you do pretty much exactly that, giving you a front-row seat to the live user experience.
Three of the most powerful techniques for this are:
- Heatmaps: These tools create a visual overlay on your pages showing where people click, move their mouse, and how far they scroll. Bright red spots are hotbeds of activity, while cool blue areas are getting ignored. A heatmap might reveal that everyone is trying to click on a non-clickable image, instantly flagging a design flaw.
- Session Recordings: Think of these as a DVR for your website. They record anonymous user sessions, letting you watch their entire journey—every mouse movement, click, scroll, and page jump. There's nothing more convincing than watching someone rage-click a broken button or give up trying to find the checkout.
- User Surveys and Polls: Sometimes, the easiest way to figure out what’s wrong is just to ask. Simple on-page polls can capture feedback in the moment. For instance, a small pop-up on the cart page asking, "What's stopping you from completing your purchase today?" can uncover friction points you never even considered.
Combining these methods gives you a 360-degree view of user behavior. While one session recording might be an anomaly, seeing the same struggle across multiple recordings, confirmed by a heatmap showing low engagement on a key CTA, points to a systemic issue demanding a fix.
From Observation to Actionable Hypothesis
The real magic happens when you synthesize all these findings into ideas you can actually test. You graduate from a generic problem to a specific, actionable hypothesis grounded in real user behavior.
Here’s what that workflow looks like in practice:
- Analytics Data (The What): Your data shows an 80% drop-off rate on your mobile checkout page.
- Qualitative Research (The Why): You watch a few session recordings of mobile users. You quickly notice they're repeatedly trying to pinch-and-zoom on the form fields, but the page isn't responsive. They get frustrated and leave.
- Actionable Hypothesis (The Fix): "By making our checkout form fields fully responsive and larger on mobile devices, we will reduce friction and increase the mobile checkout completion rate because users will no longer struggle to input their information."
This process transforms you from a marketer making educated guesses into a data-informed optimizer solving real user problems. The insights you gather can also inform much broader strategies. If you want to dive deeper into how different user groups behave over time, exploring a customer cohort analysis can reveal valuable long-term trends.
Ultimately, this approach ensures your web conversion optimization efforts are focused, effective, and built around your users.
You've dug into the what with your analytics and the why with user research. Now it's time to turn those insights into real, measurable results. This is where experimentation comes in—it's the engine of conversion optimization.
Think of it as a structured way to test your ideas scientifically. You’re not just making a change and crossing your fingers. Instead, you're running a controlled race between two versions of a webpage to see which one performs better with your audience. This process kills the guesswork and proves which changes actually move the needle.
 Web Conversion Optimization: Boost Conversions with Proven Tactics
A Step-by-Step Guide To Your First A/B Test
Launching an experiment might sound complicated, but it’s actually a pretty logical sequence. Stick to this process, and you’ll get valid tests, trustworthy results, and findings you can actually act on.
- Formulate a Clear Hypothesis: Start with an evidence-based "if-then-because" statement. For example: "If we change the CTA button color from green to orange, then clicks will increase because the new color creates more visual contrast against our blue background." This anchors your test to a specific goal and a clear reason.
- Create Your Variation (B): This is your "challenger." Based on your hypothesis, design the new version of your page or element that will run against the original "control" (A). It's super important to change only one significant thing at a time. That's how you isolate the variable and know exactly what caused the change in performance.
- Set Up the Test in Your Tool: Jump into an A/B testing tool to split your traffic between the control and the variation. Most tools handle the technical stuff, randomly showing one version to each user to keep things unbiased.
- Define Your Primary Metric: What’s the one metric that decides the winner? Is it click-through rate? Form submissions? Revenue per visitor? Nailing this down upfront stops you from cherry-picking data that looks good after the test is over.
- Run the Test to Statistical Significance: Let the test run long enough to gather solid data. One of the biggest mistakes people make is ending a test too early. A result might look amazing after two days but completely flip by the end of the week. You're aiming for at least a 95% statistical significance level to feel confident in the outcome. For teams that need to move quicker, exploring an accelerated testing strategy can help get reliable results faster.
- Analyze Results and Implement the Winner: Once the test is done, dive into the data. If your variation produced a statistically significant win, roll it out to all users. If it didn't, you've still learned something valuable about what doesn't work for your audience, which is just as important for your next hypothesis.
A/B Testing vs Personalization
While A/B testing finds the single best experience for everyone, personalization takes it a step further by delivering unique experiences to different audience segments. It's a powerful way to make your site feel more relevant. Here's a quick breakdown of how they differ.
Aspect | A/B Testing | Personalization |
|---|---|---|
Goal | Find the single best version of an experience for all users. | Deliver the most relevant experience for specific user segments. |
Method | Splits traffic randomly between a control (A) and one or more variations (B, C, etc.). | Shows different content or experiences based on user attributes (for example, location, behavior, or traffic source). |
Outcome | One “winning” version is implemented for everyone. | Multiple versions run simultaneously, each targeting a different audience segment. |
Example | Testing two different headlines on a landing page to see which one converts better overall. | Showing a different headline to first-time visitors versus returning customers. |
Best For | Optimizing broad user flows, validating major design changes, and improving core pages. | Increasing engagement with key segments, tailoring offers, and creating a more relevant user journey. |
Both strategies are essential tools in a CRO expert's toolkit. A/B testing helps you build a strong foundation, while personalization allows you to refine the experience for your most important audiences.
Personalization Beyond A/B Testing
Personalization recognizes that a one-size-fits-all approach is rarely the best one. Today’s users expect experiences that feel like they were made just for them. For instance, showing a different headline to first-time visitors than you do to returning customers is a classic personalization tactic.
Interactive content is another great example. Research shows that elements like quizzes and calculators can generate 28% more conversions than static content because they create a more dynamic and engaging experience for the user.
A/B testing is like finding the most popular dish at a restaurant. Personalization is like creating a custom menu based on whether the customer is a vegetarian, a regular, or a first-time diner. Both aim to improve the experience, but they solve different problems.
When you're getting started with experiments, one of the highest-impact areas to focus on is learning how to optimize landing pages for conversions. Since they're often the very first touchpoint, even small wins here can ripple through your entire funnel.
Ensuring Your Conversion Data Is Accurate
You can run the most brilliant, high-impact experiments in the world, but their success hinges on one thing: trustworthy data.
If your analytics can't accurately tell you which tests are actually driving revenue, your entire conversion optimization strategy is built on a shaky foundation. You might kill a test that was a secret winner or, even worse, scale a "winner" that's quietly hurting your bottom line.
The hard truth is that traditional, browser-based tracking is becoming less reliable by the day. It’s like trying to count customers in a store with a faulty security camera that misses every third person who walks in. Privacy updates from Apple, aggressive ad blockers, and the death of third-party cookies mean a huge chunk of your conversion data never even makes it to your analytics or ad platforms.
This creates a massive data gap. Studies show that ad blockers alone are used by over 42% of internet users globally. That means you could be blind to nearly half of your conversion data before it’s ever recorded.
The Breakdown of Browser-Side Tracking
When you rely only on tracking scripts that run in a user's browser—often called client-side tracking—you’re leaving your data at the mercy of countless interruptions. This method is wide open to a whole host of issues that can corrupt or block your data before it ever leaves the user’s device.
This leads to a few huge problems for any optimization efforts:
- Underreported Conversions: Your ad platforms don't get the full story, making your campaigns look far less effective than they actually are.
- Weakened Ad Algorithms: Platforms like Meta and Google rely on conversion data to find you more customers. When you feed them incomplete data, their targeting algorithms get weaker, and your acquisition costs go up.
- Inaccurate A/B Test Results: You can't confidently declare a winning variation if you know your measurement system is missing a huge piece of the puzzle.
This isn't a small rounding error. It’s a systemic flaw that directly kneecaps your ability to scale profitably.
Without accurate data, you are essentially flying blind. You’re making critical budget and strategy decisions based on an incomplete picture of what’s actually driving growth.
The Solution: Server-Side Tracking
To fix this, smart marketers are moving to server-side tracking. Instead of data going from the user’s browser directly to third-party platforms, it’s first sent to your own server. Your server then securely passes that information along to your ad platforms, analytics tools, and CRM.
Think of it as adding a secure and reliable middleman to the process. This completely bypasses all the browser-based interruptions, creating a much more complete and trustworthy data stream. It’s the key to getting near-perfect data accuracy.
For example, using a Conversion API establishes a direct, server-to-server connection with platforms like Meta or Google. To learn more about how this works, our guide explains in detail what a Conversion API is and why it's a must-have for modern advertisers.
This approach ensures your ad platforms receive close to 100% of your conversion data. This creates a powerful feedback loop where the wins from your CRO efforts directly improve your ad targeting, lower your customer acquisition costs, and maximize your overall return on investment. Accurate data isn't just a technical detail—it’s the fuel for your entire growth engine.
Actionable Optimization Playbooks for Your Business
Theory is a great starting point, but web conversion optimization really comes alive when you apply it with a clear, focused strategy. Different business models have completely different funnels and customer motivations, which means a one-size-fits-all approach is doomed to fail. The real skill is translating broad principles into specific, high-impact experiments tailored to your goals.
Below are some proven playbooks for SaaS, e-commerce, and agencies. Each one gives you actionable ideas you can start testing right away to turn insights into measurable growth. These aren't just random tactics; they're strategic starting points designed to smash the most common conversion bottlenecks for each business type.
The SaaS Playbook: Boosting Trial-to-Paid Conversions
For any SaaS company, the journey from a free trial to a paid subscription is where the magic happens—or doesn't. The number one goal is to get users to their "aha!" moment as quickly as possible, where they truly experience the core value of your product. Friction during onboarding is the silent killer of trial conversions.
This playbook is all about making that initial experience seamless, educational, and motivating.
- Implement an Onboarding Checklist: New users are easily overwhelmed. A simple checklist guiding them through 3-5 essential setup actions (like "Create your first project" or "Invite a team member") provides a clear path to value and builds momentum. Test making this checklist impossible to miss on their initial dashboard.
- Clarify Your Pricing Page Layout: Is your pricing page a confusing mess? Test a simplified layout that clearly highlights the benefits of each tier, uses a "Most Popular" badge to guide decisions, and includes an FAQ section to tackle common questions about billing or features head-on.
- Personalize In-App Upgrade Prompts: Ditch the generic "Upgrade Now" messages. Instead, trigger prompts based on user behavior. For example, if a user on a free plan tries to access a paid feature, show a contextual pop-up explaining exactly what they'll unlock by upgrading at that very moment.
The E-commerce Playbook: Reducing Cart Abandonment
For e-commerce brands, the final steps of the checkout are where most sales bleed out. The data is brutal: around 70% of all online shopping carts are abandoned. The reasons almost always boil down to unexpected costs, a clunky checkout process, or a simple lack of trust.
This playbook is designed to streamline the path from cart to confirmation and build that crucial trust.
- Offer a Guest Checkout Option: Forcing users to create an account before they can buy is a massive point of friction. Test the impact of adding a prominent "Checkout as Guest" button. You can always ask them to create an account on the post-purchase thank you page when they're feeling good about their purchase.
- Display Trust Seals and Guarantees: Add security badges (like Norton or McAfee), accepted payment logos (Visa, PayPal), and clear return policy info directly within the checkout flow. These little signals do heavy lifting to reassure anxious buyers that their information is safe and their purchase is risk-free.
- Test Strategic Upsell Placements: Instead of aggressive pop-ups that interrupt the flow, try adding a subtle "You might also like..." section on the cart page or a one-click-add offer on the confirmation page. This can increase your average order value without derailing the sale.
The Agency Playbook: Delivering Client Wins
For agencies, running a web conversion optimization program is all about delivering undeniable ROI for clients. Success here demands a structured process for testing, crystal-clear communication, and picking the right tools for reporting. This playbook provides a framework for building a CRO service that scales.
The core of an agency's value is turning a client's traffic into tangible business results. A structured optimization program moves the conversation from clicks and impressions to revenue and customer lifetime value.
Focus on creating a repeatable system that showcases your expertise. For businesses looking for actionable strategies to convert leads, a guide to effective lower funnel marketing tactics can be invaluable. This approach builds client confidence and proves the value of your work with hard data, leading to longer, more profitable relationships.
Common Web Conversion Optimization Questions
As you dive into web conversion optimization, you're going to have questions. It’s totally natural. This isn't a one-and-done task; it's a constant cycle of learning, testing, and refining what works for your audience.
To help you out, I've put together answers to some of the most common questions I hear from marketers and business owners. The goal here is to give you clear, practical knowledge so you can tackle these challenges with confidence.
How Long Should I Run an A/B Test?
This is easily one of the most critical questions in CRO, and getting it wrong can tank your entire strategy. The answer isn't a specific number of days—it’s all about reaching statistical significance. Pulling the plug too early is a rookie mistake that leads to completely false conclusions.
You need to let your test run long enough to:
- Capture a full business cycle: This usually means at least one full week, weekend included. User behavior on a Tuesday morning is often wildly different from a Saturday night, and you need to account for those natural fluctuations.
- Get a big enough sample size: Your testing tool will track this for you, but you're generally aiming for a 95% confidence level. This tells you that the results aren't just a random fluke.
- Avoid reacting to early trends: It's so tempting, I know. A variation might shoot out of the gate looking like a massive winner after just two days, only to fizzle out or even lose by the end of the week. Patience is your best friend here—let the data mature.
What Is a Good Conversion Rate?
While it’s tempting to look up industry benchmarks, the only number that truly matters is your own. The average website conversion rate hovers around 2.35%, but that figure is almost meaningless without context. It swings wildly depending on your industry, traffic source, and what you're offering.
A luxury e-commerce brand will have a totally different "good" rate than a B2B SaaS company selling a high-ticket subscription. Instead of chasing some universal number, focus on improving your own baseline. A jump from 1% to 1.5% might not sound sexy, but that's a 50% increase in conversions from traffic you already have. That's a huge win.
Your goal should be simple: consistently beat last month's numbers.
How Often Should I Be Testing?
The ideal testing cadence really boils down to your website traffic. If you've got a high-traffic site, you can run multiple tests at once without a problem. For lower-traffic sites, you'll likely need to run one test at a time for a longer stretch to gather enough data.
The most important thing is consistency. You should always have a test running.
Building an "always-on" optimization culture means you're constantly learning about your customers and finding new ways to improve their experience. Even when a test doesn't produce a clear winner, it's not a failure. It still gives you valuable insights that will inform your next hypothesis.
At Cometly, we're firm believers that accurate data is the bedrock of any winning optimization strategy. Our platform is built to make sure your decisions are based on what's actually driving revenue, not on spotty browser-side data. See how our server-side tracking and attribution can give you the confidence to scale your wins.


