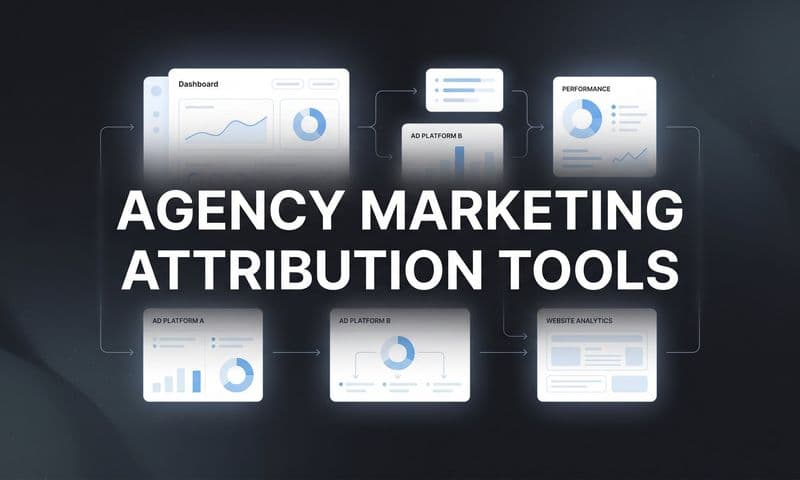
You're running campaigns across Meta, Google, LinkedIn, and email. Traffic is flowing. Conversions are happening. But when your CFO asks which channels actually drive revenue, you freeze. Was it the Facebook ad that started the journey? The Google search that brought them back? The email that finally convinced them? Without a clear answer, you're flying blind—and probably wasting budget on channels that look good but don't convert.
Marketing attribution models solve this problem by assigning credit to the touchpoints that matter most. But here's the catch: choosing and implementing the right model feels like learning a new language. Should you use first-touch? Last-touch? Linear? Time-decay? And once you pick one, how do you actually build it?
This guide walks you through the entire process from scratch. You'll learn how to map your customer journey, choose the right attribution model for your business, set up tracking that actually works, and build reports that reveal which channels earn their budget. By the end, you'll have a working attribution framework—not just theory, but a system you can implement this week.
Whether you're a solo marketer managing a lean budget or leading a team spending six figures monthly, these steps will transform how you understand your marketing performance. No more guessing. No more defending budget decisions with gut feelings. Just clear data showing exactly what drives your results.
Step 1: Map Your Customer Journey Touchpoints
Before you can attribute credit, you need to know where credit belongs. Start by identifying every channel where prospects interact with your brand. This includes paid advertising (Meta, Google, LinkedIn, TikTok), organic channels (SEO, social media, referrals), email marketing, direct traffic, and any offline touchpoints like events or sales calls.
Open a spreadsheet and create three columns: Channel, Tracking Method, and Data Source. List every marketing channel you're actively using. For tracking method, note whether you're using UTM parameters, pixel tracking, CRM integration, or manual logging. For data source, specify where the data lives—Google Analytics, ad platform dashboards, your CRM, or marketing automation tool.
Now comes the detective work. Pull data from the past 90 days and look for patterns in how customers actually move through your funnel. Don't assume you know the journey—let the data show you. Export conversion paths from Google Analytics or your attribution tool. Look at the sequence of touchpoints that led to your last 20-30 conversions.
You'll likely discover unexpected patterns. Maybe customers who convert rarely come directly from ads. Perhaps they see a LinkedIn ad, visit your blog three times over two weeks, sign up for your email list, then convert after a nurture sequence. Or maybe your journey is simpler: Google search to landing page to conversion within the same session.
Document the most common paths you discover. A B2B SaaS company might find this typical journey: LinkedIn ad impression → blog article visit → email signup → nurture email sequence → demo request → sales call → conversion. An e-commerce brand might see: Facebook ad click → product page view → abandoned cart → retargeting ad → purchase.
Create a visual map of these journeys. You don't need fancy software—a simple flowchart in Google Slides works perfectly. This map becomes your reference point for every attribution decision you'll make. It shows you which touchpoints exist, where they fall in the journey, and how they connect to each other.
The key insight from this step: your customer journey is probably more complex than you thought. That complexity is exactly why attribution matters. Without it, you're only seeing fragments of the story.
Step 2: Choose Your Attribution Model Type
Now that you know your touchpoints, you need to decide how to distribute credit among them. Attribution models fall into two categories: single-touch and multi-touch. Each has specific use cases, and choosing wrong can lead to terrible budget decisions. Understanding the types of marketing attribution models available is essential before making your selection.
Single-touch models assign 100% of the credit to one touchpoint. First-touch attribution gives all credit to the channel that introduced the customer to your brand. If someone discovered you through a Facebook ad, then visited your site five more times through different channels before converting, Facebook gets 100% credit. This model favors awareness channels and helps you understand what's filling your pipeline.
Last-touch attribution does the opposite—it credits the final touchpoint before conversion. If that same customer converted after clicking a Google search ad, Google gets 100% credit. This model favors bottom-funnel channels and shows you what's closing deals. Most ad platforms use last-touch by default, which is why they often overestimate their own importance.
Multi-touch models distribute credit across multiple touchpoints. Linear attribution divides credit equally among all touches. If a customer had five touchpoints, each gets 20% credit. This model acknowledges that every interaction matters but doesn't distinguish between awareness and conversion moments. Many marketers turn to linear model marketing attribution software to implement this approach effectively.
Time-decay attribution gives more weight to recent touchpoints. The logic: interactions closer to conversion have more influence on the decision. A typical time-decay model might give 40% credit to the last touch, 30% to the second-to-last, 20% to the third, and 10% to earlier touches.
Position-based (also called U-shaped) attribution emphasizes the first and last touches while distributing remaining credit to middle touchpoints. A common split is 40% to first touch, 40% to last touch, and 20% divided among everything in between. This model recognizes that discovery and conversion moments are most critical.
So which model should you choose? Use single-touch models when your sales cycle is short (under two weeks) and involves few touchpoints. E-commerce, local services, and impulse purchases often fit this category. Start with last-touch to understand what's driving immediate conversions, then compare it to first-touch to see what's building awareness.
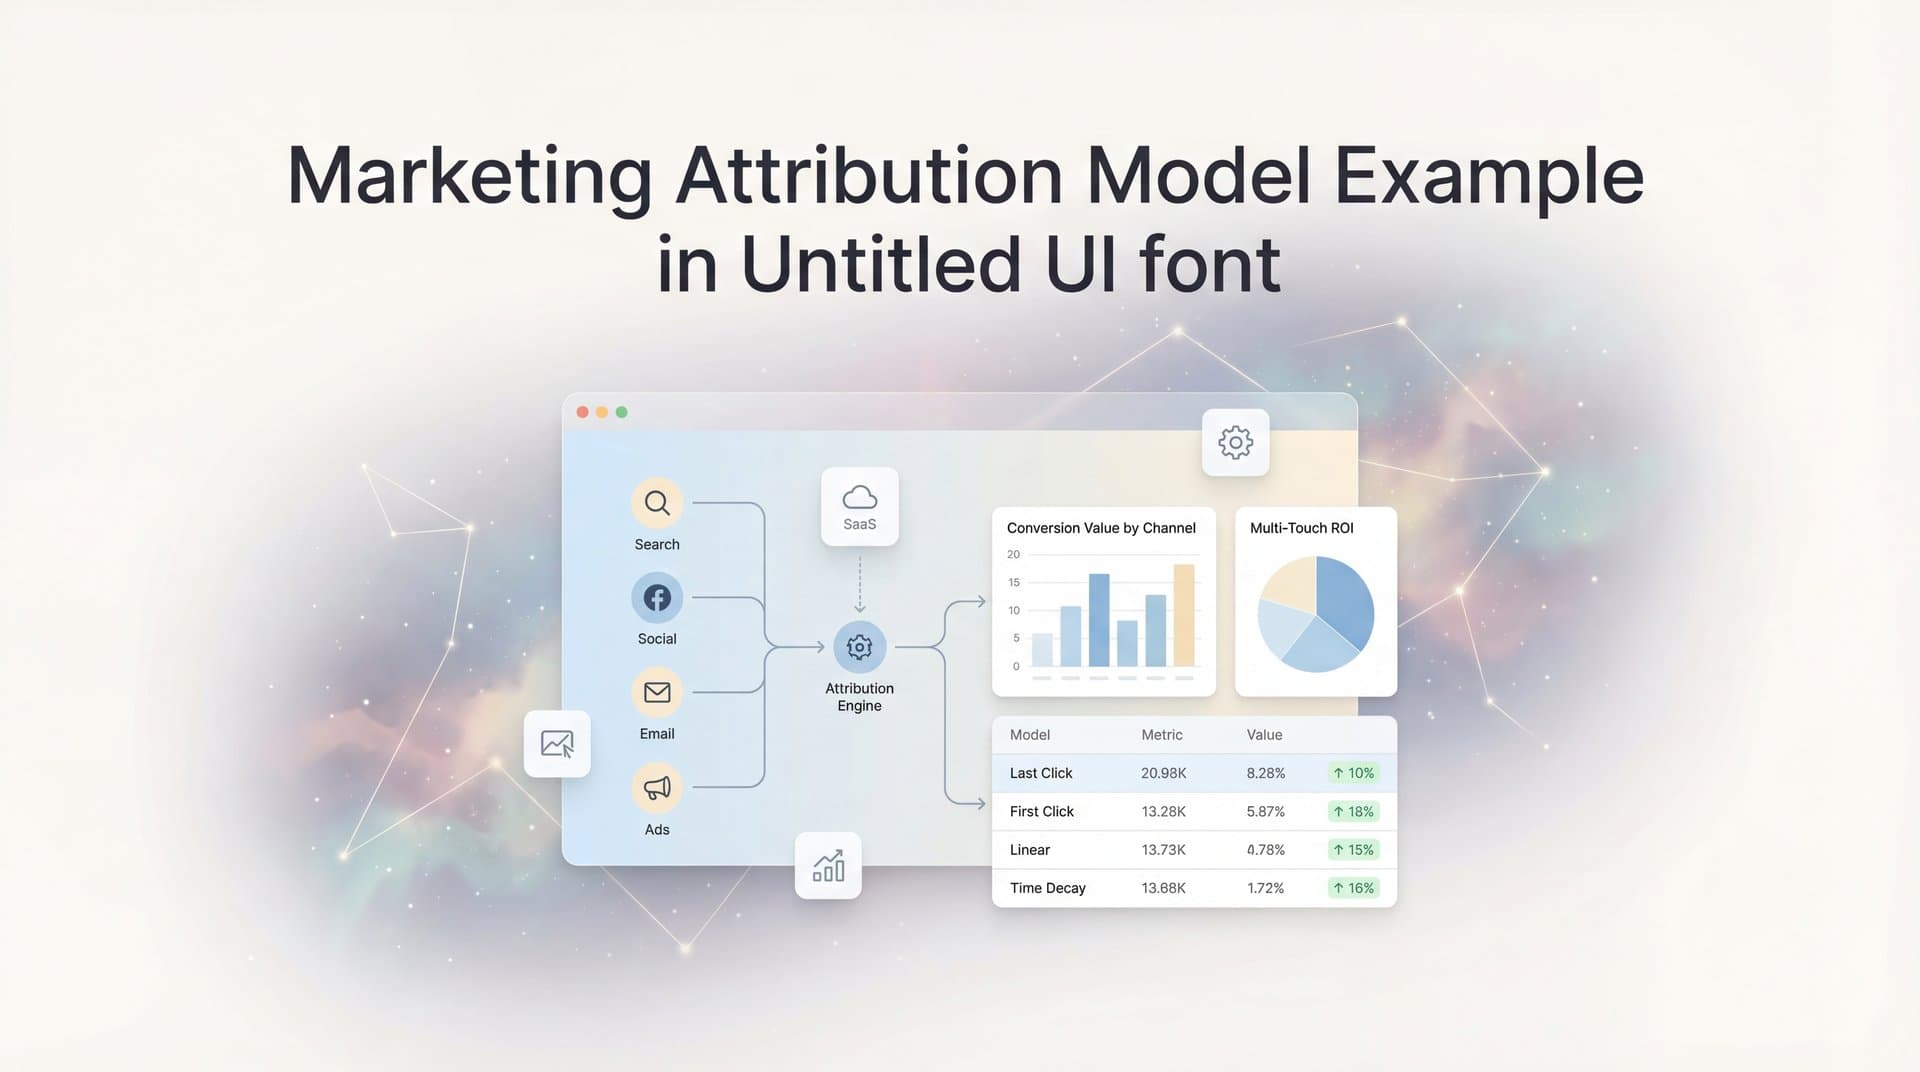
Use multi-touch models when your sales cycle is longer, involves multiple touchpoints, and requires nurturing. B2B SaaS, high-ticket services, and complex purchases need multi-touch marketing attribution software. Start with linear to get a balanced view, then experiment with time-decay or position-based as you gather more data.
Here's why model choice matters. Imagine a customer's journey generates a $10,000 deal through these touchpoints: LinkedIn ad → blog visit → email signup → webinar attendance → demo request → Google search → conversion. Under first-touch attribution, LinkedIn gets $10,000 credit. Under last-touch, Google gets it all. Under linear, each of the six touchpoints gets $1,667. Under position-based, LinkedIn gets $4,000, Google gets $4,000, and the middle four touchpoints split $2,000.
Same customer. Same revenue. Completely different conclusions about which channels are working. This is why comparing multiple models reveals the truth—no single model tells the complete story.
Step 3: Set Up Your Tracking Infrastructure
Attribution only works if you can actually track the customer journey. This step determines whether your attribution model will be accurate or just expensive guesswork. You need three components: consistent campaign tagging, reliable data capture, and connected systems.
Start with UTM parameters. These are the tags you add to every campaign URL that tell analytics tools where traffic came from. Create a naming convention document and stick to it religiously. Use lowercase, avoid spaces, and be specific. A good UTM structure looks like this: utm_source=facebook, utm_medium=paid_social, utm_campaign=q1_lead_gen, utm_content=video_ad_v2.
Build a UTM template in a spreadsheet. List all your active channels, campaign types, and content variations. Generate UTM parameters for each combination using Google's Campaign URL Builder or a spreadsheet formula. Share this document with everyone who creates campaigns. Inconsistent tagging—like using "Facebook" in one campaign and "facebook" in another—will fragment your attribution data and make accurate analysis impossible.
Next, implement server-side tracking. Browser-based tracking (like standard Google Analytics or Meta Pixel) faces increasing limitations. iOS privacy restrictions, ad blockers, and cookie restrictions mean you're missing 20-40% of your actual traffic. Server-side tracking captures events on your server before they reach the browser, giving you more complete data.
Most marketing attribution modeling software handles server-side tracking automatically. If you're building a custom solution, you'll need to configure your server to send events to your analytics platform through an API. This requires developer support but dramatically improves data accuracy—especially for mobile traffic and users with strict privacy settings.
Now connect your systems. Your ad platforms, website analytics, CRM, and email marketing tool need to share data. At minimum, ensure conversion events from your website flow back to your ad platforms. This is called conversion sync, and it helps ad algorithms optimize better while giving you complete attribution data.
Set up integrations between your CRM and marketing tools. When a lead converts to a customer in your CRM, that information should flow back to your attribution system. This closes the loop between marketing activity and actual revenue—not just leads or signups.
Before launching your attribution analysis, run verification tests. Create a test campaign with a unique UTM parameter. Click through it yourself. Check if the UTM data appears correctly in your analytics. Submit a test conversion. Verify that the conversion appears in your attribution report with the correct source information. Test each major channel this way—paid search, paid social, email, organic. If tracking breaks anywhere, fix it before proceeding.
One critical verification: test cross-device tracking. Start a journey on mobile, continue it on desktop, and complete a conversion. Check if your attribution system connects both sessions to the same user. Many attribution failures happen because systems can't follow users across devices.
Step 4: Build Your First Attribution Report
You've mapped your touchpoints, chosen a model, and verified your tracking. Now you'll build an actual attribution report that shows which channels drive results. This is where theory becomes actionable data. Understanding the power of marketing attribution reports will help you extract maximum value from your analysis.
First, set your attribution window—the lookback period that determines how far back you'll credit touchpoints. For most businesses, 30-90 days works well. If your sales cycle is under two weeks, use a 30-day window. If customers research for months before buying, extend it to 90 days or more. The window should match your typical time from first touch to conversion.
Pull your conversion data. Export all conversions from the past 30-90 days, depending on your chosen window. Include the conversion date, conversion value, and user identifier (cookie ID, email, or customer ID). You need enough conversions to identify patterns—aim for at least 30-50 conversions in your analysis period.
Now map the touchpoints for each conversion. This is the heavy lifting. For each converted customer, list every marketing touchpoint they encountered within your attribution window. Pull this from your analytics platform, CRM, or attribution tool. Your data should look like this:
Customer A ($5,000 deal): LinkedIn ad → blog visit (organic) → email signup → nurture email → demo request
Customer B ($3,000 deal): Google search (organic) → product page → email signup → promotional email → conversion
Customer C ($8,000 deal): Facebook ad → blog visit → Google search (branded) → pricing page → sales call → conversion
Apply your chosen attribution model to distribute credit. Let's use linear attribution for Customer A's $5,000 deal with five touchpoints. Each touchpoint receives $1,000 credit: LinkedIn ad ($1,000), blog visit ($1,000), email signup ($1,000), nurture email ($1,000), demo request ($1,000).
Repeat this calculation for every conversion in your dataset. Then aggregate the results by channel. Sum all the attributed revenue for LinkedIn ads across all customers. Do the same for organic search, email, Facebook ads, and every other channel. You now have a channel-level attribution report showing exactly how much revenue each channel contributed.
Calculate your attribution metrics. For each channel, compute total attributed revenue, number of attributed conversions, and cost per attributed conversion. This last metric is critical—it shows whether you're getting positive ROI. If you spent $2,000 on LinkedIn ads and they generated $8,000 in attributed revenue, you're winning. If you spent $5,000 for $3,000 attributed revenue, you have a problem.
Create a simple visualization. A bar chart showing attributed revenue by channel makes patterns immediately obvious. You'll quickly see which channels punch above their weight and which ones underperform. This becomes your baseline for optimization decisions.
The key insight from your first report: the channels you thought were working might not be your top performers. And channels you considered secondary might be driving more revenue than you realized. This is why attribution matters—it replaces assumptions with evidence.
Step 5: Compare Models to Find Hidden Insights
Here's where attribution gets powerful. A single model shows you one perspective. Comparing multiple models reveals the complete picture of how your marketing actually works. Channels that dominate in one model might disappear in another—and those discrepancies tell you exactly what role each channel plays. A thorough comparison of attribution models is essential for uncovering these insights.
Take your existing conversion data and run it through at least two additional attribution models. If you started with linear attribution, now calculate first-touch and last-touch for the same dataset. Use the same conversions, same touchpoints, same time period—only change how you distribute credit.
Create a comparison table with channels as rows and attribution models as columns. For each channel, show the attributed revenue under each model. You'll immediately spot patterns. Channels that rank high in first-touch but low in last-touch are awareness drivers—they introduce customers to your brand but don't close deals. Channels that rank low in first-touch but high in last-touch are converters—they capture demand that other channels created.
Consider this example. Facebook ads generate $45,000 attributed revenue under first-touch attribution, $12,000 under linear, and $3,000 under last-touch. What does this tell you? Facebook is excellent at awareness and initial discovery but rarely closes deals. Customers see your Facebook ad, get interested, then convert through other channels later. This is valuable information—it means Facebook deserves budget, but you shouldn't expect it to show strong last-click performance in your ad dashboard.
Now look at Google search. It shows $8,000 under first-touch, $15,000 under linear, and $32,000 under last-touch. Google search is a closer—customers use it when they're ready to convert. They've already learned about you elsewhere, and they're coming back through search to take action. This channel deserves credit for conversions, but it's often capturing demand created by your awareness channels.
Email marketing might show consistent performance across all models: $18,000 first-touch, $22,000 linear, $19,000 last-touch. This suggests email plays a role throughout the journey—it nurtures awareness, maintains engagement, and triggers conversions. Channels with consistent cross-model performance are your workhorses.
Use these insights to reframe your channel strategy. Don't cut awareness channels just because they don't show last-touch conversions. Don't over-invest in bottom-funnel channels without feeding them with top-funnel traffic. The healthiest marketing mix includes channels that excel at different stages.
Look for surprising patterns. Maybe your webinar shows up frequently in converting journeys but gets little credit under last-touch because customers convert days later through other channels. That webinar is more valuable than last-touch attribution suggests. Or perhaps your retargeting ads appear in nearly every conversion path—they're not discovering new customers, but they're essential for closing deals.
Document these insights in a channel role matrix. List each channel and its primary function: awareness driver, consideration builder, or conversion closer. Some channels might play multiple roles. This matrix becomes your strategic guide for budget allocation and campaign planning. You'll stop expecting every channel to do everything and start building campaigns that work together across the funnel.
Step 6: Optimize Budget Based on Attribution Data
Attribution data is worthless if you don't act on it. This final step turns insights into improved performance. You'll identify undervalued channels, shift budget strategically, and create a feedback loop that makes your marketing more efficient over time. Platforms focused on marketing attribution and revenue tracking can automate much of this optimization process.
Start by calculating cost per attributed conversion for every channel. Take your total channel spend and divide it by the number of attributed conversions (or attributed revenue) from your chosen model. A channel that costs $50 per attributed conversion is more efficient than one costing $200—assuming conversion values are similar.
Identify undervalued channels. These are channels with strong attributed revenue but relatively low budget allocation. Perhaps email marketing drives $30,000 in attributed revenue but only costs $2,000 monthly to run. Or organic social generates $15,000 attributed revenue with minimal paid spend. These channels are working efficiently and might benefit from increased investment.
Identify overvalued channels. These show weak attributed performance despite significant spend. Maybe display ads cost $8,000 monthly but only generate $4,000 in attributed revenue across all models. Or a paid partnership drives traffic but rarely appears in converting customer journeys. These channels need optimization or budget reduction.
Make incremental changes. Don't slash budgets by 50% or double spend overnight. Shift 10-20% of budget from underperforming channels to high-performers. Monitor results for 2-4 weeks. Attribution patterns take time to stabilize, especially if your sales cycle is longer than a few days. Hasty changes based on one week of data often backfire.
Test new channel investments carefully. If your attribution data suggests organic search drives efficient conversions, consider investing in SEO. If webinars appear frequently in converting journeys, run more webinars. But start small—allocate 10-15% of your budget to the test, track attributed results, and scale only if performance justifies it.
Feed better conversion data back to your ad platforms. This is where attribution becomes a competitive advantage. Platforms like Meta and Google use conversion data to optimize their algorithms. If you're only sending them last-click conversions, they're optimizing for the wrong signal. Send them attributed conversions that reflect the full customer journey.
Conversion sync solves this problem. It takes your attribution data and sends enriched conversion events back to ad platforms. Instead of telling Meta "this ad got a last-click conversion," you tell it "this ad was part of a journey that generated $5,000 in revenue." Meta's algorithm uses this better data to find more high-value customers. Google does the same. The result: your ad platforms optimize for actual business outcomes, not just last-click activity.
Create a monthly attribution review process. Set a calendar reminder to pull attribution reports, compare models, and assess channel performance. Track how attributed revenue per channel changes over time. Look for trends—are certain channels improving? Declining? Staying consistent? Use these trends to guide quarterly budget planning.
Share attribution insights with your team. If you're working with agencies or freelancers, show them how their channels perform in your attribution model. This aligns everyone around real business outcomes rather than vanity metrics. An agency might celebrate 10,000 clicks, but if those clicks don't appear in attributed conversions, the celebration is premature.
Your Attribution Action Plan
You now have everything you need to build a working marketing attribution model. The difference between marketers who guess and marketers who know comes down to implementing these six steps. Start this week—even a basic attribution model beats no attribution at all.
Here's your quick-start checklist. First, list all your marketing channels in a spreadsheet. Include paid advertising, organic channels, email, social, and any offline touchpoints. Second, pick one attribution model to start with. If you're new to attribution, begin with last-touch to understand what's closing deals, then add first-touch to see what's building awareness. Third, verify that tracking works on every channel. Test your UTM parameters, confirm your pixels fire correctly, and ensure conversions appear in your analytics.
Fourth, run your first attribution report using the past 30-90 days of data. Pull conversions, map touchpoints, apply your model, and calculate attributed revenue by channel. Fifth, compare at least two attribution models side by side. Look for channels that perform differently across models—those discrepancies reveal how channels actually contribute to your results. Sixth, make one budget decision based on your attribution data. Shift 10-20% of spend from an underperforming channel to one that drives strong attributed results.
As you gather more data, evolve your approach. Start with simple single-touch models, then progress to multi-touch as you understand your customer journey better. Test different attribution windows to see how lookback period affects your insights. Experiment with position-based or time-decay models once you have enough conversion volume to make them meaningful. For a deeper dive into model selection, explore how different attribution models optimize ad campaigns in various scenarios.
The biggest mistake is waiting for perfect data before starting. Your tracking will never be flawless. Your attribution model will never capture every nuance. But a directionally accurate attribution model today is infinitely more valuable than a perfect model you'll build someday. Start with what you have, improve incrementally, and let data guide your decisions.
Platforms like Cometly can accelerate this entire process by automatically capturing touchpoints across your marketing channels, running multiple attribution models simultaneously, and feeding optimized conversion data back to your ad platforms. Instead of building spreadsheets and manually calculating attributed revenue, you get real-time attribution dashboards that show exactly which campaigns drive results. The AI analyzes patterns across thousands of customer journeys to identify high-performing ads and recommend budget optimizations—turning attribution from a monthly analysis project into a daily decision-making tool.
Ready to elevate your marketing game with precision and confidence? Discover how Cometly's AI-driven recommendations can transform your ad strategy—Get your free demo today and start capturing every touchpoint to maximize your conversions.