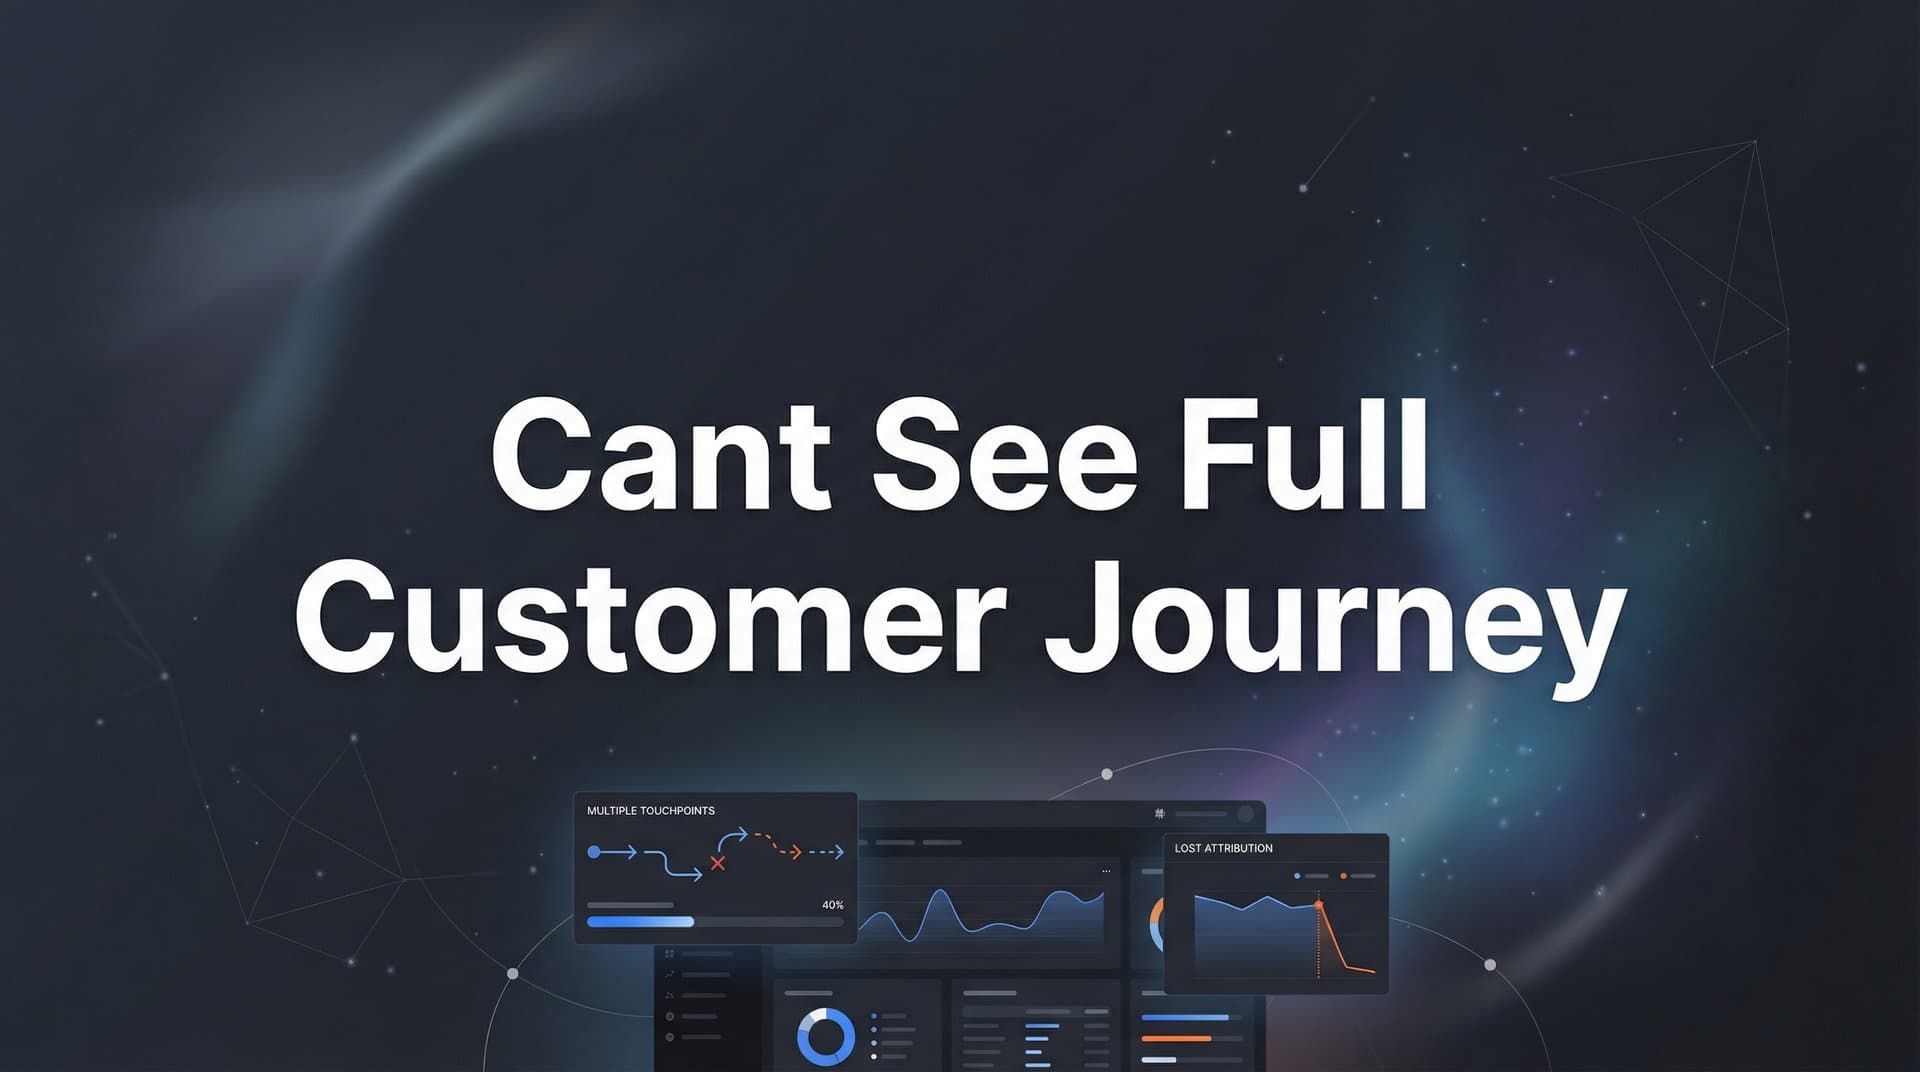
You're spending thousands on ads across Meta, Google, TikTok, and LinkedIn—but when you try to trace how a customer actually found you, converted, and became a paying client, the picture falls apart. Sound familiar?
If you can't see the full customer journey, you're essentially flying blind with your marketing budget. You might be killing campaigns that are actually working (just later in the funnel) or doubling down on channels that look good on paper but never convert to revenue.
This breakdown happens for predictable reasons: iOS privacy restrictions block browser tracking, ad platforms report in isolation (each claiming credit for the same conversion), and your CRM—where actual revenue lives—sits disconnected from your marketing data. The result? Decisions based on incomplete information and budgets flowing to the wrong places.
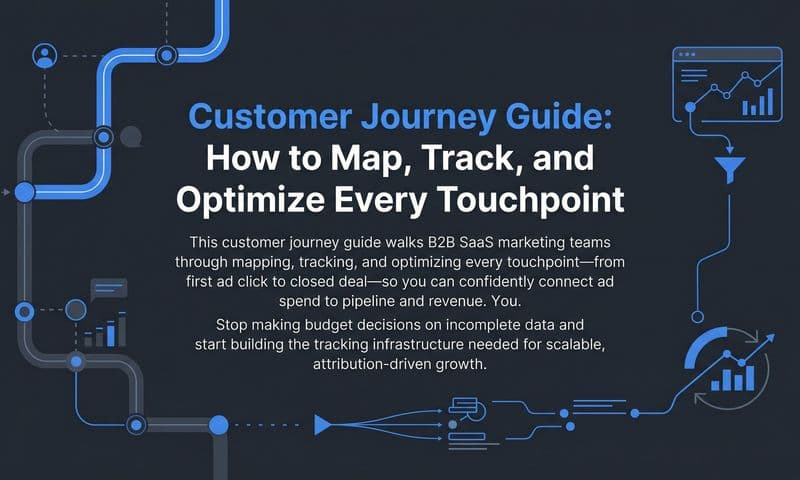
This guide walks you through exactly how to diagnose where your tracking breaks down and implement fixes that give you complete visibility from first ad click to closed deal. By the end, you'll have a clear action plan to capture every touchpoint and finally understand which marketing efforts actually drive your revenue.
Step 1: Audit Your Current Tracking Setup
Before you can fix what's broken, you need to see exactly where your tracking falls apart. Start by mapping every platform where you currently capture customer data.
List them out: Google Analytics 4, Meta Pixel, Google Ads conversion tracking, TikTok Pixel, LinkedIn Insight Tag, your CRM (HubSpot, Salesforce, Pipedrive), and any other analytics tools you use. Write down what each one tracks—ad clicks, page views, form submissions, purchases, deal stages.
Now comes the revealing part: trace a real customer journey through your systems. Pick a recent conversion and try to follow it backward. Where did they first click? What other touchpoints happened before they converted? Can you see their path across devices—mobile to desktop? Does your CRM show which marketing source brought them in?
Most marketers hit walls immediately. Common break points include:
Cross-device journeys: Someone clicks your Instagram ad on their phone during lunch, then converts on their laptop at work. Your tracking sees these as two different people.
iOS privacy restrictions: Apple's App Tracking Transparency framework blocks default tracking for users who opt out. If you rely solely on browser-based pixels, you're missing significant portions of your iOS traffic.
CRM disconnects: Your ad platforms show 50 conversions this month, but your CRM only shows 30 new contacts. Where did the other 20 go? And of those 30, which ones came from which campaigns?
Platform attribution conflicts: Meta claims 40 conversions, Google claims 35, LinkedIn claims 15. You only had 30 actual conversions. Each platform is taking credit using its own attribution window and methodology.
Document these gaps specifically. Don't just write "tracking is broken"—write "can't connect mobile ad clicks to desktop conversions" or "CRM deals not linked to original campaign source." This becomes your fix-it checklist.
Create a simple spreadsheet with three columns: Platform/Tool, What It Captures, What's Missing. Be brutally honest about the blind spots. If you can't see post-lead revenue data, write it down. If cross-device tracking doesn't work, acknowledge it.
Success indicator: You have a clear, written list of tracking blind spots and know exactly where customer journey data disappears. This audit typically reveals 3-5 major gaps that explain why you can't track customer journey accurately.
Step 2: Implement Server-Side Tracking
Here's why your current tracking fails: browser-based pixels depend on cookies and JavaScript that users can easily block. Ad blockers, privacy-focused browsers like Safari and Firefox, and iOS restrictions systematically prevent your tracking code from firing.
When someone opts out of tracking on iOS or uses an ad blocker, your Meta Pixel or Google tag simply doesn't work. The conversion happens, but your ad platform never knows about it. You lose attribution data and your campaign optimization suffers because algorithms can't learn from conversions they can't see.
Server-side tracking solves this by sending conversion data directly from your server to ad platforms, completely bypassing the browser. When a conversion happens, your server sends the event data through a secure API connection. No cookies required, no browser restrictions to worry about.
Start with Meta's Conversions API. Set up a server endpoint that receives conversion events from your website or app, then forwards them to Meta's servers. You'll need to capture key parameters: event name (Purchase, Lead, AddToCart), event time, user information (hashed email, phone number for privacy compliance), and the Facebook Click ID (fbclp) or Browser ID (fbp) to match the event to the original ad click.
The technical implementation varies based on your stack, but most marketing attribution platforms handle this automatically. The critical piece: your server must capture the conversion event and send it to Meta's API within a reasonable timeframe, ideally immediately.
Next, implement Google Ads Enhanced Conversions. This works similarly—you send hashed customer information (email, phone number, address) along with conversion events. Google matches this data to signed-in users, dramatically improving attribution accuracy even when cookies are blocked.
The difference you'll see is immediate. Conversions that previously disappeared due to iOS restrictions or ad blockers now appear in your ad platform reporting. Your conversion counts increase, but more importantly, they become accurate. You're no longer flying blind on a significant portion of your traffic.
Success indicator: Your ad platform conversion counts increase by 20-40% as you capture events that browser-based tracking missed. Your data matches reality more closely, and campaign optimization improves because algorithms can learn from the complete dataset.
Step 3: Connect Your CRM to Your Marketing Data
Your ad platforms show leads. Your bank account shows revenue. The gap between these two metrics is where most marketing budgets get wasted.
Think about it: Meta reports 100 leads this month at $50 each, total spend $5,000. Looks efficient. But when you check your CRM, only 10 of those leads became paying customers worth $500 each, total revenue $5,000. You broke even, but you have no idea which campaigns drove the actual customers versus the tire-kickers.
This is the revenue gap problem, and it's why you can't see the full customer journey. The solution: integrate your CRM with your attribution system to track post-lead events.
Start by ensuring every lead in your CRM includes the original marketing source data. When someone fills out a form on your website, capture the UTM parameters (source, medium, campaign, content, term) and pass them to your CRM as custom fields. If you're using HubSpot, Salesforce, or Pipedrive, set up these fields now.
But source data alone isn't enough. You need to track the full lifecycle. Map your CRM stages to meaningful business events: Marketing Qualified Lead (MQL), Sales Qualified Lead (SQL), Opportunity Created, Closed Won, and the revenue amount. Understanding the stages of customer lifecycle helps you define these events properly.
Now connect your CRM to your attribution platform. Most modern attribution tools offer native integrations with major CRMs. Once connected, they automatically pull in deal stage changes and revenue data, then match them back to the original marketing touchpoints.
Here's what this looks like in practice: A prospect clicks your LinkedIn ad on January 5th. They visit your site, download a guide, and become an MQL. Your sales team qualifies them as an SQL on January 12th. They move to Opportunity on January 20th. They close as a $10,000 annual contract on February 3rd.
With CRM integration, you can now trace that $10,000 back to the specific LinkedIn ad, campaign, and audience that started the journey. You see the full 29-day path from first click to closed revenue.
Multiply this across all your deals, and patterns emerge. You might discover that Google Search campaigns generate fewer leads than Meta, but those leads close at 3x the rate and 2x the deal size. Without CRM integration, you'd never see this—you'd just see lead volume and might cut the Google budget.
Success indicator: You can open any closed deal in your CRM and instantly see the complete marketing journey—every ad click, email open, website visit, and content download that led to that revenue. Your marketing reports now show revenue attribution, not just lead attribution.
Step 4: Unify Cross-Platform Touchpoints
Here's a common scenario: You run ads on Meta, Google, TikTok, and LinkedIn. Each platform's dashboard shows strong performance. Meta claims 50 conversions this month. Google claims 45. TikTok claims 30. LinkedIn claims 20. That's 145 total conversions.
Your actual conversion count? 60.
Each ad platform uses its own attribution window and methodology, taking credit for conversions that other platforms also claim. This isn't dishonesty—it's how platform-specific tracking works. But it makes your data useless for budget decisions.
The solution: unify all touchpoints in a centralized attribution platform that sees the complete picture.
Start with UTM tracking standards. Every single campaign link across every platform must include consistent UTM parameters. Create a naming convention and stick to it religiously. For example: utm_source=facebook, utm_medium=paid_social, utm_campaign=q1_awareness, utm_content=video_ad_v2.
This consistency is critical because it's how your attribution platform identifies and connects touchpoints. If one campaign uses "facebook" and another uses "meta" or "fb," they won't be properly grouped. Document your UTM structure and enforce it across your team.
Next, implement a centralized attribution platform that ingests data from all sources. This means connecting Meta, Google, TikTok, LinkedIn, your email platform, your website analytics, and your CRM to a single system that stitches together the complete customer journey. The right customer journey tracking software makes this integration seamless.
These platforms use identity resolution—matching anonymous website visitors to known contacts across devices and touchpoints. When someone clicks your Meta ad on mobile, visits your site on desktop later, downloads a guide, and eventually converts, the platform connects all these events to the same person.
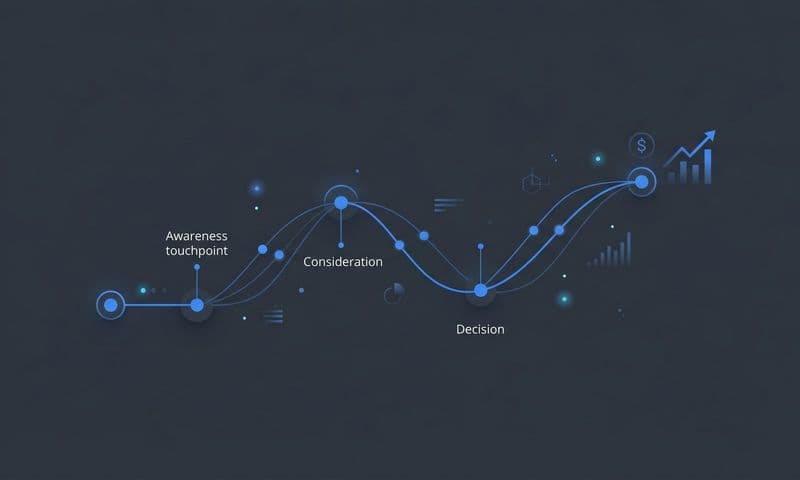
The result: you see multi-touch journeys in one dashboard. A typical path might look like: TikTok video view → Google Search click → Email open → LinkedIn ad click → Website visit → Conversion. Each touchpoint gets appropriate credit based on its role in the journey.
This unified view reveals insights impossible to see in siloed platform reports. You might discover that TikTok rarely gets last-click credit but frequently appears early in high-value customer journeys—meaning it's a powerful awareness driver that platform-level reporting undervalues.
Or you might find that LinkedIn appears in almost every enterprise deal journey, even though it shows fewer conversions than Meta. Without unified tracking, you'd never see this pattern and might cut LinkedIn budget based on surface-level metrics.
Success indicator: You see complete multi-touch journeys in one dashboard, not fragmented reports from each platform. Your total conversion count matches reality, and you can confidently answer "what's the real ROI of each channel?" based on complete data.
Step 5: Choose and Apply the Right Attribution Model
Now that you can see the full customer journey, you need to decide how to assign credit. This is where attribution models come in, and choosing the wrong one can lead to terrible budget decisions.
First-click attribution gives all credit to the first touchpoint. If someone clicks your Facebook ad, then later clicks a Google ad and converts, Facebook gets 100% credit. This model overvalues awareness campaigns and undervalues closing tactics.
Last-click attribution does the opposite—all credit goes to the final touchpoint before conversion. Google gets 100% credit in the example above. This model overvalues bottom-funnel tactics and makes it look like awareness campaigns don't work, even when they're essential to starting the journey.
Multi-touch attribution distributes credit across all touchpoints based on their role. There are several approaches: linear (equal credit to all), time decay (more credit to recent touchpoints), position-based (more credit to first and last), or algorithmic (data-driven credit based on actual influence). Understanding marketing attribution valuing the customer journey helps you make smarter model choices.
For longer B2B sales cycles, multi-touch attribution reveals the true value of awareness campaigns. When deals take 60-90 days to close with 10-15 touchpoints along the way, last-click attribution makes your early-stage campaigns look worthless. Multi-touch shows their real contribution.
Here's how to choose: Consider your typical sales cycle length and complexity. If you sell low-cost products with short consideration periods (hours or days), last-click might work fine—the journey is simple enough that the final touchpoint genuinely deserves most credit.
If you have longer sales cycles with multiple touchpoints (weeks or months), multi-touch attribution is essential. Start with a position-based model that gives 40% credit to the first touchpoint, 40% to the last, and distributes the remaining 20% among middle touches. This balances awareness and conversion efforts.
Test different models on the same data to see how credit shifts. Run reports comparing first-click, last-click, and multi-touch attribution for the same time period. Watch how channel performance changes. If a channel looks great in last-click but terrible in first-click, it's a bottom-funnel closer. If the reverse is true, it's an awareness driver.
This exercise reveals hidden high-performers. You might discover that organic social or content marketing rarely gets last-click credit but frequently initiates journeys that convert weeks later. Without testing multiple models, you'd never see this value and might cut those programs.
Success indicator: Your attribution model accurately reflects how your customers actually buy, not just platform defaults. When you analyze channel performance, the results make intuitive sense based on each channel's role in your funnel. You can confidently explain why you're allocating budget the way you are.
Step 6: Feed Better Data Back to Ad Platforms
Here's the final piece that most marketers miss: your ad platform algorithms optimize based on the conversion data you send them. If you're only sending lead events, they optimize for more leads—regardless of quality. If you're sending revenue data, they optimize for customers who actually pay.
Think about it: Meta's algorithm learns from every conversion you report. If you tell it "this person converted," it finds more people like them. But if that conversion was a junk lead who never bought anything, you're training the algorithm to find more junk leads.
The solution: sync your enriched, CRM-verified conversion data back to ad platforms. This is called conversion sync or enhanced conversion tracking, and it transforms campaign performance.
Start by identifying your most valuable conversion events. For most businesses, this isn't "Lead" or "Sign Up"—it's "Qualified Lead," "Opportunity Created," or "Purchase." These events happen later in the funnel but represent real business value.
Set up your attribution platform to automatically send these high-value events back to Meta, Google, and other platforms when they occur. When a lead becomes qualified in your CRM, fire a "Qualified Lead" event to Meta. When a deal closes, fire a "Purchase" event with the actual revenue value.
This requires your CRM to be connected to your attribution system, which then connects to ad platform APIs. The data flow looks like: Customer converts → CRM updated → Attribution platform detects change → Conversion event sent to ad platforms.
The impact is significant. Ad platform algorithms now optimize for actual customers, not just form fills. Your lookalike audiences improve because they're based on paying customers, not tire-kickers. Your campaign performance increases because the algorithm learns what real success looks like.
You'll also see more accurate conversion values in your ad platform reports. Instead of showing every lead as equal, your reports now reflect the actual revenue those leads generated. This makes ROAS calculations meaningful—you're measuring real return, not just lead volume.
One critical note: implement this gradually. If you suddenly start sending completely different conversion events to ad platforms, their algorithms need time to relearn. Expect a brief adjustment period (7-14 days) where performance might fluctuate as the systems adapt to the new data.
Success indicator: Ad platform performance improves over 2-4 weeks because algorithms optimize for customers who actually pay, not just form fills. Your cost per qualified lead or cost per customer decreases as targeting becomes more precise. Lookalike audiences perform better because they're based on real customer data.
Your Path to Complete Journey Visibility
Let's recap what you've built by working through these six steps systematically.
You started by auditing your current setup and identifying specific blind spots—the exact places where customer journey data disappears. You implemented server-side tracking to bypass browser limitations and capture conversions that iOS restrictions and ad blockers previously hid. You connected your CRM to your marketing data, enabling revenue-level attribution that shows which campaigns drive actual customers, not just leads.
You unified cross-platform touchpoints in a centralized system, eliminating the confusion of conflicting platform reports and revealing true multi-touch journeys. You chose an attribution model that reflects how your customers actually buy, ensuring credit flows to channels based on their real contribution. Finally, you set up conversion sync to feed better data back to ad platforms, improving targeting and optimization by training algorithms on actual customer behavior.
The result: you can now trace any closed deal back to its origin—the specific ad, campaign, and channel that started the journey, plus every touchpoint along the way. No more guessing which campaigns actually work. No more killing winners or scaling losers based on incomplete data.
Here's your quick implementation checklist:
✓ Audited current tracking and identified specific blind spots
✓ Implemented server-side tracking to bypass browser limitations
✓ Connected CRM to marketing data for revenue-level attribution
✓ Unified cross-platform touchpoints in one centralized view
✓ Applied appropriate attribution model for your sales cycle
✓ Set up conversion sync to feed better data back to ad platforms
Start with Step 1 today. Block two hours to audit your current setup thoroughly. Document every gap you find. Then work through each subsequent step systematically over the coming weeks. The clarity you gain will transform how you allocate your marketing budget—shifting spend from channels that look good on paper to those that actually drive revenue.
Ready to elevate your marketing game with precision and confidence? Discover how Cometly's AI-driven recommendations can transform your ad strategy—Get your free demo today and start capturing every touchpoint to maximize your conversions.