At its core, the conversion rate for sales is the percentage of potential customers who complete a desired action, turning from a prospect into a paying customer. Think of it as the ultimate scorecard for your business's effectiveness—measuring how well you turn interest into revenue.
Defining the Ultimate Business Health Metric
 Mastering the Conversion Rate for Sales to Drive Revenue
Let's imagine your business is a brick-and-mortar store. Every person who walks through the door is like your website traffic or your lead list. The sales conversion rate is simply the measure of how many of those visitors actually buy something before walking out.
It's arguably the single most important metric for gauging the health of your entire sales and marketing operation.
This number cuts straight through the noise of vanity metrics like clicks, impressions, or social media followers. It answers the one question that really matters: are we actually convincing people to buy? A high conversion rate means your marketing message, product, and sales process are all hitting the mark.
On the flip side, a low rate is a massive red flag. It’s a clear sign of friction somewhere in your system. It could be a clunky checkout process, unconvincing product pages, or a major disconnect between your ads and what people see when they land on your site. Every single percentage point represents real money being left on the table.
Why This Metric Is Non-Negotiable
For any business serious about sustainable growth, tracking your sales conversion rate isn't optional. It gives you a clear, quantifiable way to measure the impact of everything you do. Without it, you’re flying blind, unable to know if the changes you're making are helping or hurting your bottom line.
A business without a clear view of its conversion rate is like a ship without a rudder. You might be moving, but you have no control over your direction or destination. It’s the compass that guides every marketing and sales decision.
Today's customer journey is more complicated than ever. A customer might see your ad on Instagram, search for your brand on Google a week later, and finally make a purchase through an email link. This makes tracking the true sales conversion rate a bit tricky, which is why understanding your overall conversion rate in marketing is such a crucial first step.
This metric is your primary diagnostic tool. It allows you to:
- Evaluate Marketing ROI: Figure out which channels and campaigns are delivering actual paying customers, not just clicks and eyeballs.
- Identify Funnel Weaknesses: Pinpoint the exact moments where prospects are losing interest and dropping off.
- Optimize the Customer Experience: Use real data to smooth out friction points and make it dead simple for people to buy.
- Forecast Revenue Accurately: Build reliable sales projections based on performance data you can actually trust.
Ultimately, a laser focus on this single rate shifts your team's entire mindset from just generating activity to driving tangible business results.
Calculating Your Sales Conversion Rate Accurately
 Mastering the Conversion Rate for Sales to Drive Revenue
Talking about conversion rates is one thing, but actually putting them to work requires the right tools and a clear formula. Don't worry, it's simpler than you might think. It all comes down to a single, fundamental formula that tells you how well you’re turning interest into action.
At its core, the math looks like this:
Sales Conversion Rate = (Total Number of Sales / Total Number of Visitors) x 100
This equation gives you a clear percentage showing how many of your visitors actually completed a purchase. For example, if your website got 10,000 visitors last month and you made 200 sales, your calculation would be (200 / 10,000) x 100.
The result? A 2% sales conversion rate.
The Importance of Defining Your Conversion Event
While the basic formula is straightforward, its accuracy lives or dies by one critical factor: a crystal-clear definition of what a "conversion" actually means to your business. If your definition is fuzzy, your data will be almost useless.
A conversion isn't just a number; it's the specific, measurable action that signifies a prospect has moved from one stage of your funnel to the next. Without a clear definition, you’re measuring noise, not progress.
For an e-commerce store, a conversion is almost always a completed purchase. Simple enough. But for a B2B SaaS company, a conversion could be any number of different actions:
- Demo Request: A prospect fills out a form to see the software in action.
- Trial Signup: A user signs up for a free trial period.
- Paid Subscription: A trial user or new lead signs a contract and becomes a paying customer.
Defining this single, specific action is the absolute first step toward trustworthy metrics. This clarity ensures everyone on your team is measuring the same outcome, which is the foundation for a reliable conversion tracking setup.
Calculating Rates for Specific Funnel Stages
The real power of this metric is unlocked when you start applying it to different stages of your sales funnel. This is where you can pinpoint exactly where your process is winning and where it’s breaking down, diagnosing friction points with surgical precision.
Most funnels have several key conversion points, and tracking each one tells a different story. The table below breaks down the most common formulas you'll need.
Essential Sales Funnel Conversion Formulas
At the Top of Funnel (TOFU) stage, the key conversion metric is Lead Conversion Rate, calculated as (Total Leads / Total Visitors) x 100, and it shows how well your traffic is turning into actual leads.
In the Middle of Funnel (MOFU) stage, one important metric is the MQL-to-SQL Rate, calculated as (Total SQLs / Total MQLs) x 100, which tells you how effectively your marketing-qualified leads are becoming sales-qualified leads.
Also in the Middle of Funnel (MOFU) stage, the Lead-to-Opportunity Rate is calculated as (Total Opportunities / Total Leads) x 100, and it measures how often leads are progressing into real sales opportunities in your pipeline.
At the Bottom of Funnel (BOFU) stage, the main metric is Opportunity-to-Close Rate, calculated as (Total Closed Deals / Total Opportunities) x 100, and it shows how well your sales team is converting opportunities into closed deals.
Across the overall funnel, the Overall Sales Conversion Rate is calculated as (Total Closed Deals / Total Leads) x 100, and it gives you a complete view of how efficiently leads turn into customers from start to finish.
By using these stage-specific formulas, you can move from a vague, high-level number to a diagnostic tool that tells you exactly where to focus your energy.
Let's walk through an example to see this in action. Imagine a fictional SaaS company called "DataDrive Inc."
Example Scenario: DataDrive Inc.
Last quarter, DataDrive Inc. generated 5,000 new leads from various marketing campaigns. Their sales team qualified 500 of these as sales-qualified opportunities (SQLs), and they ultimately closed deals with 100 new customers.
Using this data, we can calculate the conversion rates for each stage:
- Lead-to-Opportunity Rate: This measures how effectively the marketing and sales teams turn initial interest into a real sales conversation.
- Formula: (Total Opportunities / Total Leads) x 100
- Calculation: (500 SQLs / 5,000 Leads) x 100 = 10%
- Opportunity-to-Close Rate: Often just called the "close rate," this metric shows how effective the sales team is at turning qualified prospects into paying customers.
- Formula: (Total Closed Deals / Total Opportunities) x 100
- Calculation: (100 Deals / 500 SQLs) x 100 = 20%
- Paid Search (e.g., Google Ads): This channel often boasts one of the highest conversion rates, averaging around 3.5% for e-commerce. Why? Because users are actively hunting for a solution, signaling strong commercial intent.
- Email Marketing: A consistently strong performer, especially when you're marketing to a list of nurtured leads who already know and trust your brand.
- Organic Search (SEO): People who find you through organic search are often looking for specific information, which makes them high-quality prospects ready to be convinced.
- Social Media: This channel tends to have a lower conversion rate, often around 1.9%. Users are usually in discovery or entertainment mode, not actively looking to make a purchase.
- Set Realistic Goals: If you're in an industry with a 3% average, aiming for 4% is a tough but achievable goal. Shooting for 20% is probably setting yourself up for disappointment.
- Identify Underperforming Channels: Is your paid search conversion rate stuck at 1% while the industry average is 3.5%? That’s a massive red flag telling you to dig into your ad copy, landing pages, and keyword strategy.
- Justify Marketing Spend: Showing that your conversion rates are hitting or beating industry standards is a powerful way to make the case for more investment in your marketing strategies.
- Initial Discovery: A potential customer, Sarah, first sees an ad for your product while scrolling Facebook on her phone during her lunch break. She’s intrigued but not quite ready to buy.
- Research Phase: A few days later, sitting at her laptop, she remembers your brand and Googles it. She clicks on an organic search result, reads a few blog posts, and compares your features with competitors.
- Final Conversion: A week later, an abandoned cart email lands in her inbox. She opens it on her tablet, clicks the link, and finally completes the purchase.
- Customer Testimonials: Pull quotes from happy customers that highlight specific, positive outcomes.
- Case Studies: Show, don't just tell. Walk through detailed examples of how you solved a real problem for a client, complete with hard data.
- Reviews and Ratings: Displaying star ratings gives visitors instant validation before they've even read a word.
- Trust Badges: Use security seals and payment logos (like Visa or PayPal) to reassure visitors that their information is safe.
- Offer a Guest Checkout: Forcing people to create an account before they can buy is a classic conversion killer. Always give them a guest option.
- Minimize Form Fields: Only ask for what you absolutely need to process the order. Do you really need their phone number right now? If not, ditch the field.
- Provide Multiple Payment Options: Don't make them hunt for their credit card if they'd rather use PayPal or Apple Pay. Cater to their preferences.
- Display a Progress Indicator: Show customers exactly where they are in the process (e.g., "Step 1 of 3"). It manages expectations and reduces anxiety.
- Server-Side Tracking: This is a huge one. It captures data directly from the server, which means it bypasses browser limitations like ad blockers and cookie restrictions. The result? More of your conversion data is actually captured, giving you a much more accurate picture.
- Multi-Touch Attribution Models: Instead of giving 100% of the credit to the last click, these models distribute credit across multiple touchpoints. This gives you a far more realistic view of how your marketing efforts collectively influenced a purchase decision over time.
- High-Volume E-commerce: If you're running a store with thousands of visitors a day, looking at your numbers weekly or even daily is a smart move. This lets you catch trends early, spot problems with new campaigns, and react fast when performance changes.
- B2B or Long Sales Cycles: For a SaaS company or a service business where a deal takes weeks or months to close, a monthly or quarterly check-in makes a lot more sense. This gives real trends enough time to surface above the day-to-day noise.
This granular approach reveals something important. While DataDrive’s sales team has a solid 20% close rate, there might be a problem with the initial lead qualification process, where only 10% of leads ever become opportunities. This insight tells them exactly where to focus their optimization efforts—perhaps by refining ad targeting or improving landing page messaging to attract higher-quality leads from the very start.
Benchmarking Your Performance Against Industry Standards
Once you’ve nailed down your own numbers, the natural next question is, “So… are these numbers any good?” Calculating your conversion rate for sales in a vacuum is a solid first step, but its real power comes alive when you hold it up against industry standards. This is how you get the competitive context you need to set realistic goals and spot your biggest growth opportunities.
Let's be clear: a "good" conversion rate isn't some universal number. It swings wildly depending on your industry, business model, and even the specific marketing channel you're looking at. What’s considered stellar in one sector might be a five-alarm fire in another.
Why Industry Averages Matter
Understanding these benchmarks gives you a realistic baseline for performance. Think about it: a user searching for a lawyer has a completely different mindset than someone casually scrolling through a fashion boutique. The first person is often dealing with an urgent, high-stakes problem, which naturally leads to a higher conversion rate on lead forms. The second is browsing, comparing, and looking for inspiration, which means a lower average rate is perfectly normal.
Did you know the average website conversion rate has hovered around 2.35% across the board for years? But when you slice it by industry, the story gets much more interesting. The finance and legal fields often see median rates of 12.3% on lead forms because users have immediate, high-intent needs. Meanwhile, retail and travel lag behind at around 3.8%. You can discover more insights about industry conversion rates to see exactly how you stack up.
This context is everything. It stops you from panicking over a 2% e-commerce conversion rate when that's actually right in line with the industry average. On the flip side, it might be the wake-up call you need, showing that your 5% SaaS demo request rate has a ton of room to grow compared to the top players.
Comparing Performance by Marketing Channel
Just as rates differ by industry, they also change dramatically depending on the marketing channel. All traffic is not created equal. Where a visitor comes from is a huge indicator of their intent and how ready they are to buy.
Here’s a rough idea of how performance can vary:
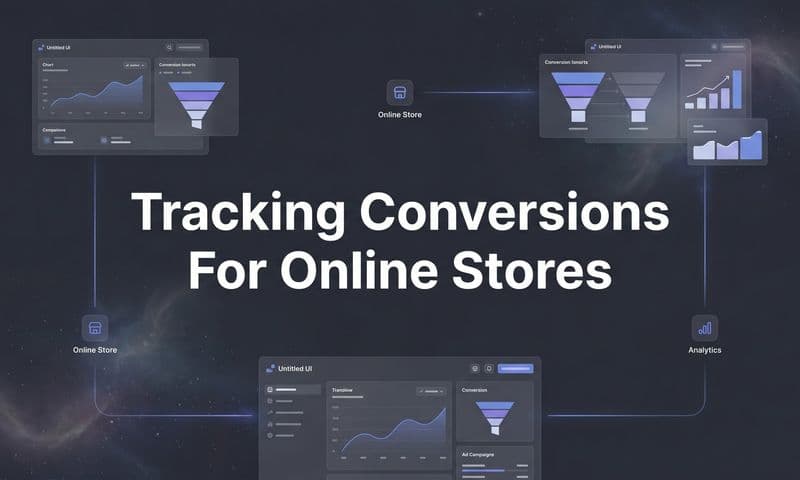
This breakdown shows why you can't just track one overall conversion rate. You have to segment it by channel. A platform like Cometly is built to give you this exact granular view, so you can see precisely which channels are driving real, profitable sales.
This dashboard is a great example of how you can track and optimize your marketing campaigns at a glance.
With this kind of clear attribution, you know instantly which ads are making you money and which are just burning cash, allowing you to shift your budget with confidence.
Putting Benchmarks into Action
So, how do you actually use this information? Think of benchmarks not as rigid rules but as guideposts that help you ask smarter questions about your performance.
Benchmarks don’t tell you what your conversion rate should be. They tell you what it could be. They provide a data-backed starting point for your own journey of continuous testing and improvement.
Use these industry and channel averages to:
By comparing your internal data to these external benchmarks, you stop just measuring performance and start strategically managing it.
Overcoming Common Measurement and Attribution Hurdles
While calculating your conversion rate for sales seems straightforward on paper, getting an accurate number in the real world is a whole different ballgame. The modern customer journey is rarely a straight line from a single ad to a final purchase. It’s a winding path across multiple devices and channels, creating some major headaches for measurement.
This complexity often leads to distorted data, misguided budget decisions, and missed opportunities for growth. The biggest culprit? An over-reliance on simplistic attribution models that just don't capture the full story of what drives a sale.
The Myth of the Last Click
The most common measurement trap is last-click attribution. This model gives 100% of the credit for a sale to the very last touchpoint a customer interacted with before converting. While it's easy to track, this model is dangerously misleading.
Imagine this all-too-common customer journey:
In a last-click world, the email campaign gets all the glory. The Facebook ad that started it all and the SEO content that built trust are completely ignored. This flawed view leads you to undervalue your top-of-funnel marketing, potentially causing you to cut budgets for the very channels that are filling your pipeline in the first place.
The Challenge of Fragmented Data
Another huge hurdle is fragmented data. Your customer information is often scattered across a dozen disconnected platforms—your ad managers (Google, Meta), your CRM, your website analytics, and your payment processor. Each platform tells a small piece of the story, but none of them has the full picture.
Without a single source of truth, you’re left trying to piece together a puzzle with missing pieces. This leads to inaccurate reporting, wasted ad spend, and an incomplete understanding of your customer’s journey from first touch to final sale.
This data chaos makes it nearly impossible to answer critical business questions with any real confidence. Which campaigns are truly driving revenue? What is the real return on your ad spend? You can explore our detailed guide on the most common attribution challenges in marketing to see just how deep these issues run.
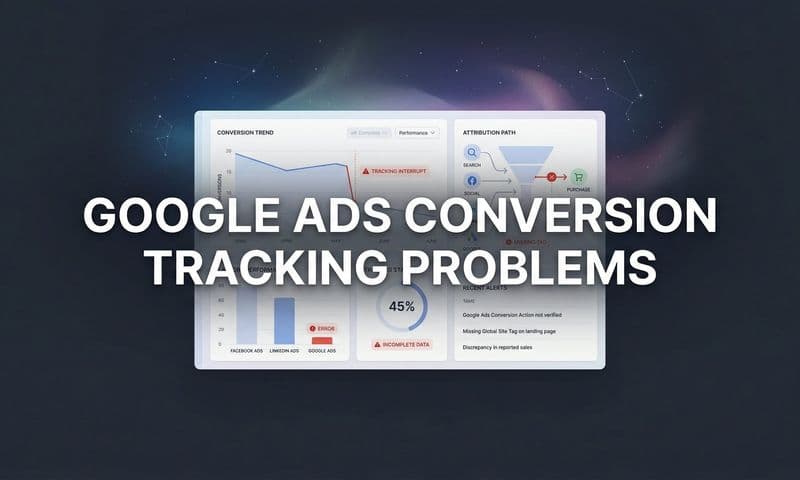
The following graphic shows how conversion benchmarks can vary wildly between industries, hammering home why a one-size-fits-all measurement approach is doomed to fail.
 Mastering the Conversion Rate for Sales to Drive Revenue
As you can see, conversion goals and user intent are completely different across sectors like E-commerce, SaaS, and Finance, which demands a much more nuanced attribution strategy.
Getting past these hurdles means moving beyond siloed, platform-specific metrics and adopting a unified approach. By connecting every data point, you can finally see the entire customer journey clearly and make decisions based on what’s actually working.
Actionable Strategies to Improve Your Sales Conversion Rate
 Mastering the Conversion Rate for Sales to Drive Revenue
Knowing your numbers is the first step, but real growth happens when you turn those insights into action. Improving your conversion rate for sales isn't about guesswork; it's about systematically finding and removing friction from the customer journey. This means committing to a cycle of continuous testing and data-driven improvements, a process often called Conversion Rate Optimization (CRO).
The goal here is simple: make the path from prospect to paying customer as smooth and compelling as possible. Every little thing on your website, from the headline on your landing page to the color of a button, plays a part. By focusing on proven tactics, you can make small, smart changes that add up to significant gains in revenue.
Optimize Your Landing Pages and Product Pages
Your landing and product pages are your digital storefronts—it's where the magic happens. They have to be clear, convincing, and dead simple to navigate. If a visitor lands on your page and feels even a flicker of confusion, they're gone.
Start by nailing your core message. Your headlines and value props need to instantly answer the one question every visitor is asking: "What's in it for me?" Ditch the feature lists and focus on the real-world benefits of your product.
For a deeper dive into this space, see our AI product photo editor guide.
Next, you need to build trust—and fast. The best way to do this is with powerful social proof. This isn't just a "nice to have," it's a must. Consider adding:
Finally, invest in high-quality visuals. Professional product photos and videos don't just look better; they help customers actually visualize themselves using your product. That's a huge psychological trigger for making a purchase.
Streamline the Checkout Process
Cart abandonment is a multi-billion dollar headache for online businesses. More often than not, a clunky, confusing, or ridiculously long checkout process is the culprit. Your mission is to hunt down and eliminate every single point of friction.
A seamless checkout is an invisible one. The less a customer has to think about the process, the more likely they are to complete it. Every extra field, every unnecessary step, is an opportunity for them to second-guess their decision.
Here are a few high-impact changes you can make right away:
Implement Smart Testing and Retargeting
The backbone of effective CRO is A/B testing. It sounds technical, but the concept is simple. You create two versions of a page (Version A and Version B) with one specific change—maybe a different headline or a new call-to-action button color. By showing each version to a different segment of your audience, you can see which one actually performs better.
This data-first approach takes emotion and guesswork out of the equation. For a deeper dive, check out our guide on powerful conversion optimisation strategies you can start using today.
Of course, even with a perfectly optimized site, not every visitor will convert on their first trip. That's where retargeting comes in. By using tracking pixels to show targeted ads to people who've already visited your site, you can stay top-of-mind and gently nudge hesitant buyers back to complete their purchase.
Understanding these optimization gaps is critical. Recent data shows that even though mobile drives over 70% of e-commerce traffic, its conversion rate of 2.9% lags far behind desktop's 4.8%. This highlights a huge opportunity for mobile optimization. For advanced insights into maximizing your sales performance, exploring resources on optimizing GA4 conversion tracking methods and best practices can be highly beneficial. Similarly, while retail niches like fashion see a 70.19% cart abandonment rate, email marketing proves its power with an average conversion rate of 10.3%, showing the value of a multi-channel strategy.
Achieving a Single Source of Truth with Attribution
If you've ever felt lost in a sea of conflicting reports and flawed last-click data, you know the frustration of not having a clear picture. The only way out of that chaos is to bring every single data point together into one coherent story. This is where a modern attribution platform steps in, acting as your single source of truth.
It’s designed to piece together the entire customer journey, connecting all the scattered touchpoints so you can finally see what’s really driving your conversion rate for sales. Instead of jumping between platform-specific metrics that often contradict each other, you get one central hub for all your performance data.
This unified view isn’t just about convenience; it’s powered by smart technology built to solve the measurement problems that keep most marketers guessing.
Unifying Data for Clearer Insights
A good attribution platform doesn’t just sit on the sidelines—it actively pulls data from all your key tools. Think ad platforms like Google and Meta, your CRM, and your e-commerce backend. It gathers everything into one place.
This creates a complete timeline for every single customer, showing you exactly how different channels and touchpoints work together to land a sale. This integrated view is crucial because customers don’t live in just one channel.
Across fourteen different industries, the average conversion rate sits at 2.9%. But when you look closer, the story gets more interesting. Paid search leads the pack at 3.2% by capturing high-intent users, while organic search isn't far behind at 2.7%. You can learn more about these industry-specific findings to see how different channels contribute to the final sale. With a single source of truth, you can finally give each of these channels the credit they deserve.
How Modern Attribution Works
So how does it all come together? Advanced platforms use sophisticated tracking to connect the dots across the entire journey, giving you a crystal-clear view of what's happening.
This is made possible by a few key features:
By combining server-side tracking with flexible attribution models, you replace incomplete data with a reliable, unified view. This empowers you to identify your most valuable channels with confidence, reallocating your budget for maximum impact.
This clarity is the foundation for systematically improving your sales conversion rate. To go deeper, you can check out our complete guide to marketing attribution and see how to apply these concepts to your own strategy. This unified data empowers you to stop guessing and start making decisions that directly boost revenue.
Got Questions About Sales Conversion Rates? We’ve Got Answers.
As you start digging into the numbers to improve your business, you're bound to run into a few practical questions about the conversion rate for sales. This section tackles the most common ones, giving you clear, straightforward answers to help you apply these concepts with confidence and sidestep the usual traps.
How Often Should I Check My Sales Conversion Rate?
There's no single right answer here—the perfect frequency really depends on your business model, how long your sales cycle is, and how much traffic you're getting. But there are some solid rules of thumb.
The most important thing? Be consistent. Set a regular schedule for your reviews so you can make smart, timely decisions based on patterns you can trust.
What's the Difference Between a Lead Conversion Rate and a Sales Conversion Rate?
They might sound similar, but these two metrics are measuring different—and equally vital—parts of your customer funnel. Nailing the distinction is key to figuring out where your process is strong and where it needs some love.
A lead conversion rate shows how good you are at grabbing someone's interest. A sales conversion rate shows how good you are at turning that interest into cash. You absolutely need to track both to get the full picture.
The lead conversion rate is all about the top of your funnel. It's the percentage of website visitors who become leads—maybe by downloading a guide or filling out a contact form. On the other hand, the sales conversion rate measures the bottom of the funnel: what percentage of those leads actually pull out their wallets and become paying customers.
Can a High Conversion Rate Hide Deeper Problems?
Absolutely. A high conversion rate is a great sign, but it doesn't tell the whole story about your business's health. It’s a classic case of a single, shiny metric lacking the full context.
For instance, you might have a killer 10% conversion rate, but if your Customer Acquisition Cost (CAC) is higher than your Customer Lifetime Value (LTV), you're literally losing money on every sale. In the same way, a high conversion rate on a tiny amount of traffic isn't going to generate enough revenue to keep the lights on. Real financial health comes from balancing a strong conversion rate with profitable customer acquisition and enough sales volume to actually grow.
Ready to get a crystal-clear, unified view of your entire customer journey? Cometly is the single source of truth that connects every touchpoint, from the first ad click to the final sale. Eliminate wasted ad spend, optimize your campaigns with confidence, and see exactly what’s driving your growth by visiting https://www.cometly.com to get started.