To get your ecommerce conversion rates heading in the right direction, you have to start by figuring out where customers are dropping off. This means doing a hands-on audit of your entire sales funnel—from the very first ad click all the way to the final thank-you page—to pinpoint and patch up the friction points.
Fixing these "leaks" first is critical. It stops you from wasting time and money on optimizations that don’t matter and puts your focus squarely on changes that will actually drive more sales.
Find the Leaks in Your Conversion Funnel
Before you can fix your conversion rate, you need to know exactly where you're losing people. Just saying you have a "conversion problem" is way too broad. What you probably have is a specific issue—maybe a confusing product page, a cart that loads at a snail's pace, or surprise shipping costs that pop up right at the end.
The key is to stop guessing and start diagnosing with a clear, methodical audit of your customer's journey.
This process isn't about chasing vanity metrics. It's about building a solid baseline for every single step a user takes. Without that foundation, any attempt to improve is just a shot in the dark. Your goal here is to map out the path from discovery to purchase and nail down the exact moments people are bailing.
For a deeper dive into the numbers that really matter, check out our guide on essential conversion funnel analytics.
Establishing Your Performance Baseline
First things first, you need to know what "good" even looks like. While the global average ecommerce conversion rate hovers around 2.95%, that number is all over the place depending on the industry.
To put that into perspective, here’s a look at how different sectors stack up.
Ecommerce Conversion Rate Benchmarks by Industry
This table compares average conversion rates across different ecommerce sectors to help you benchmark your performance.
Industry | Average Conversion Rate | Key Consumer Behavior |
|---|---|---|
Personal Care & Beauty | 6.8% | High-intent, often repeat purchases driven by brand loyalty and reviews. |
Food & Beverage | 5.5% | Purchases are often habitual or impulse-driven. Convenience is key. |
Fashion & Apparel | 4.2% | Highly visual and trend-driven. Social proof and easy returns are critical. |
Home Goods & Decor | 1.4% | Longer consideration phase. Shoppers browse for inspiration before buying. |
Electronics | 1.3% | High-ticket items that require research and price comparison. |
Knowing where you stand against your industry provides crucial context and helps you set targets that are ambitious but achievable.
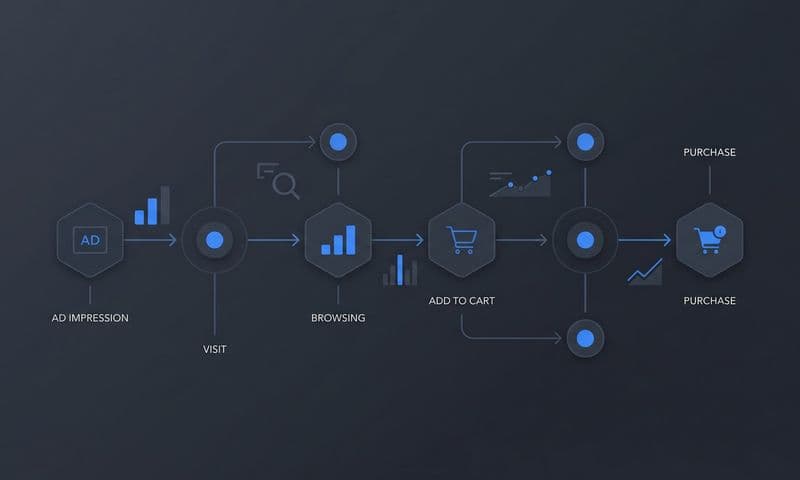
With a benchmark in mind, you can then define your Key Performance Indicators (KPIs) for each stage of the funnel:
- Top of Funnel: What are your ad Click-Through Rates (CTR) and Landing Page Bounce Rates? Are people actually engaging with your ads and sticking around?
- Middle of Funnel: Look at your Add-to-Cart Rate and Product Page Exit Rate. Do your product descriptions and images convince users to take that next step?
- Bottom of Funnel: How's your Checkout Initiation Rate and Cart Abandonment Rate? Are shoppers starting the checkout process but getting stuck before they finish?
This simple flowchart breaks down the process of auditing your funnel, diagnosing the problem, and testing a solution.
 How to Improve Ecommerce Conversion Rates with Data
Following this audit-diagnose-target framework ensures every optimization you make is a direct response to a measured problem—not just a random guess.
Conducting a Practical Funnel Audit
Now for the fun part: put yourself in your customer's shoes. Click on one of your ads and go through the entire buying process, from landing on the page to completing a purchase.
Pay close attention to any moment of friction or confusion. Is the navigation intuitive? Are the product benefits crystal clear? Does the checkout form ask for a bunch of unnecessary information?
I saw a great real-world example of this with a brand that noticed a crazy-high cart abandonment rate. A quick manual audit revealed the culprit: mandatory account creation at checkout. They switched to a guest checkout option, and boom—they saw an immediate 15% lift in completed orders. This kind of qualitative, hands-on analysis, combined with the hard data from your analytics platform, is where the magic happens.
Key Takeaway: A funnel audit isn't just about crunching numbers; it's about understanding the real human experience behind those numbers. You’d be surprised how often small usability issues are causing the biggest revenue leaks.
For a more comprehensive look at how to boost your sales, dive into these proven tactics to improve ecommerce conversion rates. By methodically finding and fixing these leaks, you build a stronger, more efficient conversion engine that turns more visitors into loyal customers.
Build a Bulletproof Tracking and Attribution System
You can't optimize what you can't accurately measure. Simple as that. After you’ve walked through your funnel and spotted the obvious drop-off points, the real work begins: building a tracking system that gives you undeniable proof of what’s working and what isn’t.
Trying to improve your conversion rates without rock-solid data is like flying blind.
A lot of brands still just slap a browser pixel on their site and call it a day. A few years ago, that was fine. Today? That approach is leaking data everywhere. Thanks to privacy updates, iOS changes, and ad blockers, it's not uncommon for up to 30% of conversions to go completely untracked by browser-side pixels alone.
 How to Improve Ecommerce Conversion Rates with Data
When your data is missing, you get misattributed sales, wasted ad spend, and a totally warped view of your customer's journey. It's time to move to a modern, more resilient system that layers different tracking methods.
Moving Beyond Last-Click Thinking
One of the biggest traps in ecommerce analytics is clinging to last-click attribution. This old-school model gives 100% of the credit for a sale to the very last thing a customer clicked before buying.
So, if someone sees your Facebook ad, reads a blog post, gets an email, and then finally clicks a Google retargeting ad to buy, last-click gives all the credit to Google. This model completely ignores the heavy lifting the Facebook ad, blog, and email did to warm that customer up. It paints a dangerously incomplete picture.
To actually understand what’s driving sales, you have to switch to multi-touch attribution. This approach distributes credit across the various touchpoints in the customer journey, giving you a much truer view of how your marketing channels work together. If this is a new concept, our guide on attribution in marketing is a great place to get up to speed.
By seeing the whole journey, you can make smarter budget decisions. You might discover that your top-of-funnel TikTok campaigns, which get zero credit in a last-click model, are actually responsible for introducing a huge percentage of your highest-value customers.
The Power of Server-Side Tracking
To get the full picture, server-side tracking isn't just a "nice-to-have" anymore; it's essential. Unlike browser pixels that are easily blocked, server-side tracking sends conversion data directly from your website's server to your analytics and ad platforms.
This method is just flat-out more reliable. It captures conversions that browser pixels miss due to:
- Ad Blockers: They are literally designed to stop browser pixels from firing.
- iOS 14+ Updates: Apple's AppTrackingTransparency framework severely limits data sharing.
- Cookie Restrictions: Browsers like Safari and Firefox have built-in prevention that kills third-party cookies.
Setting up a robust tracking system might sound overly technical, but platforms like Cometly are built to make this dead simple. Cometly pulls your data from all your sources—paid ads, email, organic search—into one place. It uses a hybrid tracking model, combining the best of browser and server-side methods to make sure your data is as accurate as it can be.
Unifying Your Data for Clarity
Once your tracking is accurate, the final piece of the puzzle is centralizing that data. Right now, your Facebook Ads Manager is telling you one story, Google Analytics another, and your Shopify dashboard a third. It’s a fractured view that makes it impossible to make confident decisions.
A dedicated attribution platform pulls all these separate data streams into one dashboard. This unified view lets you finally see:
- The Full Customer Journey: You can map out every touchpoint, from the first ad they saw to the final purchase, across every device and platform.
- True Return on Ad Spend (ROAS): You get to understand the real profitability of your campaigns, without data gaps skewing the numbers.
- Cross-Channel Performance: You can see exactly how channels like email marketing and organic search are influencing your paid conversions.
For example, a skincare brand using Cometly noticed that while their Google Shopping ads had a high last-click conversion rate, their educational YouTube videos were the most common first touchpoint for customers who ended up making large purchases. Without multi-touch attribution, they would have undervalued their YouTube efforts and likely cut a critical part of their funnel.
This kind of clarity is the foundation for any successful optimization strategy. It turns your efforts from guesswork into a precise, data-driven process where every change you test is measured against clean, reliable data.
Prioritize and Launch High-Impact Conversion Tests
Once you have accurate data flowing into your systems, you can finally stop guessing and start experimenting with purpose. The idea isn't just to run tests for the sake of it—it's about launching high-impact experiments that actually move the needle on revenue. That means focusing your efforts where they'll deliver the biggest returns.
We’ll break this down into four critical testing zones: user experience, checkout flow, pricing and offers, and personalization. By methodically testing hypotheses in each of these areas, you can make small improvements that stack up into serious conversion rate gains.
Streamline the User Experience
Think of your website's user experience (UX) as the digital version of a brick-and-mortar store's layout and customer service. If it’s confusing, slow, or frustrating, people will simply walk out. This is especially true on mobile, where patience for poor design is practically nonexistent.
Put yourself in a shopper's shoes. Can they find what they're looking for fast? Is navigation intuitive? Do pages load in a blink? These aren't just minor details; they're fundamental to keeping visitors engaged and moving them toward a purchase. Even tiny points of friction can snowball into a massive drop-off rate.
This is a huge deal for mobile shoppers. While mobile devices might account for 73% of e-commerce traffic, they convert at a much lower rate of 2.9% compared to desktop's 4.8%. That gap is often caused by usability hurdles like tiny buttons and slow load times, which lead to a staggering 77.2% cart abandonment rate on mobile.
Optimize Your Checkout Flow
The checkout process is the final hurdle between a customer and a completed sale. It's also where an astonishing number of sales are lost. Any hint of complexity, surprise costs, or unnecessary steps can send potential buyers running for the hills.
Your main goal here is to make checking out as frictionless as possible. Think of it as an express lane—the fewer obstacles, the better. This is the perfect place for A/B testing, because small tweaks can produce huge results.
Consider these high-impact test ideas:
- One-Page vs. Multi-Step Checkout: Test a streamlined single-page form against a guided, multi-step process. Some audiences prefer seeing everything at once, while others find a step-by-step approach less overwhelming.
- Guest Checkout vs. Account Creation: Forcing users to create an account is a notorious conversion killer. Try testing the impact of offering a prominent guest checkout option.
- Payment Options: Are you offering the payment methods your audience actually uses? Test the placement and variety of options like PayPal, Apple Pay, or Buy Now, Pay Later services.
Test Your Pricing and Offers
How you present your prices and promotions can dramatically sway a customer's decision to buy. This isn't just about slashing prices; it's about communicating value effectively and creating a sense of urgency.
Experimenting with different offer structures can help you figure out what truly motivates your audience without eating into your margins. Often, the perceived value is far more important than the actual price tag.
Pro Tip: Your offers should feel like a compelling reason to buy now, not just a permanent discount. Test limited-time offers or bundle deals that increase the Average Order Value (AOV) while providing clear value to the customer.
Some powerful pricing tests include:
- Shipping Thresholds: Instead of a flat free shipping offer, test dynamic thresholds. For example, A/B test "Free shipping on orders over $50" versus "Free shipping on orders over $75" to see how it impacts AOV and conversion.
- Discount Presentation: Does "20% Off" perform better than "$15 Off"? Test percentage-based discounts against flat-dollar amounts, especially for different price points.
- Urgency and Scarcity: Experiment with adding countdown timers for a sale or showing low stock levels ("Only 3 left!") on product pages to encourage immediate action.
This is a great starting point, but if you want to develop a more robust testing plan, explore our detailed guide to building a complete conversion optimisation strategy.
Personalize the Shopping Journey
Today's shoppers expect experiences that feel tailored to them. Generic, one-size-fits-all websites are becoming less and less effective. Personalization is all about using customer data to deliver relevant product recommendations, content, and offers.
This is where your unified tracking data becomes a goldmine. By understanding a visitor's browsing history, past purchases, and even the ad they clicked to get to your site, you can create a bespoke shopping journey that feels helpful and relevant. This builds a stronger connection with your brand and has a direct impact on your conversion rates.
The screenshot below shows how a platform like Cometly integrates with your entire marketing stack, from Shopify to Stripe, to pull in the data needed for deep personalization.
Having all this data in one place allows you to build sophisticated audience segments and trigger personalized experiences based on real-time user behavior.
Recapture Lost Sales with Smarter Remarketing
It’s completely normal that most visitors won't buy on their first trip to your store. They’re browsing, comparing prices, and thinking things over. The real money isn’t just in converting those first-time visitors; it’s in strategically bringing back high-intent shoppers who already showed interest.
This is where a smart remarketing strategy becomes one of your most powerful tools.
But effective remarketing is way more than just showing the same generic ad to everyone who clicked on your site once. It’s about using precise attribution data to deliver hyper-relevant messages based on exactly what a user did. Did they look at a specific product? Did they add it to their cart and then get distracted? Each of these actions signals a different level of intent and needs its own unique approach.
 How to Improve Ecommerce Conversion Rates with Data
Build High-Intent Retargeting Audiences
The foundation of any killer remarketing campaign is segmentation. If you're just lumping all your site visitors into one giant audience, you’re setting yourself up to waste ad spend. Instead, use your tracking data to create granular audiences based on exactly where they dropped off in your funnel.
Here are a few essential segments you should be building:
- Product Viewers: These people showed interest in a specific item but never added it to their cart. Hit them with dynamic product ads showcasing that exact item, maybe alongside a few similar products they might also like.
- Cart Abandoners: This is your lowest-hanging fruit, period. These shoppers were just one click away from buying. Remind them what they left behind, and consider adding a small incentive like free shipping to get them over the finish line.
- High-Frequency Visitors: Some people visit your site multiple times but never pull the trigger. They're clearly interested, but something is holding them back. An offer for a first-time buyer discount can be incredibly effective here.
A common mistake is running cart abandonment campaigns for too long. If someone hasn't come back after 7-10 days, they’ve probably moved on or bought from a competitor. Focus your budget on the first few days when their buying intent is still hot.
This level of detail is only possible if you have a rock-solid tracking system in place. To get a better handle on collecting this data accurately, especially from paid channels, check out our insights on effective Facebook ad tracking.
Go Beyond Ads with On-Site Personalization
Remarketing doesn’t just happen on Facebook or Google; it should continue the second a visitor returns to your site. On-site personalization uses that same data to create a custom experience that acknowledges a user's previous actions, making them feel seen and understood.
Imagine a visitor who abandoned their cart comes back to your homepage. Instead of the same old generic banner, they see a personalized message: "Still thinking it over? The items in your cart are waiting for you!" That simple, dynamic change can dramatically increase the odds of them completing the purchase.
Try implementing these on-site personalization tactics:
- Abandoned Cart Banners: Display a prominent reminder at the top of the page that shows the exact items a returning visitor left behind.
- Recently Viewed Modules: Add a section to your homepage or product pages that showcases products a user has previously browsed.
- Targeted Pop-Ups: Trigger a special offer pop-up, but only for users who have visited more than three times without converting.
Measure the True Impact on Revenue
So, how do you know if your remarketing is actually working? This is where your attribution platform is absolutely critical. A tool like Cometly connects the dots, showing you precisely how many sales your Facebook, Google, or TikTok remarketing campaigns are influencing.
For instance, you might launch a cart abandonment campaign on Facebook. With accurate attribution, you can see not just the clicks and impressions but the exact dollar amount of revenue recovered directly from that campaign. This lets you calculate a precise Return on Ad Spend (ROAS) and confidently scale what’s working.
By combining granular audience segmentation with dynamic on-site personalization—and measuring it all with a reliable attribution system—you can build a powerful engine that recaptures lost sales and turns hesitant browsers into loyal customers.
Analyze Your Results and Scale What Works
 How to Improve Ecommerce Conversion Rates with Data
Running tests and gathering data is only half the battle. The real growth happens when you translate those learnings into scalable, repeatable wins. This is where you separate the high-impact experiments from the duds and double down on what’s actually moving the needle.
Optimization isn't a one-and-done task; it’s a constant feedback loop. You test, measure, analyze, and then expand on what works. This cycle ensures your marketing budget is always flowing toward the channels and campaigns delivering the highest return, creating a sustainable engine for growth.
Interpreting Your Attribution Reports
With multi-touch attribution, you can finally see the entire story behind each sale, not just the last ad someone clicked. It allows you to identify the specific combination of touchpoints that guided a customer from discovery to purchase.
Your reports will start to reveal which channels own different stages of the funnel. For instance, you might discover your TikTok campaigns are fantastic for introducing new customers to your brand (first touch), while your Google Shopping remarketing ads are the real closers (last touch).
Key Takeaway: A winning strategy isn't about finding a single "best" channel. It's about understanding how your channels work together as a team to drive conversions and investing in that synergy.
This holistic view is everything. Without it, you might slash the budget for a top-of-funnel campaign that looks like it has a low ROAS, not realizing it’s feeding your entire pipeline of high-value customers. Understanding this interplay is a critical part of how you improve ecommerce conversion rates for the long haul. Our breakdown of marketing reporting and analytics dives even deeper into this.
Leveraging AI for Smarter Scaling Decisions
Manually sifting through rows of data to find winning patterns is a massive time sink. This is where AI-powered insights become your secret weapon. A platform like Cometly uses its AI to analyze your campaign performance across all channels, automatically flagging your top-performing ads, audiences, and creative combos.
Instead of spending hours in spreadsheets, you get clear, actionable recommendations. The system might highlight that a specific video ad is generating a 35% higher Add-to-Cart rate among a particular demographic, giving you a clear signal to pump more budget into it.
This allows you to:
- Scale with Confidence: Make budget decisions based on reliable, cross-platform data, not the skewed numbers inside a single ad platform.
- Optimize Ad Spend: Automatically shift funds from underperforming campaigns to your proven winners, maximizing your overall ROAS.
- Identify Trends Faster: Spot emerging creative fatigue or breakout trends before they have a chance to hurt your performance.
Creating a Framework for Continuous Improvement
Your test results can't just live in a spreadsheet and be forgotten. They need to inform your entire marketing strategy going forward. The final piece of the puzzle is building a simple framework for tracking your wins and reinvesting your budget where it counts.
Here’s a practical way to do it:
- Document Everything: For every A/B test, create a simple one-page summary. What was the hypothesis? What were the results (e.g., "+2.1% lift in CVR")? What did you learn from it?
- Hold Weekly Performance Reviews: Carve out 30 minutes each week to review your attribution dashboard. Which campaigns are driving the most revenue? Where are the immediate opportunities to scale up or pull back?
- Implement Winning Variations: Once a test shows a statistically significant winner, roll out that change everywhere. The winning checkout flow or product page layout should become the new control.
This structured process turns optimization from a series of random tactics into a core business function. By consistently analyzing your results and scaling what works, you create a powerful, data-driven system that steadily pushes your conversion rates higher and fuels sustainable business growth.
Answering Your Top Questions About Conversion Rates
When you're deep in the weeds of conversion rate optimization, it's easy to get stuck on a few key questions. We hear the same ones from ecommerce brands all the time. Let's clear them up with some straightforward, actionable answers.
What Is a Good Ecommerce Conversion Rate?
This is the million-dollar question, isn't it? The honest answer is: it totally depends on your industry.
Like we covered earlier, a beauty brand seeing a 6.8% conversion rate is killing it. But for a home decor store, 1.4% might be fantastic. Chasing some universal "good" number is a waste of time.
Instead, zero in on these two metrics:
- Your Industry Benchmark: First, know the average for your specific niche. This gives you a realistic target and shows you where you stand against the competition.
- Your Own Baseline: This is the number that really matters. A "good" conversion rate is one that's consistently getting better. Focus on steady, month-over-month improvements. That's how you win.
How Long Should I Run an A/B Test?
It's so tempting to call a test early when one version starts pulling ahead. Don't do it. This is one of the biggest mistakes you can make, and it often leads to false positives.
For your results to be reliable, you need to hit statistical significance—that usually means a confidence level of 95% or higher.
Most A/B testing tools handle the math for you. A good rule of thumb is to let your tests run for at least one full business cycle, which is typically one to two weeks. This helps iron out any weird dips or spikes from daily traffic patterns or weekend shopping habits. Whatever you do, don't stop the test until your tool gives you the green light.
Mobile vs. Desktop: Which Is More Important to Optimize?
This one trips a lot of people up. While desktop usually boasts a higher conversion rate (around 4.8% vs. mobile's 2.9%), mobile is where most of your traffic is coming from—often over 70%. You simply can't afford to ignore it.
The truth is, many customer journeys are a mix of both.
A classic scenario: someone sees your ad on Instagram while scrolling on their phone, emails the link to themselves, and then buys it later from their laptop. Both experiences have to be flawless.
Your top priority should be closing that conversion gap between mobile and desktop. Start by focusing on mobile-first design, lightning-fast page speed, and a dead-simple checkout process for smaller screens. Even tiny friction points on mobile can have a massive negative impact on your bottom line.
How Can I Improve My Site Search Conversion?
Your on-site search bar is secretly one of your most valuable conversion tools. Think about it: someone using search isn't just window shopping. They have high intent and know exactly what they're looking for. The data backs this up—visitors who use site search can convert at rates 1.8 times higher than the average.
Here's how to dial it in:
- Turn on Autocomplete: This small feature helps people find products faster and cuts down on typos. Some studies have shown it can lift conversions by as much as 24%.
- Handle "Zero Results" Searches Smartly: A "no results found" page is a dead end. Instead, use that space to show alternative products, check for misspellings, or point them toward popular categories.
- Analyze Your Search Data: Track what your customers are searching for. This is a goldmine for understanding product demand, spotting trends, and finding gaps in your inventory.
Ready to stop guessing and start getting crystal-clear insights into what’s actually driving your sales? Cometly unifies all your marketing data into one place, giving you the accurate attribution you need to scale with confidence. See how Cometly can improve your ecommerce conversion rates today.