Marketing attribution is a crucial aspect of modern marketing, allowing businesses to determine which channels and touchpoints are effectively driving conversions. However, marketers often face significant challenges in accurately measuring return on investment (ROI) and attributing revenue to the appropriate sources. According to recent studies, 40% of marketers struggle with measuring ROI accurately, leading to misallocated budgets and wasted resources. This guide aims to demystify the process of creating a comprehensive marketing attribution report. By following the steps outlined here, you’ll learn how to leverage UTM parameters, analyze data, and present findings that can significantly improve marketing effectiveness. Let's walk through how to do this step-by-step.
The Importance of Marketing Attribution
Understanding marketing attribution is essential for effective budget allocation. By identifying which channels contribute to conversions, businesses can optimize their marketing strategies and allocate funds more efficiently. For example, a company might analyze attribution data and discover that by shifting 20% of its budget to high-performing channels, it could enhance overall conversion rates. Implementing effective attribution models can thus significantly improve ROI and foster smarter marketing decisions.
For insights on how to visualize your findings effectively, check out our resource on marketing dashboard examples.
Step 1: Understanding Marketing Attribution
Marketing attribution refers to the process of identifying which marketing channels contribute to conversions. This understanding helps businesses analyze customer journeys and evaluate the effectiveness of their campaigns. For instance, a brand might attribute 60% of its total sales to email marketing based on thorough data analysis. Knowing where conversions come from allows for better budget allocation and maximizes marketing efficiency.
According to a study, businesses using attribution models saw a 30% increase in marketing efficiency. Different attribution models, such as linear, time decay, and last-click, provide various perspectives on performance. For example, a company employing a time decay model may favor touchpoints that are closer to conversion, allowing for a more nuanced understanding of customer interactions. Choosing the right model can, therefore, profoundly impact strategy outcomes.
However, common mistakes in attribution can lead to misleading conclusions. Neglecting to track all channels can misrepresent the effectiveness of marketing efforts. Focusing solely on last-click attribution overlooks the full customer journey and may lead to overestimating the impact of direct traffic. Comprehensive tracking is crucial for accurate attribution.
For a deeper dive into implementing the linear attribution model, read our detailed guide on how to use the linear attribution model.
Step 2: Setting Up UTM Parameters
UTM parameters are tags added to URLs to track campaign performance. They provide insights on the source, medium, and campaign name, enabling detailed traffic analysis. For instance, an email campaign link with UTM tags shows traffic sources in Google Analytics, allowing marketers to understand which campaigns are effective. Using UTM parameters enhances tracking capabilities, leading to better data insights.
To create effective UTM parameters, it's crucial to follow a systematic approach that ensures consistency and accuracy across all campaigns. UTM parameters are tags added to a URL, allowing marketers to track the performance of online campaigns across various traffic sources. These parameters help you identify which marketing efforts are driving the most traffic and conversions, thus enabling more informed decision-making.
Begin by utilizing an online UTM builder tool for ease and precision. These tools are designed to help marketers generate URLs with the correct UTM tags effortlessly. For instance, when planning a summer sale campaign, a marketer can use a UTM builder to create a link that includes parameters such as utm_source, utm_medium, and utm_campaign. This ensures that the traffic from different marketing channels is accurately captured and analyzed in tools like Google Analytics.
In Google Analytics, the most common UTM parameters include:
- utm_source: Identifies the source of the traffic, such as a search engine (e.g., Google), a newsletter, or a social media platform (e.g., Facebook).
- utm_medium: Specifies the marketing medium, such as email, CPC, or social.
- utm_campaign: Used to define the specific campaign, such as a product launch or a seasonal sale.
- utm_term: Utilized for paid search to note the keywords for the ad.
- utm_content: Differentiates similar content or links within the same ad, useful for A/B testing.
In addition to these standard parameters, custom UTMs can be created to track more specific data suited to your unique marketing needs. For example, a company might use a custom parameter like utm_geo to track the geographic location of their audience, or utm_language to understand the language preferences of their users. Custom UTMs provide deeper insights tailored to particular business questions or objectives.
Ensuring all parameters are consistent across campaigns is essential for accurate tracking and reporting. Inconsistent tagging can lead to data discrepancies, making it difficult to draw reliable conclusions from the data. Adopting standard naming conventions and maintaining a centralized documentation of all UTM parameters used can prevent confusion and ensure clarity in reporting.
Proper setup of UTM parameters leads to better data insights and more effective campaign tracking. By implementing a structured approach to UTM tagging, marketers can enhance the granularity of their data, allowing for more detailed analysis and ultimately leading to more strategic marketing decisions. This process not only optimizes campaign performance but also maximizes the return on investment (ROI) by focusing efforts on the most effective channels.
To create effective UTM parameters, follow a systematic approach. Utilize an online UTM builder tool for ease and accuracy. A marketer might create a link for a summer sale campaign using a UTM builder, ensuring all parameters are consistent. Proper setup leads to better data insights and more effective campaign tracking.
Inconsistent tagging can lead to data discrepancies. Therefore, adopting standard naming conventions is critical to avoid confusion and ensure accurate reporting. For example, a brand that uses different names for the same campaign across channels creates unnecessary complexity in data analysis.
Step 3: Collecting Data from Analytics Tools
In today's data-driven landscape, utilizing analytics tools is crucial for gathering comprehensive data for your marketing attribution reports. Google Analytics stands out as a fundamental tool that offers extensive capabilities to track website performance meticulously. It enables businesses to monitor a variety of metrics, such as page views, session duration, and bounce rates, all of which are integral to understanding how users interact with your site. The platform allows marketers to set up specific conversion goals tailored to their business objectives. For instance, a marketer can configure a conversion goal to track when a user completes a purchase or fills out a contact form. This capability provides invaluable insights into the effectiveness of marketing strategies by showing which channels and tactics are driving the most valuable actions on your website.
To enhance the depth and reliability of marketing attribution reports, it's crucial to integrate data from multiple sources. While Google Analytics is a powerful tool for tracking website performance, complementing it with data from platforms like Cometly can provide a more comprehensive view. Cometly excels in compiling data from various channels, such as social media, email campaigns, and paid advertisements, allowing marketers to weave a cohesive narrative around customer interactions. This holistic approach reveals how social engagement and other touchpoints influence website traffic and conversion rates, offering a fuller picture of marketing effectiveness.
Ensuring accurate data collection is vital for crafting effective reports. A robust data validation process, including regular audits, helps maintain the integrity of the information guiding your decisions. Companies conducting quarterly audits can swiftly detect and correct anomalies, such as tracking errors or data discrepancies, preventing misguided strategies. By implementing these checks and balances, businesses ensure that their marketing decisions are grounded in reliable data.
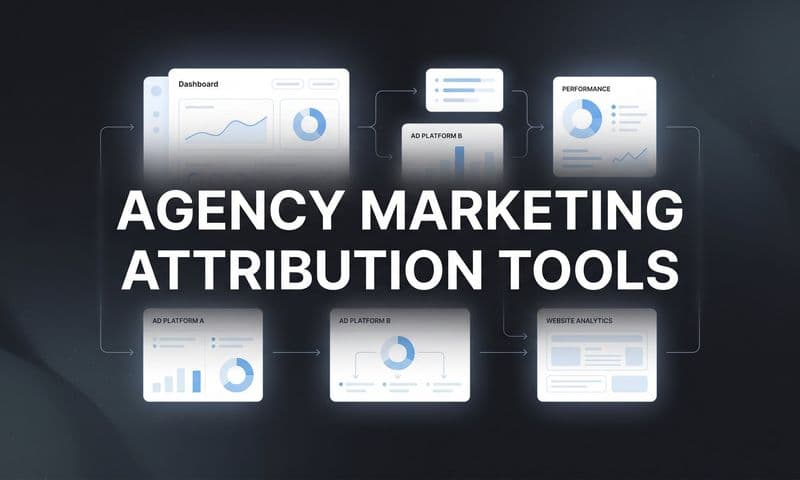
For further insights on enhancing your marketing strategy with comprehensive data tools, explore our resource on attribution marketing tools.
Moreover, leveraging advanced analytics features, such as segmentation and cohort analysis, can provide deeper insights into user behavior and marketing effectiveness. Segmentation allows marketers to break down data into smaller, more manageable groups based on specific criteria, such as demographics or purchase history. This approach helps in identifying patterns and trends that might be obscured in a broader dataset. Cohort analysis, on the other hand, examines how groups of users behave over time, offering insights into customer retention and lifetime value. These advanced techniques enable marketers to tailor their strategies more precisely to meet the needs and preferences of their audience.
Additionally, employing data visualization tools can significantly enhance the clarity and impact of your reports. By translating complex data sets into visual formats such as charts, graphs, and dashboards, marketers can make it easier for stakeholders to grasp key insights at a glance. For example, a dashboard that visually represents the performance of various marketing channels can quickly highlight which channels are underperforming and require attention. This visual clarity not only aids in better understanding but also facilitates more informed discussions during strategy meetings.
Embracing machine learning and AI-powered analytics can revolutionize how you collect and analyze data. These cutting-edge technologies can automate the handling of massive datasets, revealing hidden trends and predicting future developments based on past information. For instance, AI can evaluate customer interactions across different platforms, helping to pinpoint which marketing messages will likely resonate most with specific audience segments. This foresight allows marketers to proactively refine their strategies and optimize campaigns for improved results. Integrating diverse analytics tools and methodologies is essential for crafting detailed and insightful marketing attribution reports. Leveraging platforms like Google Analytics and Cometly, combined with regular data audits and advanced analytical techniques, ensures that your reports provide a complete and precise view of your marketing activities. This holistic approach not only boosts data credibility but also empowers strategic decision-making, driving more effective marketing strategies and a higher return on investment (ROI).
For detailed insights into analyzing paid advertising efforts, check out our paid ads analytics guide.
Step 4: Compiling the Attribution Report
A well-organized attribution report is key to effectively communicating findings. Start with an executive summary, followed by detailed analyses of performance across channels. For instance, a clear report might distinctly outline findings from various channels, allowing stakeholders to grasp the insights quickly. Structure is crucial for effective communication.
Visual elements like charts and graphs can enhance report clarity and engagement. Visuals simplify complex data and highlight key insights. A marketer may use pie charts to visually represent channel performance, making it easier for stakeholders to understand the contributions of each channel at a glance.
However, overloading reports with excessive data can confuse readers. Focus on key metrics that drive actionable insights. Including irrelevant data can distract from the primary findings, leading to misunderstandings. Keeping reports concise and focused is essential for clear communication.
Understanding the estimated action rate can further enhance your report's effectiveness. Learn more about this vital metric at what is estimated action rate.
Step 5: Analyzing the Data
Extracting meaningful insights from collected data is essential for informing future marketing strategies. Identifying trends can guide strategic decisions. Analyzing data over time allows marketers to spot shifts in customer behavior, such as an increase in conversions from mobile users, which can prompt adjustments to marketing tactics.
Understanding customer journeys is equally important. Mapping these pathways reveals the touchpoints that lead to conversions, helping marketers optimize their efforts. A marketer examining the steps customers take before purchasing can hone in on the most effective channels and messaging.
However, ignoring outliers may lead to skewed interpretations. Anomalies can reveal insights into unexpected customer behavior. For instance, a sudden spike in traffic may indicate a successful campaign, highlighting an opportunity to replicate that success in the future. Considering all data points is crucial for comprehensive analysis.
For further insights on revenue analysis, check out our revenue analytics guide.
Step 6: Presenting Findings and Recommendations
When presenting findings to stakeholders, tailoring your approach based on audience interests and knowledge levels is vital. Engaging presentations use relevant examples that resonate with the audience. For instance, a marketer presenting conversion data to the sales team should focus on how these insights impact their goals.
Using storytelling techniques can make data relatable and foster understanding. Presenting data in context helps stakeholders grasp the significance of the findings. Sharing a success story that illustrates data points can create a compelling narrative that drives home the insights.
However, using overly technical jargon can alienate stakeholders. Simplifying language for clarity and impact is critical. A marketer who loses audience attention with complex terms may miss an opportunity for engagement and actionable feedback. Clarity is key in presentations.
For a foundational understanding of attribution models to discuss in your presentation, check out our resource on the 5 most common ad attribution models.
Step 7: Automating Future Reports
Implementing automation for reporting can significantly enhance efficiency and reduce manual errors. Several tools are available that can streamline the reporting process. Cometly, for example, offers features that facilitate data collection and reporting. By setting up automated weekly reports, a marketer can save time and ensure consistency in reporting.
Setting up automation requires careful planning. Define what data needs to be collected and how frequently it should be reported. A company might schedule monthly reports to review marketing performance, ensuring that teams can react swiftly to changes in metrics.
Regularly reviewing automated reports is essential to maintain data accuracy. Failing to check for data integrity can lead to issues, such as outdated information that misinforms decisions. A marketer who realizes their automated reports aren't reflecting recent changes can quickly address the problem through regular audits.
For more on syncing data to optimize your reporting automation, explore our conversion sync feature.
Wrap-Up / Checklist
In this guide, we've explored the essential steps for creating a comprehensive marketing attribution report, from understanding marketing attribution to automating future reports. Here’s a quick recap:
1. Understand the importance of marketing attribution.
2. Set up UTM parameters for tracking.
3. Collect data using analytics tools.
4. Compile your report with clear structure and visuals.
5. Analyze the data for actionable insights.
6. Present your findings effectively to stakeholders.
7. Implement automation for future reporting efficiency.
With these steps, you’re well-equipped to enhance your marketing attribution efforts and drive better ROI. If you want to make this even easier, consider using automation tools.
In conclusion, mastering the art of creating a marketing attribution report can significantly enhance your marketing strategy and boost your ROI. By understanding the intricacies of marketing attribution, setting up precise UTM parameters, and leveraging comprehensive analytics tools, you position your business to make data-driven decisions that optimize marketing performance. The process of compiling detailed reports, analyzing data for trends and insights, and effectively presenting findings ensures that your marketing strategies are continually refined and aligned with business objectives.
Implementing automation not only streamlines the reporting process but also maintains the accuracy and consistency of your data, freeing up valuable resources to focus on strategic growth. As you refine your approach, remember that marketing attribution is not a one-time task but an ongoing process that evolves with your business and market trends.
Ready to take your marketing attribution to the next level? Start by integrating advanced analytics tools and automating your reporting processes with Cometly.
Get Started with Cometly today to get accurate attribution reports. By embracing these strategies, you'll be equipped to drive better marketing outcomes and achieve a higher return on your investment.