
Picture your marketing budget as the fuel for your business engine. The Marketing Efficiency Ratio (MER) is your MPG reading—it tells you exactly how much revenue you're getting for every gallon of marketing you put in.
It’s a single, powerful number that gives you a clean read on the overall health of your entire marketing strategy.
What is the Marketing Efficiency Ratio?
 Mastering Your Marketing Efficiency Ratio
While it's easy to get lost chasing channel-specific metrics, MER gives you that crucial bird's-eye view. Instead of just obsessing over the return from a single Google Ad or Facebook campaign, MER gauges the performance of your entire marketing ecosystem.
This holistic approach keeps you from over-valuing one channel while accidentally ignoring the bigger picture: overall profitability.
MER boils everything down to one critical question: for every dollar we spend on marketing, how many dollars in total revenue are we generating? This simple but profound insight makes it an essential health check for your marketing efforts.
A high MER means your marketing investments are humming along nicely. A low one is a clear signal that it’s time to take a hard look at where your budget is actually going.
The Core Formula and Its Components
At its heart, the MER formula is refreshingly simple. You just divide your total revenue by your total marketing costs over a specific period.
For example, if you spend $50,000 on marketing in a quarter and generate $200,000 in total sales, your MER is 4. For every dollar you spent, you brought in four dollars. Simple as that.
What makes this metric so powerful is that it includes all marketing costs—not just your ad spend. This gives you a true measure of efficiency by accounting for everything:
- Agency fees and contractor payments
- Marketing team salaries and overhead
- Software subscriptions (like email platforms and analytics tools)
- Content creation and creative production costs
By rolling every related expense into the calculation, MER delivers an honest, unfiltered assessment of marketing's contribution to the bottom line. This is what sets it apart from more granular metrics and helps leadership make smarter, high-level budget decisions.
Getting a clear handle on your overall efficiency is the first step in any solid marketing effectiveness measurement strategy.
Marketing Efficiency Ratio at a Glance
To make this even clearer, let's break down the formula's inputs and output. The table below gives you a quick summary of each component and what the final ratio tells you about your business.
Component | Description | Example |
|---|---|---|
Input 1: Total Revenue | All revenue the business generated in a specific period, no matter the source. | $150,000 in Q1 sales |
Input 2: Total Marketing Costs | All expenses related to marketing, including ad spend, salaries, software, and agency fees. | $30,000 in Q1 marketing spend |
Output: MER | A ratio showing the revenue generated for every dollar spent on marketing. | 5 (or a 5:1 ratio) |
Think of this table as your cheat sheet. When you see a MER of 5, you know instantly that your marketing efforts generated $5 in revenue for every $1 you invested. It's a straightforward way to keep score.
How to Calculate Your Marketing Efficiency Ratio
Theory is nice, but putting it into practice is where you really start seeing the value. Calculating your Marketing Efficiency Ratio (MER) isn't just some academic exercise; it’s a hands-on way to get a real pulse on your business's financial health.
Let's walk through exactly how to do it.
The formula itself looks simple enough: MER = Total Revenue / Total Marketing Costs.
But, as with most things in marketing, the devil is in the details. Nailing down what actually goes into "Total Revenue" and "Total Marketing Costs" is what separates a fuzzy guess from a metric you can build a strategy on.
Defining and Gathering Your Total Revenue
First things first, you need to tally up your Total Revenue for a specific period—say, a month or a quarter. For MER, this number should be all the sales your business generated in that window. It's a blended, top-line figure that doesn't try to pin sales to just one channel.
The whole point is to capture the big picture. Sure, your Google Ad might have gotten the final click, but what about the Facebook ad that first introduced the customer to your brand? Or the email newsletter that kept them warm? MER is built on the idea that many touchpoints work together to land a single sale.
While MER uses total revenue to keep things simple, understanding the nuances of the customer journey is still crucial for smart marketing. To get a better handle on how different interactions contribute to a sale, it’s worth exploring various multi-touch attribution models.
This has always been the marketer's dilemma. Back in the day, effectiveness was just a guess based on how sales moved after a print or TV ad ran. The digital age gave us a million things to track, which ironically made it harder to see the combined impact of everything. An aggregated metric like MER brings back that holistic view.
Key Takeaway: For your MER calculation, use the total, top-line revenue for the period you're measuring. This blended approach is what gives the metric its power, reflecting the combined effect of all your marketing activities.
Uncovering All Your Marketing Costs
This is where so many businesses get it wrong. They only count ad spend. An accurate MER demands that you account for every single dollar that goes into marketing. If you forget costs, you'll artificially inflate your ratio and get a dangerously false sense of security.
Your "Total Marketing Costs" should include way more than just ads:
- Paid Media Spend: The obvious one. This is all the money you're giving to platforms like Google Ads, Meta (Facebook and Instagram), TikTok, LinkedIn, and any other ad networks.
- Salaries and Freelancer Fees: The pay for your in-house marketing team, contractors, copywriters, and designers is absolutely a marketing cost.
- Agency Fees: If you work with a marketing, PR, or creative agency, their retainers or project fees have to be in here.
- Software and Tool Subscriptions: Don't forget the monthly or annual costs for your email platform, CRM, analytics tools, SEO software, and social media schedulers. Every single one counts.
- Content and Creative Production: This covers everything from photoshoots and video production to graphic design assets and other creative development expenses.
By including these "hidden" costs, you get a true picture of your total investment. This is also a key difference from other metrics. For a detailed comparison, check out our guide on how to calculate return on marketing investment, which often zeroes in on more specific campaign returns.
Let’s put this into action with a real-world example.
Case Study: An E-commerce Brand's Q1 Calculation
Imagine an online store, "Modern Home Goods," wants to calculate its MER for the first quarter (January 1 - March 31).
- Gather Total Revenue: They pop into their Shopify dashboard and see their total sales for Q1 were $300,000. Easy enough.
- Calculate Total Marketing Costs: Now they start adding everything up.
- Google Ads Spend: $25,000
- Meta Ads Spend: $20,000
- Marketing Manager Salary (Portion for Q1): $15,000
- Email Software (Klaviyo): $1,500
- Agency Retainer: $6,000
- Freelance Content Writer: $2,500
- Total Q1 Marketing Costs: $70,000
- Plug into the Formula:
- MER = $300,000 / $70,000
- MER = 4.28
- Salaries and Benefits: The compensation for your in-house marketing team.
- Agency and Freelancer Fees: The retainers or project costs for external partners.
- Software Subscriptions: All the tools in your stack—your CRM, email platform, analytics tools, etc.
- Creative Production: The money spent on photoshoots, video creation, and design work.
- Simplify Your Checkout Process: Get rid of unnecessary fields and steps. Make buying from you as easy as possible.
- Improve Page Load Speed: A slow website is a conversion killer. Optimize your images and scripts to get your pages loading in under three seconds.
- A/B Test Your Calls-to-Action (CTAs): Play around with button colors, text, and placement to see what gets the most clicks.
- Implement a Loyalty Program: Reward your repeat customers with points, discounts, or early access to new products.
- Leverage Email Marketing: Keep existing customers engaged and buying with post-purchase follow-ups, cross-sells, and upsells.
- Provide Excellent Customer Service: A great support experience can turn a one-time buyer into a lifelong fan of your brand.
- Monthly: This is the sweet spot for most e-commerce and direct-to-consumer brands. With shorter sales cycles, a monthly check-in gives you a timely pulse on performance. It’s frequent enough to spot trends and react quickly, but not so frequent that you're just chasing noise.
- Quarterly: If you're a B2B company or you sell high-ticket items with a longer, more considered purchase journey, looking at MER quarterly is often far more insightful. This approach smooths out the weekly bumps and gives your longer-term plays—like content marketing or SEO—a fair shot at showing up in the revenue numbers.
- Annually: While you wouldn't use this for tactical shifts, an annual MER calculation is essential for high-level strategic planning and year-over-year reviews. It gives you the ultimate bird's-eye view of your marketing's long-term impact on the business.
What does this tell them? It means that for every $1 Modern Home Goods spent on marketing in Q1, it generated $4.28 in total revenue. That single, comprehensive number is now a powerful benchmark they can use to measure performance moving forward.
What a Good Marketing Efficiency Ratio Looks Like
Alright, so you’ve done the math and calculated your marketing efficiency ratio. You're holding a powerful number, but what does it actually mean? Is your 4.28 MER good, bad, or just... average?
The honest answer? It depends.
There's no universal "good" MER. It’s a benchmark that shifts based on your industry, business model, and even your company's growth stage.
Think of it like a car's MPG. A sports car getting 15 MPG might be considered efficient for its class, while a compact car getting 30 MPG is simply meeting expectations. In the same way, a high-growth SaaS startup might accept a lower MER while pouring cash into capturing the market, whereas a mature e-commerce brand with tighter margins needs a much higher ratio to stay profitable.
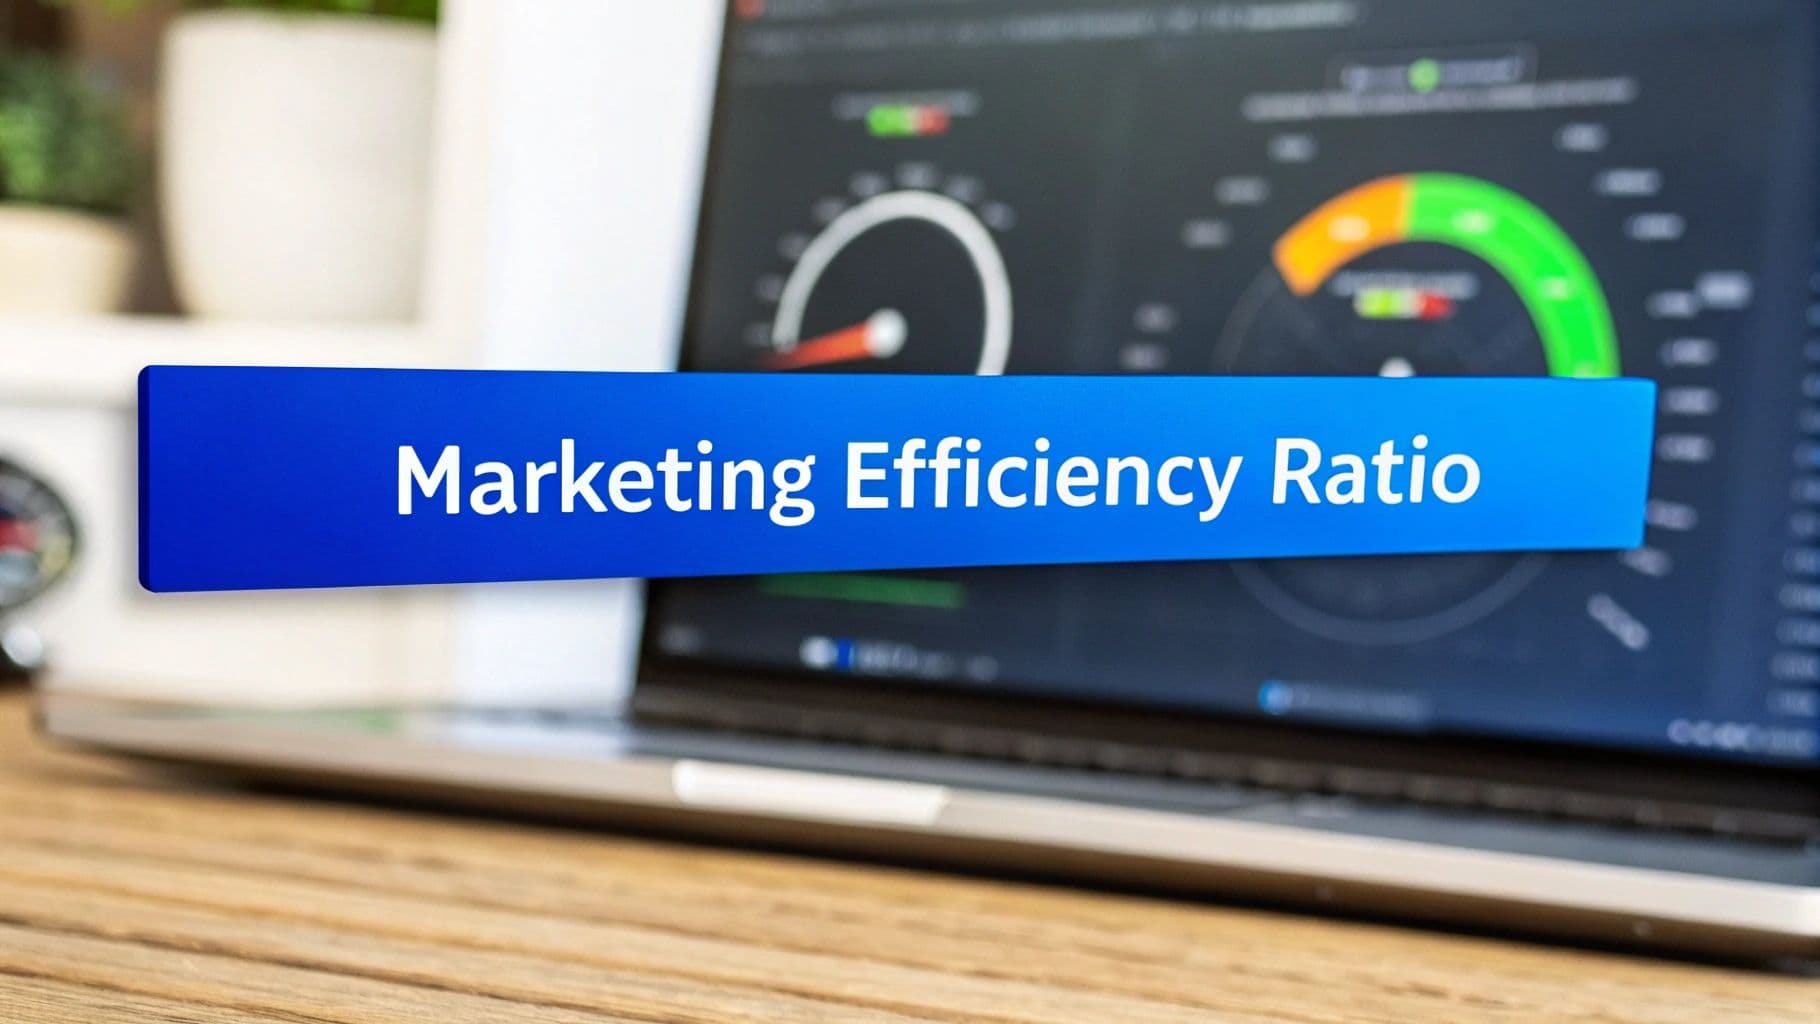
This visual breaks down the simple flow for calculating MER, from gathering revenue and costs to making the final division.
 Mastering Your Marketing Efficiency Ratio
It shows how MER blends all your revenue and marketing expenses into one top-level metric, giving you a true snapshot of performance.
The Gold Standard and Industry Variations
Across many direct-to-consumer businesses, a 5:1 ratio (or a MER of 5) is often seen as the gold standard. Hitting this means for every dollar you spend on marketing, you’re generating five dollars back in revenue. Reaching this mark usually points to a very healthy, profitable marketing engine with plenty of room to scale.
But context is everything. An e-commerce store with thin product margins might need a MER of 5 or higher just to break even. On the other hand, a SaaS business with a high customer lifetime value (LTV) could be thriving with a MER of 3, because they know that recurring subscription revenue will make that initial investment incredibly profitable over time.
To really nail this down, you need to understand your profit margins. For a deeper look at this, check out the 7 essential metrics every SaaS company should care about.
Expert Insight: Don't just chase a universal benchmark. The most important comparison is your MER today versus your MER last quarter. Consistent improvement is a stronger sign of health than simply hitting an arbitrary number.
Interpreting Your Marketing Efficiency Ratio
To make this more practical, let's break down what different MER values typically signal and what your next move should be. Your ratio isn't just a grade; it's a diagnostic tool that tells you where to focus your attention.
This is especially critical when you realize how much is at stake. With marketing budgets on the rise, efficiency is everything. Some reports show that companies can waste roughly 26% of their marketing budgets on the wrong channels or strategies. A clear metric like MER helps you plug those leaks. You can learn more in this report on maximizing marketing ROI.
The table below breaks down different MER ranges to help you translate your number into a clear strategic direction.
Interpreting Your Marketing Efficiency Ratio
This table helps you understand what different MER values mean and what actions to consider based on your results.
MER Value | Interpretation | Recommended Action |
|---|---|---|
Below 2 | Inefficient Spend: You're spending more on marketing than you are likely generating in profit. This level is unsustainable and signals a significant problem with your strategy or channel mix. | Immediately pause underperforming campaigns. Conduct a full audit of your ad spend, targeting, and creative to identify the biggest leaks in your budget. |
2 to 4 | Needs Optimization: Your marketing is generating returns but is likely not as profitable as it could be. There is significant room for improvement and efficiency gains. | Begin A/B testing ad creatives and landing pages. Analyze your channel mix and consider reallocating budget from lower-performing channels to higher ones. |
5 to 7 | Strong and Profitable: You've achieved a healthy and efficient marketing engine. This is a strong indicator that your strategy is working well and is highly profitable. | Focus on scaling what works. Cautiously increase budgets on your top-performing channels while continuing to test new creative and audience segments to maintain efficiency. |
8 and Above | Hyper-Growth or Underinvestment: This is an excellent return, but it could also mean you're not investing enough in marketing and may be missing out on growth opportunities. | It's time to scale aggressively. Invest more heavily in your proven channels and explore expanding into new, adjacent marketing channels to capture more market share. |
Ultimately, your MER is a compass. It tells you which direction your marketing is headed. By understanding the context behind your number, you can move beyond simple calculation and start making smarter, data-driven decisions that fuel real, sustainable growth.
Common Mistakes to Avoid When Tracking MER
Your marketing efficiency ratio gives you a powerful number, but that number is only as good as the data and context behind it. A simple misstep can turn this reliable compass into a misleading map, pointing your entire strategy in the wrong direction.
Figuring out how to use MER correctly is just as important as the calculation itself. By understanding and sidestepping a few common pitfalls, you can make sure your ratio is a true reflection of business health, not just a vanity metric masking deeper problems.
Mistake 1: Viewing MER in a Vacuum
One of the biggest errors is treating MER as a standalone metric. While it gives you a brilliant high-level view, it doesn’t tell you the whole story about profitability or customer value.
For example, a "good" MER of 4.0 can still lead to losses if your product margins are razor-thin. Say your cost of goods sold (COGS) and operational expenses eat up 80% of your revenue. That 4.0 MER means you're spending $1 to make $4 in revenue. But if it costs you $3.20 just to produce and ship the product, you're left with only $0.80 before paying for the marketing that drove the sale. Suddenly, you're in the red.
Key Takeaway: Always analyze your MER alongside critical metrics like Customer Acquisition Cost (CAC) and Lifetime Value (LTV). This combination paints a much clearer picture of sustainable growth and long-term profitability.
Mistake 2: Using Incomplete Cost Tracking
An artificially high MER is often the result of lazy or incomplete cost tracking. It’s a classic mistake: only including direct ad spend in your "Total Marketing Costs," which creates a dangerously inflated and misleading ratio.
To get an accurate MER, you absolutely have to account for every single expense related to your marketing efforts.
Forgetting to include a $10,000 monthly agency fee or $15,000 in team salaries will dramatically skew your numbers, making your marketing seem far more efficient than it really is.
Mistake 3: Ignoring Attribution Lag
Another critical mistake is judging all of your marketing efforts through a short-term lens. MER is usually calculated monthly or quarterly, which can unfairly penalize strategies that have a much longer-term payoff.
Think about channels like SEO and content marketing. The blog post you publish today might not generate significant revenue for six months, but its impact will be long-lasting. If you only look at this month's MER, that content creation cost looks like it had zero return, dragging your ratio down.
This issue of attribution lag is a huge hurdle for marketers. Efforts that build brand awareness and top-of-funnel interest don't always lead to immediate sales, yet they are vital for sustained growth. To get a better handle on this, you can explore some of the common attribution challenges in marketing that affect how we all measure performance.
By sidestepping these common mistakes, you can transform MER from a simple number into a truly strategic tool for making smarter, more profitable decisions.
Actionable Strategies to Improve Your Marketing Efficiency
 Mastering Your Marketing Efficiency Ratio
Knowing your marketing efficiency ratio is one thing, but actually improving it is where the real growth kicks in. A low or stagnant MER isn't a dead end—think of it as a flashing sign telling you it's time to fine-tune your strategy and start making smarter, more profitable moves.
Boosting your MER isn't always about throwing more money at the problem. Most of the time, it's about being smarter with what you already have: reallocating resources, optimizing your current assets, and holding onto the customers you worked so hard to win.
Let’s walk through four high-impact pillars that can systematically lift your marketing efficiency. These are practical, real-world strategies that turn MER insights into measurable results, making every single marketing dollar work harder for your business.
Reallocate Your Budget to High-Impact Channels
Let's be honest: not all marketing channels are created equal. Some are reliable revenue machines, while others are quietly burning through your budget with little to show for it. The first step to a better MER is figuring out your winners and losers, then shifting your spend accordingly.
Dive into your analytics and find out which channels consistently deliver the goods. Is your email marketing bringing in way more revenue per dollar than your social media ads? The data will tell the story.
Once you’ve identified your top performers, you can make some strategic shifts. This doesn't mean you have to kill your underperforming channels entirely, but it definitely means you should prioritize the ones that have proven their worth. This approach is a core principle of effective marketing spend optimization, focusing your budget where it will make the biggest splash.
For example, a direct-to-consumer brand might discover their Google Shopping ads have a solid 8.0 MER, while their TikTok ads are lagging at 2.5. By simply moving 20% of the TikTok budget over to Google Shopping, they can get an immediate lift in overall efficiency without spending a penny more.
Focus Intensely on Conversion Rate Optimization
Driving traffic is only half the battle. If your website and landing pages aren't turning visitors into customers, you're essentially pouring water into a leaky bucket. This is where Conversion Rate Optimization (CRO) comes in—it’s all about tweaking your website to get more visitors to take the action you want.
Even tiny improvements to your conversion rate can have a massive impact on your MER. A 1% bump in conversions means more revenue from the exact same traffic and marketing spend. It’s a direct boost to your efficiency.
Key Insight: Improving your conversion rate is one of the most powerful ways to boost your MER because it maximizes the value of the traffic you're already paying for. It's about working smarter, not just spending more.
Start by mapping out your user journey to find the friction points. Where are people dropping off? A few key areas to focus on include:
Streamline Operations with Marketing Automation
Manual, repetitive tasks are a huge drain. They don't just eat up valuable time; they also lead to inefficiencies and errors that can pull your MER down. This is where marketing automation completely changes the game, letting you streamline operations and deliver personalized experiences at scale.
Automation platforms can handle things like welcome emails, lead nurturing, and segmenting your audience based on their behavior. This frees up your team to focus on big-picture strategy instead of getting bogged down in the daily grind. You can learn more about what marketing automation for retailers involves to get started.
For instance, an e-commerce store can set up an automated abandoned cart email sequence. This series of emails can recover a huge chunk of otherwise lost sales, directly increasing revenue with no extra ad spend. That’s a pure win for your marketing efficiency ratio.
Double Down on Customer Retention
Acquiring a new customer is expensive—it can cost up to five times more than keeping an existing one. Because of this, focusing on customer retention is one of the most sustainable ways to improve your MER for the long haul.
When you increase the lifetime value (LTV) of your customers, you're squeezing more revenue out of your original marketing investment. The money you spent to acquire them months or even years ago continues to pay off, which naturally pushes your overall efficiency higher.
By putting these strategies into action, you can systematically improve your marketing efficiency and ensure your budget is invested wisely to fuel profitable, sustainable growth.
A Few Lingering Questions About MER
Even after you get the hang of the marketing efficiency ratio, a few questions tend to pop up. Nailing down the answers is the final step to really mastering this metric and putting it to work for you.
Let's clear up some of the most common points of confusion so you can start using MER with total confidence.
How Is MER Different From ROAS?
This is, without a doubt, the number one question people ask. And for good reason. Both MER and Return on Ad Spend (ROAS) measure your marketing returns, but they're looking at your business from completely different altitudes.
Think of it like this: ROAS is like checking the fuel efficiency of a single engine on a jumbo jet. MER tells you the fuel efficiency of the entire plane.
ROAS is a granular, tactical metric. It’s laser-focused on a specific ad campaign and its direct results. You calculate it by dividing the revenue from that one campaign by its cost. It answers the question, "For every dollar I put into this specific Google Ad, how many dollars did it bring back?" This makes ROAS perfect for in-the-weeds, day-to-day decisions, like tweaking an ad set on Facebook.
MER, on the other hand, is a high-level, strategic metric. It zooms way out, dividing your total company revenue by your total marketing spend. It answers a much bigger question: "For every dollar we invested across our entire marketing ecosystem—salaries, software, agencies, and ads included—how much total revenue did we generate as a business?"
Key Takeaway: Use ROAS to optimize the individual trees (campaigns and channels). Use MER to judge the health of the entire forest (your overall marketing strategy) and make big-picture budget decisions. A sky-high ROAS with a dismal MER is a red flag that your ads are working, but other marketing costs are quietly sinking the ship.
How Often Should I Calculate My MER?
There's no single right answer here—the best cadence for calculating your marketing efficiency ratio really depends on your business model and how long it takes a customer to buy from you.
But here are a few solid guidelines to get you started:
The most important thing is consistency. Pick a rhythm that makes sense for your sales cycle and stick to it. That's how you build reliable benchmarks and track your progress over time.
Can Service-Based or B2B Companies Use MER?
Absolutely. While you often hear MER discussed in the e-commerce world, its core principle is universal and incredibly powerful for B2B and service-based businesses. You just need to slightly adjust your thinking.
For a B2B SaaS company, "Total Revenue" could be the new Monthly Recurring Revenue (MRR) or Annual Recurring Revenue (ARR) you generated in a specific period. "Total Marketing Costs" would be everything from content production and webinar software to the salaries of your demand gen team. The resulting MER tells you exactly how efficiently you're turning marketing dollars into new, sticky revenue.
Likewise, if you run a service business like a digital agency or a consulting firm, "Total Revenue" might be the total value of new contracts signed in a quarter. This gives you a direct line of sight into how well your marketing is fueling new client acquisition. The benefit is the same: it gives you one holistic number to see if your marketing engine is actually working.
Ready to get a crystal-clear view of your marketing performance without the guesswork? Cometly unifies all your data, providing the accurate attribution you need to calculate your MER with confidence and make smarter, data-driven decisions. See how Cometly can transform your marketing analytics.


