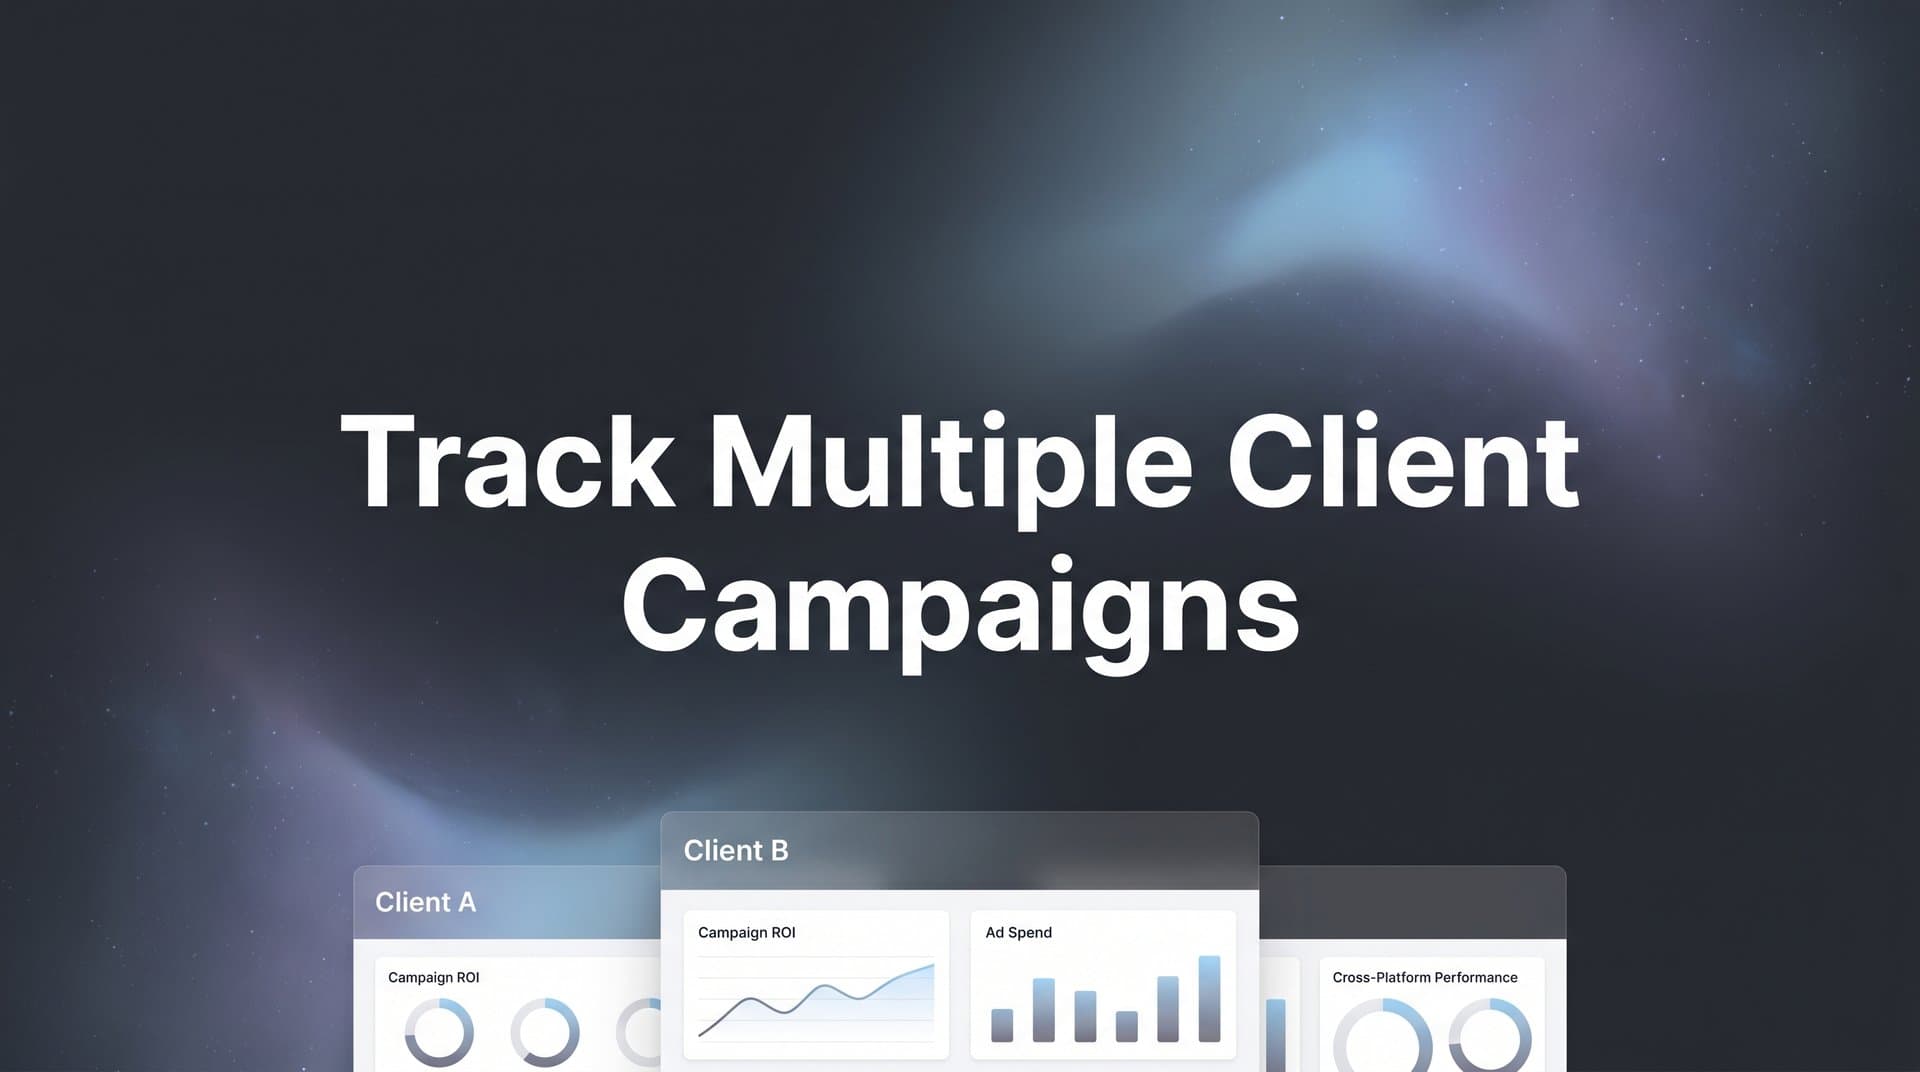
Managing campaigns for one client is challenging enough. When you scale to five, ten, or twenty clients, each running ads across Meta, Google, TikTok, and LinkedIn, tracking becomes a tangled mess of spreadsheets, platform logins, and conflicting data. The result? Hours wasted switching between dashboards, missed optimization opportunities, and clients asking questions you cannot answer quickly.
Picture this: It's Monday morning, and three clients want to know why their weekend performance dipped. You're toggling between Meta Ads Manager, Google Ads, TikTok's dashboard, and two different CRM systems, trying to piece together a coherent story. By the time you've compiled the data, it's already outdated, and you've burned two hours that could have been spent optimizing campaigns.
This scenario plays out daily in agencies worldwide. The problem isn't your team's competence. It's that traditional tracking methods weren't built for the multi-client, cross-platform reality of modern digital marketing. Each platform reports data differently, attributes conversions through its own lens, and updates on its own schedule.
This guide walks you through a proven system for tracking multiple client campaigns from a single source of truth. You will learn how to set up proper campaign structures, connect all data sources, build client-specific dashboards, and automate reporting so you can spend less time compiling data and more time driving results.
Whether you manage three clients or thirty, these steps will help you bring clarity to your multi-client tracking workflow. The system we're outlining scales with your agency, prevents data chaos before it starts, and gives you the confidence to answer client questions in minutes instead of hours.
Step 1: Establish a Consistent Campaign Naming Convention Across All Clients
Before you connect a single data source or build a dashboard, you need a naming system that works across every client and platform. Without this foundation, your tracking system becomes a nightmare of guesswork and manual sorting.
Think of campaign naming conventions like the Dewey Decimal System for libraries. Every book needs a consistent location identifier, or finding anything becomes impossible. Your campaigns need the same structure.
Create a standardized naming structure that includes four essential elements: client identifier, platform, campaign type, and time period. A solid format looks like this: CLIENT_PLATFORM_OBJECTIVE_TIMEFRAME. For example: ACME_META_PROSPECTING_Q2-2026 or TECHCO_GOOGLE_RETARGETING_APR2026.
The client identifier should be short but unique. Use acronyms or shortened versions of company names. Avoid generic terms that could apply to multiple clients. ACME works better than ECOM1 when you're trying to identify campaigns at a glance.
Platform codes should be consistent: META for Facebook and Instagram, GOOGLE for Google Ads, TIKTOK for TikTok Ads, LINKEDIN for LinkedIn Ads, MSFT for Microsoft Ads. Keep them uppercase and uniform across all campaigns.
Campaign type tells you the objective at a glance: PROSPECTING, RETARGETING, BRAND, LEADGEN, or whatever categories align with your strategy. This element becomes crucial when you're analyzing performance across clients and need to compare similar campaign types.
The time period helps you track campaign lifecycles and seasonal performance. Use quarters (Q1-2026) for ongoing campaigns or months (JAN2026) for shorter initiatives. Consistency here prevents confusion when campaigns overlap or restart.
Document your naming convention in a shared resource your entire team can access. Create a simple one-page guide with examples for each platform and campaign type. Include edge cases: What happens when a client runs multiple prospecting campaigns simultaneously? How do you differentiate test campaigns from production campaigns?
Now comes the tedious but essential part: apply this structure retroactively to existing campaigns. Yes, this means renaming active campaigns across multiple platforms. Schedule this work during low-traffic periods to minimize disruption. Verify that names match exactly across ad platforms and your tracking system because even small discrepancies create data gaps.
The payoff arrives immediately. When you open your attribution dashboard, you can instantly identify which campaigns belong to which clients, what objectives they serve, and when they launched. No more decoding cryptic campaign names or asking team members what "Campaign 47" was supposed to accomplish. This clarity is essential for effective ad tracking for multiple clients.
Step 2: Connect All Ad Platforms and Data Sources to a Central Attribution System
With your naming convention in place, it's time to build the data pipeline that feeds your tracking system. This step transforms scattered platform data into a unified view of campaign performance across all clients.
Start by linking each client's ad accounts to your attribution platform. For Meta, this means connecting their Business Manager account and granting appropriate permissions. Google requires linking through their Ads API. TikTok, LinkedIn, and Microsoft each have their own connection processes, but the principle remains consistent: authorize your attribution system to pull campaign data, ad performance metrics, and conversion events.
When connecting platforms, verify you're pulling all relevant data fields. You need more than just spend and clicks. Pull impression data, engagement metrics, conversion events, and revenue when available. The richer your data set, the more accurate your attribution becomes.
Here's where many agencies stop, and it's a critical mistake. Ad platform data only tells half the story. You need to integrate CRM systems to track conversions across multiple ad platforms beyond the initial click through to closed revenue. Connect HubSpot, Salesforce, Pipedrive, or whatever CRM your clients use.
CRM integration reveals the true value of your campaigns. A lead might click a Meta ad today, download a resource from a Google ad next week, and close as a customer thirty days later after a sales call. Without CRM data, you're optimizing based on incomplete information, potentially cutting budgets from campaigns that drive high-value customers with longer sales cycles.
Set up the integration to sync both ways when possible. Your attribution platform should pull deal values, lead statuses, and customer lifetime value from the CRM. Ideally, it should also push enriched conversion data back to ad platforms, which improves their algorithms' ability to find similar high-value prospects.
Now implement server-side tracking, which has become essential as browser-based tracking loses accuracy. iOS App Tracking Transparency restrictions and ad blockers mean traditional pixel-based tracking misses significant portions of your conversion data. Understanding server-side tracking vs client-side helps you capture events directly from your server, bypassing browser limitations.
Install server-side tracking for conversion events that matter most: form submissions, purchases, demo bookings, and qualified lead events. Configure your tracking to send these events to your attribution platform and back to ad platforms through Conversion APIs. This approach ensures ad algorithms receive accurate conversion data even when browser tracking fails.
Test each connection thoroughly before moving forward. Trigger test conversions and verify they appear correctly in your attribution platform. Check that revenue values match between your CRM and tracking system. Confirm that ad spend data aligns with what platforms report natively.
Document the connection process for each platform and client. When you onboard new clients or troubleshoot data issues, you'll reference this documentation constantly. Include API credentials, webhook URLs, and any custom configuration details specific to each integration.
Step 3: Create Separate Workspaces or Views for Each Client
Your data sources are connected, but without proper organization, you'll drown in a sea of mixed client information. Separate workspaces transform your attribution platform from a data warehouse into a usable tool.
Set up dedicated client workspaces that isolate each client's data while allowing you to view aggregate performance when needed. Think of these as separate offices within your agency building. Each client gets their own space with their own data, but you maintain master access to see across all spaces.
Most attribution platforms support workspace or account-level segmentation. Create one workspace per client and configure it to pull only that client's ad accounts, CRM data, and website tracking. This isolation prevents data bleed between clients and ensures team members see only relevant information.
Configure user permissions carefully. Your account manager for Client A should access Client A's workspace but not Client B's data. Team members managing multiple clients need access to those specific workspaces. Agency leadership typically needs access to all workspaces for oversight and cross-client analysis.
Permission management becomes crucial when team members transition between accounts or leave your agency. Immediately revoke access when someone stops managing a client. Audit permissions quarterly to ensure no one has access they no longer need.
Organize clients by industry, spend level, or team assignment for faster navigation. If you manage ten e-commerce clients and five B2B SaaS clients, group them accordingly. This organization helps when you're analyzing industry benchmarks or comparing performance across similar business models. Proper attribution reporting for multiple clients depends on this structured approach.
Within each workspace, maintain consistent dashboard layouts and metric definitions. When you switch from Client A to Client B, the interface should feel familiar. Use the same KPIs, the same chart types, and the same reporting periods across all client workspaces. This consistency speeds up your analysis and reduces cognitive load when context-switching between clients.
Create a master workspace that aggregates high-level metrics across all clients. This view helps you spot trends affecting multiple clients simultaneously, like platform-wide performance shifts or seasonal patterns. It also gives leadership a quick pulse check on overall agency performance without diving into individual client data.
Step 4: Build Custom Dashboards That Show Cross-Platform Performance
Separate workspaces solve the organization problem, but dashboards solve the insight problem. A well-designed dashboard transforms raw data into actionable intelligence that guides optimization decisions.
Design dashboards that display unified metrics across all platforms for each client. The goal is answering the question: "How are we performing overall?" before diving into platform-specific details. Start with the metrics that matter most: total revenue, return on ad spend, cost per acquisition, and conversion rate.
Your marketing dashboard for multiple campaigns should show these metrics calculated across all platforms combined, then broken down by individual platform. This structure reveals which channels drive the best results and where budget reallocation might improve overall performance.
Include attribution model comparisons to show clients how different touchpoints contribute to conversions. Display first-click, last-click, and multi-touch attribution side by side. This comparison educates clients about the customer journey and prevents them from making decisions based solely on last-click data, which often undervalues awareness and consideration touchpoints.
For example, your dashboard might show that Google Search appears to drive 60% of conversions in a last-click model but only 35% in a multi-touch model, while Meta's contribution increases from 20% to 40%. This insight prevents clients from cutting Meta budgets based on incomplete attribution understanding.
Add trend visualizations that highlight week-over-week and month-over-month changes at a glance. Line charts showing ROAS trends over the past 90 days reveal patterns that daily snapshots miss. Include comparison periods so you can quickly assess whether current performance is above or below historical norms.
Create separate dashboard sections for different stakeholder needs. Executives want high-level revenue and ROAS. Media buyers need granular campaign performance data. Account managers need client-ready visualizations. Build views that serve each audience without overwhelming them with irrelevant data.
Use color coding strategically. Green for metrics exceeding targets, yellow for metrics approaching thresholds, red for underperformance. This visual system lets you scan dashboards quickly and identify issues that need immediate attention.
Include custom date range selectors that let you analyze any time period. Sometimes you need to examine the past seven days, sometimes the past quarter, sometimes a specific promotional period. Flexible date controls prevent you from being locked into preset reporting periods that don't match your analysis needs.
Add campaign-level drill-down capabilities. Your top-level dashboard shows overall performance, but you should be able to click through to see individual campaign metrics, ad set performance, and even creative-level data. This hierarchical structure supports both
Step 5: Set Up Automated Alerts for Budget Pacing and Performance Anomalies
Dashboards are powerful, but they require you to look at them. Automated alerts bring critical issues to your attention before they become expensive problems.
Configure alerts when a client's spend exceeds or falls behind monthly budget targets. Set thresholds at 80% and 120% of expected daily pacing. If a client has a monthly budget of thirty thousand dollars, you expect roughly one thousand dollars in daily spend. An alert at eight hundred dollars warns you're underspending, while an alert at twelve hundred dollars flags overspending.
Budget pacing alerts prevent month-end scrambles where you realize you've spent only 60% of budget with three days remaining or burned through 90% of budget by mid-month. Both scenarios hurt performance. Underspending leaves money on the table and reduces your ability to gather optimization data. Overspending either exceeds client budgets or forces you to pause campaigns prematurely.
Create notifications for sudden drops in conversion rates or spikes in cost per acquisition. Define "sudden" based on each client's normal variance. A 20% day-over-day fluctuation might be normal for a small-budget client but alarming for a high-volume account. Set client-specific thresholds that account for their typical performance patterns.
When conversion rates drop significantly, you need to investigate immediately. The cause might be tracking issues, landing page problems, ad fatigue, or audience saturation. The faster you identify and address these issues, the less budget you waste on underperforming campaigns. Addressing advertising campaign tracking gaps early prevents costly data blind spots.
Establish threshold-based alerts for each client based on their specific KPIs and goals. An e-commerce client might need alerts when ROAS drops below 3.5x. A lead generation client might care most about cost per qualified lead staying under fifty dollars. A brand awareness client might track cost per thousand impressions and engagement rates.
Configure alerts to notify the right people through the right channels. Send critical alerts via Slack or text message for immediate attention. Route less urgent notifications to email. Avoid alert fatigue by being selective about what triggers notifications. Too many alerts and your team starts ignoring them.
Set up weekly summary alerts that compile performance across all clients. These summaries give you a regular pulse check without requiring daily dashboard reviews. Include metrics like total spend, aggregate ROAS, number of conversions, and any clients trending significantly above or below their targets.
Test your alerts regularly. Trigger test conditions to verify notifications arrive as expected and contain the information you need to take action. Nothing undermines confidence in your tracking system faster than discovering alerts weren't working when a client's campaign went sideways.
Step 6: Schedule Automated Reports for Each Client
Alerts handle urgent issues, but clients need regular reporting that shows progress toward their goals. Automated reports eliminate the manual work of compiling performance updates and ensure clients receive consistent communication.
Build report templates that pull data automatically from your attribution system. These templates should include the metrics each client cares about most, formatted in a way that's easy to understand. Avoid dumping raw data tables into reports. Use visualizations, summary statistics, and narrative explanations that provide context.
Your report template should include several standard sections. Start with an executive summary highlighting key wins, concerns, and recommended next steps. This section answers the question every client asks first: "How are we doing?"
Follow with platform performance breakdowns showing spend, conversions, and efficiency metrics for each channel. Include period-over-period comparisons so clients see whether performance is improving or declining. Add attribution model views that show how different touchpoints contribute to the customer journey. Understanding multiple touchpoint tracking complexity helps you explain these insights clearly.
Include a section on optimization actions taken during the reporting period. What campaigns did you launch, pause, or adjust? What creative tests are running? What budget reallocations occurred? This transparency builds trust and demonstrates active management.
Set weekly or monthly delivery schedules directly to client inboxes. Weekly reports work well for high-spend clients or those in rapid growth phases. Monthly reports suit clients with longer sales cycles or more stable campaign structures. Match reporting frequency to client needs and campaign dynamics.
Schedule reports to arrive at consistent times. Monday morning reports give clients performance updates to start their week. Friday afternoon reports let them review performance before the weekend. Choose timing that aligns with client preferences and internal meeting schedules.
Customize reports for different stakeholders within client organizations. The CEO wants high-level revenue impact. The marketing manager wants detailed campaign performance. The CFO wants budget pacing and ROI metrics. Create role-specific report versions that highlight relevant information for each recipient.
Include recommendations in every report. Don't just present data. Tell clients what you plan to do based on what the data reveals. This proactive approach positions you as a strategic partner rather than a reporting service. Clients should finish reading your reports with clear understanding of both performance and next steps.
Build in flexibility for custom reporting requests. Some clients need ad hoc reports for board meetings or investor updates. Your system should allow you to generate custom date ranges, metric combinations, and formats without starting from scratch each time.
Step 7: Review and Optimize Your Tracking System Monthly
Your tracking system isn't set-it-and-forget-it infrastructure. It requires regular maintenance to ensure accuracy and adapt to changing client needs. Monthly audits keep your system reliable and your data trustworthy.
Audit data accuracy by comparing attribution data against platform-reported conversions. Pull conversion counts from Meta Ads Manager, Google Ads, and other platforms. Compare these numbers to what your attribution system reports. Small discrepancies are normal due to attribution window differences, but large gaps indicate tracking problems.
When you find discrepancies, investigate immediately. Check that tracking pixels fire correctly, server-side events send properly, and conversion definitions match across systems. Document what you find and how you resolved it. These notes become invaluable when similar issues arise with other clients. Understanding client-side tracking limitations helps you diagnose common accuracy problems.
Update tracking parameters when clients launch new campaigns or change their tech stack. A client adding a new landing page platform, switching CRMs, or launching campaigns on a new ad channel requires tracking updates. Stay ahead of these changes by maintaining regular communication with clients about their marketing technology roadmap.
Review your naming convention compliance. Scan campaign names across all clients and flag any that don't follow your established structure. Inconsistent naming might indicate team members who need training or clients creating campaigns without agency involvement. Address these issues before they multiply.
Analyze which metrics and dashboards your team actually uses. If certain dashboard sections go ignored month after month, remove them. If team members constantly request the same custom reports, build them into standard dashboards. Your tracking system should evolve based on how people actually work, not how you initially imagined they would.
Document any discrepancies and refine your process for onboarding new clients. Every tracking issue you encounter teaches you something about what to check during client setup. Build these lessons into your onboarding checklist so new clients launch with more robust tracking from day one.
Review alert effectiveness. Are you getting alerts that don't require action? Are critical issues slipping through without triggering notifications? Adjust thresholds and alert rules based on real-world experience. The goal is catching problems early without creating alert fatigue.
Schedule these audits as recurring calendar events. Block two hours monthly for tracking system review. Treat this time as non-negotiable. The cost of poor data quality far exceeds the time investment in maintaining accurate tracking.
Bringing It All Together: Your Path to Streamlined Multi-Client Tracking
Tracking multiple client campaigns does not have to mean drowning in spreadsheets and platform tabs. By establishing consistent naming conventions, centralizing your data sources, building client-specific dashboards, and automating your reporting, you create a scalable system that grows with your agency.
The transformation happens gradually but powerfully. In week one, you'll notice how much faster you can answer client questions when all data lives in one place. By month two, you'll realize you're spending hours less on manual reporting. By quarter two, you'll wonder how you ever managed multiple clients without this system.
Your quick implementation checklist: Document and apply your naming convention today. Connect all client ad platforms and CRMs this week. Set up client workspaces and permissions. Build your first cross-platform dashboard. Configure budget and performance alerts. Schedule automated client reports. Block time monthly for tracking audits.
Start with your highest-spend clients or those with the most complex tracking needs. Perfect the system with a few clients before rolling it out across your entire roster. This phased approach lets you refine processes and train your team without overwhelming everyone simultaneously.
Remember that the goal isn't perfect data. The goal is actionable data that helps you make better decisions faster. A tracking system that's 95% accurate and updated in real time beats a system that's 100% accurate but requires three hours of manual work to compile.
The competitive advantage comes not from having data but from using it effectively. Agencies that can quickly identify optimization opportunities, reallocate budgets based on performance, and demonstrate clear ROI to clients win more business and retain clients longer. Your tracking system becomes the foundation for these capabilities.
Ready to see how a unified attribution platform can simplify multi-client tracking? Explore how Cometly helps agencies track every touchpoint across all clients from one dashboard. Capture every interaction from ad clicks to CRM events, get AI-powered recommendations to identify high-performing campaigns, and feed enriched conversion data back to ad platforms to improve targeting and optimization. Get your free demo today and start capturing every touchpoint to maximize your conversions.