
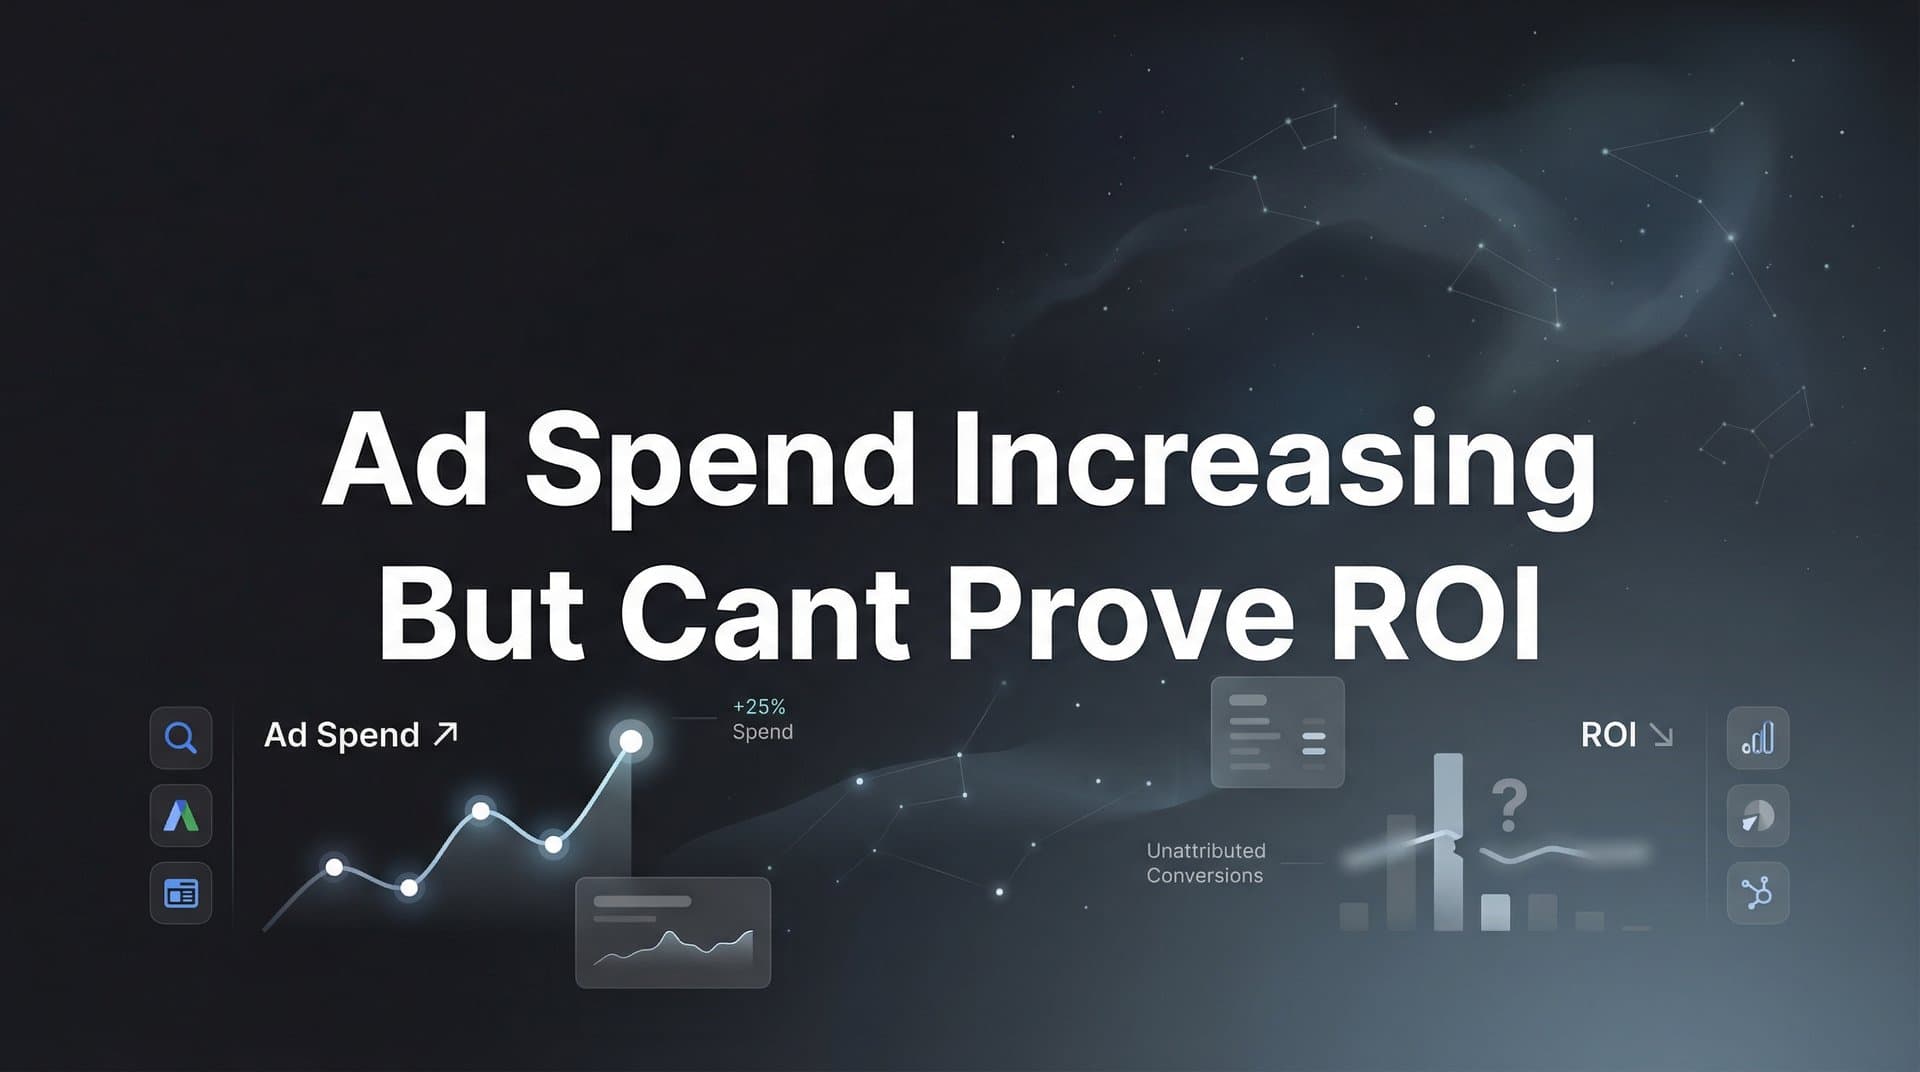
Your ad budget just increased by 30%. Leadership approved it based on your Q4 performance projections. But now they're asking the inevitable question: "What's the actual ROI on this spend?" And you're staring at a dashboard full of numbers that somehow don't tell the complete story.
You know the campaigns are working. You've seen the lead volume increase. Sales keeps mentioning they're closing deals from prospects who clicked your ads. Yet when you try to connect the dots between ad spend and closed revenue, the numbers scatter in different directions. Meta claims 200 conversions. Google says 150. Your CRM shows 180 new customers. None of these figures match, and leadership wants answers.
This isn't a failure of your marketing skills. It's a measurement infrastructure problem that's become increasingly common as marketing has evolved into a complex, multi-channel ecosystem. The good news? Once you understand why this disconnect happens, you can fix it systematically.
The Attribution Gap: Why Your Data Tells an Incomplete Story
Think of your current tracking setup like trying to watch a movie where every streaming service only shows you certain scenes. You know there's a complete story, but you're only seeing fragments from different sources that don't quite connect.
This is the attribution gap, and it's widened dramatically over the past few years. Traditional tracking methods that worked perfectly in 2020 have broken down under the weight of privacy changes, cross-device behavior, and increasingly complex customer journeys.
The most significant disruption came from Apple's iOS privacy updates. When users started opting out of app tracking, advertisers lost visibility into a massive portion of mobile conversions. Your Meta ads might be driving excellent results from iPhone users, but the pixel can't see most of those conversions anymore. The data simply vanishes into a privacy-protected black hole.
Cookie restrictions compound this problem. Browsers like Safari and Firefox block third-party cookies by default. Even Chrome users often browse in incognito mode or use ad blockers. Every blocked cookie represents a broken tracking link in your attribution chain.
Then there's the cross-device reality. A prospect sees your LinkedIn ad on their phone during their morning commute. They research your solution on their work laptop at lunch. They finally convert on their tablet that evening while reviewing options at home. Traditional client-side tracking sees three different "users" and struggles to connect these touchpoints into one coherent journey.
The disconnect between ad platform data and CRM revenue creates another layer of confusion. Meta's dashboard shows 50 conversions from your campaign. But your CRM only recorded 35 new customers from that source. Which number is real? Are you missing conversions, or is Meta overcounting? Without a unified view, you're left guessing.
Multi-touch customer journeys get particularly messy. Someone might click your Google search ad, see your Facebook retargeting campaign, receive your email newsletter, and finally convert through a direct website visit. Each platform wants credit for that conversion. Your Google Ads dashboard counts it. Your Facebook Ads Manager counts it. Your email platform counts it. Suddenly, one customer generates three "conversions" across your reporting.
This isn't just a minor reporting annoyance. When leadership asks for ROI proof and your numbers don't reconcile, it erodes confidence in your entire marketing operation. Budget decisions get delayed. Winning strategies don't get the investment they deserve. Underperforming channels keep getting funded because nobody can definitively prove what's working.
Five Common Culprits Behind Unprovable ROI
Let's diagnose the specific breakdowns that prevent you from proving ROI. These issues rarely occur in isolation. Most marketing teams face multiple measurement problems simultaneously, creating a tangled web of unreliable data.
Siloed Data Sources That Don't Communicate: Your ad platforms live in their own universe. Your website analytics exist separately. Your CRM operates independently. Each system tracks conversions using different methodologies, different attribution windows, and different definitions of what counts as a conversion. When you try to compile a unified ROI report, you're manually stitching together data from systems that were never designed to work together. The result? Discrepancies, duplications, and gaps that make accurate ROI calculation impossible.
Over-Reliance on Last-Click Attribution: Most default attribution models give 100% credit to the final touchpoint before conversion. Someone clicks your brand search ad and converts? Google Ads claims full credit. But what about the Facebook campaign that introduced them to your brand three weeks earlier? What about the LinkedIn ad that educated them on your solution? Last-click attribution systematically undervalues top-of-funnel and mid-funnel marketing efforts, making your awareness campaigns look ineffective even when they're essential to the conversion path. Understanding the difference between single source attribution and multi-touch attribution models is crucial for accurate measurement.
Missing or Broken Tracking Implementation: A developer updated your website and accidentally removed the conversion pixel. Your UTM parameters aren't consistently applied across campaigns. Someone launched a landing page without proper tracking. These technical gaps create blind spots in your data. You're spending money on campaigns that are working, but the conversions never get recorded. When you calculate ROI, these invisible successes make your performance look worse than reality.
Delayed Conversions and Long Sales Cycles: This challenge hits B2B and high-consideration purchases especially hard. Someone clicks your ad today but doesn't convert for 45 days. By then, they've fallen outside your attribution window. The ad platform that drove the initial interest gets zero credit. Your CRM shows a new customer with "Direct" as the source. Your ad campaign looks like it failed when it actually initiated the entire journey. For complex B2B sales with 60-90 day cycles, this timing mismatch systematically underreports campaign effectiveness.
Platform Self-Reporting Bias and Overlapping Claims: Here's the uncomfortable truth: ad platforms are incentivized to show strong performance. Their attribution models are designed to capture as many conversions as possible within their ecosystem. Meta uses a 7-day click and 1-day view attribution window. Google uses 30-day click attribution. TikTok has its own methodology. When the same customer interacts with ads across multiple platforms, each platform legitimately claims the conversion within its attribution rules. Add up all your platform-reported conversions, and you'll count the same customers multiple times. Your total "conversions" might be 400 when you actually closed 250 customers.
These culprits work together to create maximum confusion. You might have siloed data sources AND broken tracking AND overlapping attribution claims all at once. No wonder you can't prove ROI. The measurement infrastructure itself is working against you.
Building a Connected Measurement Framework
Proving ROI requires more than just fixing individual tracking problems. You need a connected measurement framework that captures the complete customer journey and ties it directly to revenue outcomes.
Server-side tracking forms the foundation of this framework. Unlike browser-based pixels that can be blocked by privacy settings or ad blockers, server-side tracking sends conversion data directly from your server to ad platforms and analytics tools. When someone converts on your website, your server communicates that conversion event regardless of cookie restrictions or iOS privacy settings. This dramatically improves data accuracy, often recovering 20-30% of conversions that client-side tracking misses.
The technical implementation matters here. Server-side tracking requires setting up secure server-to-server connections between your website, your CRM, and your ad platforms. This isn't just about installing another pixel. It's about creating a data pipeline that flows reliably even when browser-based tracking fails.
Connecting ad platforms directly to your CRM transforms attribution from guesswork into certainty. Instead of relying on each platform's self-reported conversions, you track what actually matters: closed revenue in your CRM. When someone clicks a Facebook ad, downloads a lead magnet, enters your sales pipeline, and eventually becomes a paying customer, you can trace that entire journey back to the original ad click. You're not measuring conversions anymore. You're measuring actual marketing revenue attribution.
This CRM integration reveals insights that platform dashboards hide. You might discover that your LinkedIn ads generate fewer leads than Facebook, but those LinkedIn leads close at 3x the rate and generate higher lifetime value. Without CRM-level attribution, you'd never see this quality difference. You'd just see lead volume and potentially cut the LinkedIn budget that's actually driving your most valuable customers.
Multi-touch attribution models reflect how customers actually behave in the real world. Instead of giving all credit to the last click, multi-touch models distribute credit across every meaningful touchpoint in the customer journey. Someone might see your YouTube ad (awareness), click your Facebook retargeting campaign (consideration), receive your nurture email (evaluation), and finally convert through a Google search (decision). Multi-touch attribution gives appropriate credit to each stage, showing you the full value of your integrated marketing efforts.
Different multi-touch models serve different purposes. Linear attribution spreads credit evenly across all touchpoints. Time-decay attribution gives more credit to recent interactions. Position-based attribution emphasizes the first and last touchpoints. The key is choosing a model that matches your actual customer journey patterns and applying it consistently across all channels for fair comparison.
From Vanity Metrics to Revenue Proof
Proving ROI means shifting your entire measurement mindset from activity metrics to revenue outcomes. Clicks and impressions don't pay your salary. Closed deals do.
Cost per acquisition becomes your North Star metric. Not cost per click. Not cost per lead. Cost per actual customer. When you calculate CPA using real CRM data, you see the true efficiency of each marketing channel. That Facebook campaign with a $12 CPA based on platform-reported conversions? It might actually be $35 CPA when you track to closed customers. That Google Ads campaign that looks expensive at $50 per lead? It might deliver a $120 CPA with a 42% close rate, making it your most efficient channel.
Customer lifetime value completes the ROI picture. A $120 CPA looks expensive until you realize those customers generate $2,400 in lifetime value. Suddenly, that "expensive" channel is your most profitable investment. Many marketers optimize for the lowest CPA without considering that different channels attract different quality customers. LTV-based analysis reveals which channels drive not just customers, but valuable customers worth acquiring.
Creating revenue-connected dashboards transforms stakeholder conversations. Instead of showing leadership a spreadsheet of clicks, impressions, and platform-reported conversions, you present a clean view of marketing spend mapped directly to closed revenue. Leadership sees that you spent $50,000 on paid ads last month and generated $180,000 in new customer revenue. That's a 3.6x return. That's provable ROI. Learn more about how to prove marketing ROI to executives with confidence.
These dashboards need to update in real time, not monthly. When you can see today's ad spend connected to this week's pipeline movement, you make smarter optimization decisions. You notice that your Monday morning campaigns consistently outperform Thursday afternoon campaigns. You see that certain ad creatives drive higher-quality leads that close faster. You catch underperforming campaigns within days instead of discovering problems weeks later when you've already wasted budget.
Real-time visibility also accelerates your testing cycles. You launch three new ad variations on Monday. By Wednesday, you have enough signal to see which creative is driving the best quality leads. You pause the underperformers and scale the winner. This rapid iteration compounds into significantly better performance over time compared to waiting for monthly reports to guide your optimization.
The psychological impact matters too. When you can prove ROI clearly, you stop defending your budget and start confidently requesting more investment in what's working. Leadership stops viewing marketing as a cost center and starts seeing it as a revenue engine with measurable returns.
Turning Better Data Into Smarter Spending
Accurate attribution data doesn't just help you prove ROI to leadership. It fundamentally changes how you allocate budget and optimize campaigns.
With clear revenue attribution, you can identify your true performance winners. That brand awareness campaign you almost cut because it had a high CPA? Your data now shows it's actually your most efficient customer acquisition channel when you account for its role in assisted conversions. Those expensive LinkedIn ads? They're generating your highest LTV customers even though the volume is lower. These insights let you confidently invest more in what's genuinely driving results rather than what looks good in isolated platform dashboards.
Budget reallocation becomes strategic rather than reactive. Instead of cutting underperforming campaigns based on incomplete data, you shift budget toward proven revenue drivers. You might discover that increasing your YouTube ad spend by 40% would generate a predictable increase in high-value customers based on historical attribution patterns. You can make that recommendation with confidence because you're working from complete data, not platform-reported estimates. Implementing proper ad spend ROI tracking makes these decisions data-driven rather than guesswork.
Feeding enriched conversion data back to ad platforms creates a powerful optimization loop. When you send server-side conversion events that include revenue values, customer quality indicators, and complete attribution data, you're teaching the platform's algorithm what success actually looks like. Meta's algorithm learns that conversions from your enterprise segment are worth 5x more than small business conversions. Google's smart bidding optimizes not just for conversion volume, but for the specific customer profiles that generate the highest LTV.
This data enrichment dramatically improves ad platform performance. Platforms optimize better when they understand what "good" looks like. If you're only sending basic conversion events, the algorithm treats all conversions equally. It might drive 100 conversions from low-value customers instead of 40 conversions from high-value customers. When you send enriched data that includes revenue values and customer segments, the algorithm learns to prioritize quality over quantity.
Your creative testing becomes more sophisticated too. Instead of optimizing for click-through rate or cost per lead, you optimize creative variations based on which ones drive customers that actually close and generate revenue. You might discover that your benefit-focused ad creative drives fewer leads but higher-quality prospects that convert at 2x the rate. Without revenue-level attribution, you'd never identify this quality difference. These are just some of the tips to improve ad performance that become possible with accurate data.
Confident budget allocation eliminates the guesswork that plagues most marketing teams. You're no longer making decisions based on incomplete platform data and gut feeling. You're making decisions based on proven performance tied directly to revenue outcomes. When leadership asks why you want to increase the Google Ads budget by $20,000 next quarter, you can show them exactly how the last $20,000 generated $85,000 in closed revenue and explain why the same pattern will continue.
Putting It All Together
The inability to prove ROI isn't a reflection of your marketing skills or campaign quality. It's a measurement infrastructure problem that's become increasingly common as privacy changes, multi-channel complexity, and attribution gaps have made traditional tracking methods inadequate.
The diagnostic areas we've covered point to a clear solution path: connect all your data sources, implement server-side tracking to capture complete conversion data, integrate your CRM with your ad platforms for revenue-based attribution, adopt multi-touch attribution models that reflect real customer journeys, and shift your focus from vanity metrics to revenue outcomes.
Solving these measurement challenges transforms marketing from a cost center that constantly needs to justify its budget into a proven revenue driver with clear, demonstrable returns. You move from defensive conversations about spend to confident discussions about scaling what's working. Leadership stops questioning your budget requests and starts asking how they can invest more in your proven channels.
The data infrastructure you build today becomes your competitive advantage tomorrow. While other marketers struggle with incomplete attribution and unreliable ROI calculations, you'll be making optimization decisions based on complete customer journey data tied directly to revenue outcomes. You'll scale winning campaigns faster, cut losing campaigns earlier, and consistently prove the value of every marketing dollar spent.
Ready to elevate your marketing game with precision and confidence? Discover how Cometly's AI-driven recommendations can transform your ad strategy. Get your free demo today and start capturing every touchpoint to maximize your conversions.


