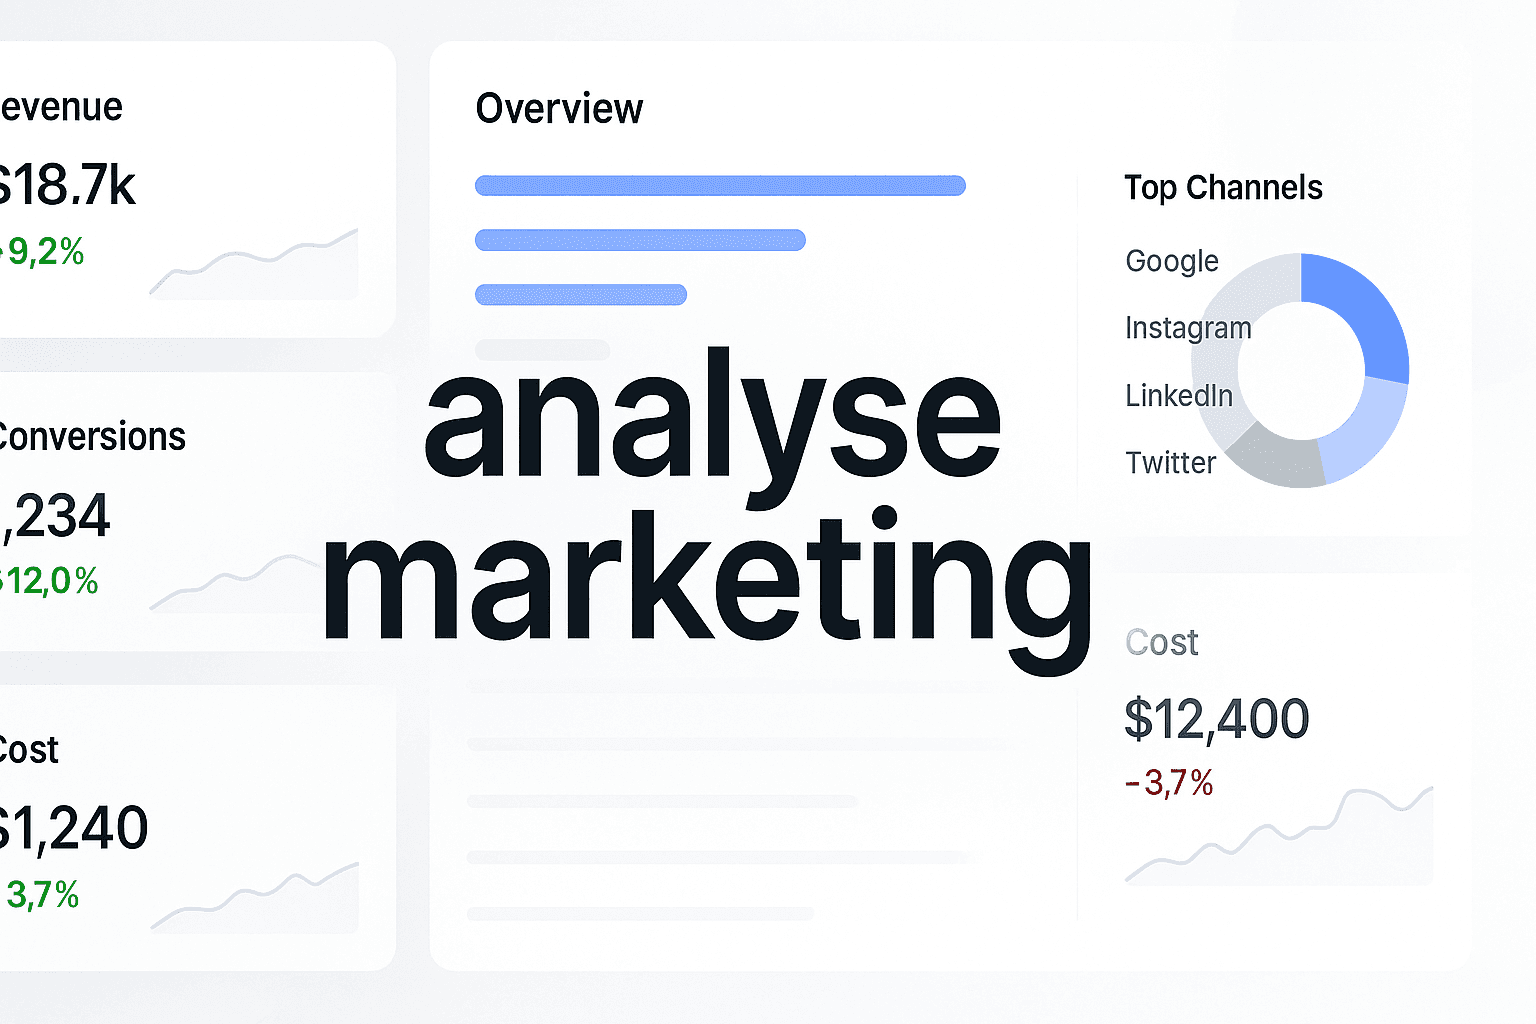
You're staring at three different dashboards, and they're all telling you completely different stories about the same campaign.
Google Ads says you got 47 conversions. Facebook claims 62. Your CRM shows 38 new customers. And Google Analytics? It's showing a number that doesn't match any of them.
Which one is right? More importantly—which campaigns should you scale, and which should you kill?
This isn't just frustrating. It's expensive. Every day you spend second-guessing your data is a day your competitors are optimizing faster, spending smarter, and pulling ahead. The modern marketing landscape has created a paradox: we have more data than ever before, yet making confident decisions feels harder than it used to be.
The problem isn't the data itself. It's that most marketers are drowning in metrics without a systematic way to analyse marketing performance and extract the insights that actually drive growth. Platform attribution conflicts, privacy changes, and increasingly complex customer journeys have turned what should be straightforward analysis into a maze of contradictory numbers.
But here's what changes everything: the marketers who master proper analysis aren't just making better decisions—they're making them faster. While others are paralyzed by conflicting data, they're confidently reallocating budgets, scaling winners, and cutting losers before the competition even realizes what's working.
This guide will show you exactly how to analyse marketing like a professional growth team, not just a data collector. You'll learn the difference between reporting and actual analysis, discover which metrics truly drive business decisions, and master a framework that works whether you're running a small business or managing millions in ad spend across multiple platforms.
By the end, you'll know how to cut through attribution confusion, identify which campaigns genuinely drive revenue, and build a repeatable system for turning data chaos into confident optimization decisions. No more guessing. No more conflicting dashboards. Just clear insights that tell you exactly where to invest your next dollar.
Let's transform how you approach marketing analysis.
Decoding Marketing Analysis Beyond Surface Metrics
Most marketers think they're analyzing their campaigns when they're really just reporting numbers.
There's a massive difference. Reporting tells you that traffic increased 20% last month. Analysis tells you that organic traffic increased 20% because your new content strategy targeting bottom-funnel keywords is working, which means you should double down on content investment and expand to related search terms.
See the difference? One gives you a number. The other gives you a decision.
This distinction separates marketers who react to data from those who use it to drive growth. When you analyse marketing performance properly, every metric becomes a recommendation, every trend becomes a strategy, and every report becomes an action plan.
The Reporting vs. Analysis Divide
Reporting answers "what happened." Analysis answers "why it happened" and "what should we do next."
When your Google Ads dashboard shows a 15% increase in conversions, that's reporting. When you dig deeper and discover that the increase came entirely from mobile users in three specific geographic regions responding to your new ad creative, and you immediately reallocate budget to scale those winning combinations—that's analysis.
The trap most marketers fall into is spending 90% of their time collecting and formatting data, and only 10% actually thinking about what it means. Professional marketing analysis flips that ratio. The ability to evaluate marketing channels systematically transforms raw performance data into strategic budget allocation decisions that drive measurable growth.
Here's a simple test: Look at your last marketing report. For every metric you included, can you write down one specific action someone should take based on that number? If not, you're reporting, not analyzing.
The Three Pillars of Strategic Marketing Analysis
Effective analysis isn't about having more data—it's about having the right framework to extract insights from the data you already have.
Performance Measurement: This is your foundation—understanding what's working right now across all your campaigns and channels. But it goes beyond surface metrics like clicks and impressions. Real performance measurement tracks how each marketing touchpoint contributes to actual business outcomes like revenue, customer lifetime value, and profit margins.
Attribution Modeling: This is where most marketers get stuck. Your Facebook Ads Manager might claim 50 conversions, but how many of those customers actually started their journey with an organic search, engaged with your email campaign, and only converted after seeing your retargeting ad? Attribution modeling reveals what's actually driving results, not just what gets credit based on last-click assumptions.
Predictive Insights: The most valuable analysis doesn't just explain the past—it predicts the future. When you spot patterns in your data, you can forecast which campaigns will scale profitably, which channels are showing early warning signs of decline, and where to invest your next dollar for maximum return.
These three pillars work together. Performance measurement shows you current results. Attribution modeling explains why you're getting those results. Predictive insights tell you what to do next.
Think of it like this: A doctor doesn't just tell you your temperature (reporting). They diagnose why you have a fever (analysis), predict how it will progress, and prescribe treatment. That's exactly how professional marketing agencies approach campaign optimization—moving beyond surface-level metrics to actionable strategic recommendations.
Why Accurate Marketing Analysis Drives Competitive Advantage
The marketing landscape shifted fundamentally when iOS 14.5 rolled out in 2021. Overnight, Facebook's ability to track conversions dropped by 15-30% for many advertisers. Google followed suit with cookie deprecation plans. Privacy regulations tightened globally.
But here's what most marketers missed: these changes didn't just reduce data accuracy—they created a massive competitive divide between marketers who adapted their analysis methods and those who kept relying on surface-level platform metrics.
The iOS Update Reality Check
When Apple introduced App Tracking Transparency, it didn't just affect Facebook ads. It fundamentally changed how marketing analysis works across every platform.
The immediate impact was obvious: conversion tracking became less reliable. Attribution windows shortened. Cross-device tracking essentially disappeared for iOS users. But the deeper consequence was more significant—platform-reported metrics became increasingly misleading indicators of actual campaign performance.
Consider what this means in practice. Your Facebook Ads Manager might show a campaign breaking even at 1.5x ROAS. But if that campaign is actually driving view-through conversions, influencing organic searches, or starting customer journeys that convert days later on different devices, you're looking at incomplete data. The campaign might actually be delivering 3x ROAS when properly analyzed.
Marketers who recognized this adapted their analysis approach. They implemented first-party tracking, built unified attribution systems, and stopped making decisions based solely on what ad platforms reported. Understanding B2B marketing attribution becomes essential when complex buyer journeys span multiple stakeholders, touchpoints, and weeks of consideration time across different devices and platforms.
The Multi-Touch Attribution Challenge
Modern customer journeys have become impossibly complex. B2B buyers now consume an average of 13 pieces of content before making a purchase decision. For e-commerce, 92% of first-time visitors don't convert immediately—they research, compare, abandon carts, and return through different channels.
Last-click attribution completely misses this reality. It gives 100% credit to whatever touchpoint happened right before the conversion, ignoring the awareness campaign that introduced your brand, the retargeting ad that brought them back, and the email that finally convinced them to buy.
This creates a dangerous blind spot. Your top-of-funnel campaigns—the ones building awareness and starting customer journeys—look like they're underperforming because they rarely get last-click credit. Meanwhile, your bottom-funnel retargeting campaigns look incredibly efficient because they're capturing conversions that other campaigns actually created.
The result? Marketers systematically underfund the campaigns that drive new customer acquisition and overfund the campaigns that simply capture existing demand. Understanding marketing attribution for e-commerce becomes critical when browse-abandon-return patterns span multiple devices and weeks of consideration time.
The Competitive Advantage of Deep Analysis
Here's the uncomfortable truth: while most marketers are still arguing about which dashboard shows the "right" numbers, the best performers have moved past that debate entirely.
They've built analysis systems that reconcile data across platforms, track customer journeys from first touch to final conversion, and attribute value accurately across every touchpoint. More importantly, they've automated most of this process so they can spend their time on strategy instead of data collection.
This creates a compounding advantage. Every week, they're making slightly better decisions than their competitors. They're scaling winners faster, cutting losers sooner, and reallocating budget more efficiently. Over months and years, these small improvements compound into massive performance gaps.
The marketers who master proper analysis aren't just winning—they're pulling so far ahead that competitors can't catch up without fundamentally changing how they approach data. That's the real competitive advantage: not having better data, but having better systems to analyse marketing performance and turn insights into action faster than anyone else.
Essential Metrics That Actually Drive Marketing Decisions
Most marketing dashboards are cluttered with metrics that look impressive but tell you nothing about what to do next. Impressions, reach, engagement rate—these vanity metrics make great presentation slides but terrible decision-making tools.
The metrics that actually matter are the ones that directly connect to business outcomes and tell you where to invest your next dollar. Here's what professional growth teams track when they analyse marketing performance.
Customer Acquisition Cost (CAC) by Channel
This is your north star metric. CAC tells you exactly how much you're paying to acquire each new customer through each marketing channel.
But here's the critical distinction: you need CAC by channel, not just overall CAC. Your Facebook campaigns might have a $50 CAC while your Google Ads sit at $120. Without this breakdown, you'd never know which channel deserves more budget.
The real power comes from tracking CAC trends over time. If your Facebook CAC was $50 three months ago and it's $75 today, that's a clear signal that your audience is saturating, your creative is fatiguing, or competition is increasing. Implementing GA4 marketing attribution helps connect cross-platform customer journeys to accurate acquisition cost calculations across your entire marketing ecosystem.
Smart marketers don't just track CAC—they set CAC targets for each channel based on customer lifetime value, then optimize relentlessly to hit those targets. When CAC exceeds your target, you know exactly which campaigns to pause or optimize.
Return on Ad Spend (ROAS) with Attribution Context
ROAS seems straightforward: revenue divided by ad spend. But platform-reported ROAS is almost always wrong because it ignores multi-touch attribution.
Your Facebook Ads Manager might show 2.5x ROAS on a campaign. But if that campaign is primarily driving awareness and consideration, with conversions happening later through other channels, the true ROAS could be 4x or higher. Conversely, your "high-performing" retargeting campaign showing 8x ROAS might actually be stealing credit from other touchpoints.
The solution is attribution-adjusted ROAS. This metric distributes revenue credit across all touchpoints in the customer journey, giving you a realistic picture of each campaign's true contribution. For complex sales cycles, account based marketing attribution tracks how multiple stakeholders and touchpoints contribute to enterprise deals across extended timeframes.
When you analyse marketing with proper attribution, you stop making the classic mistake of killing profitable awareness campaigns and over-investing in last-click converters that aren't actually creating new demand.
Customer Lifetime Value (LTV) by Acquisition Source
Not all customers are created equal. The customer you acquired through a Facebook ad might spend $500 over their lifetime, while the customer from organic search spends $2,000.
LTV by acquisition source reveals which channels bring you the most valuable customers, not just the most customers. This completely changes how you think about CAC. A $100 CAC looks expensive until you realize those customers have a $1,500 LTV, while your $30 CAC channel brings customers with only $200 LTV.
The most sophisticated marketers segment LTV even further—by campaign, ad creative, audience, and landing page. They discover that customers who engage with educational content before converting have 3x higher LTV than those who convert immediately. Or that mobile users have lower initial purchase values but higher repeat purchase rates.
This level of analysis transforms budget allocation. Instead of optimizing for lowest CAC, you optimize for highest LTV:CAC ratio. That's how you scale profitably while competitors are stuck chasing vanity metrics.
Conversion Rate by Funnel Stage
Your overall conversion rate means nothing if you don't know where people are dropping off in your funnel.
Breaking conversion rates down by funnel stage reveals exactly where to focus optimization efforts. Maybe your landing page converts visitors to leads at 8%, but only 2% of leads become customers. That's a clear signal that your lead nurturing needs work, not your traffic generation.
The best analysis goes deeper: conversion rates by traffic source, device type, audience segment, and time of day. You might discover that mobile traffic converts at half the rate of desktop, suggesting you need mobile-specific landing pages. Or that traffic from LinkedIn converts 3x better than Facebook, indicating where to shift budget.
When you track conversion rates at every funnel stage, you stop guessing about what's broken and start making data-driven optimization decisions that actually move the needle on revenue.
Building a Repeatable Marketing Analysis Framework
The difference between marketers who consistently outperform and those who struggle isn't access to better data—it's having a systematic framework for turning data into decisions.
Most marketing teams approach analysis reactively. They look at dashboards when something seems wrong, scramble to figure out what happened, and make changes based on incomplete information. Then they repeat this chaotic process every time performance shifts.
Professional growth teams do the opposite. They build repeatable frameworks that automatically surface insights, prioritize opportunities, and recommend actions. Here's how to build yours.
The Weekly Analysis Ritual
Consistency beats intensity in marketing analysis. A weekly analysis ritual ensures you catch problems early and capitalize on opportunities before they disappear.
Your weekly ritual should answer three questions: What changed? Why did it change? What should we do about it?
Start by comparing this week's performance to last week and the same week last year. Look for significant changes in your core metrics: CAC, ROAS, conversion rates, and revenue by channel. Don't just note that conversions increased 15%—dig into which campaigns, audiences, and creatives drove that increase.
Next, investigate the "why" behind any significant changes. Did a campaign budget increase drive better results? Did a new ad creative outperform existing ones? Did external factors like seasonality or competitor activity impact performance? Understanding what is mobile marketing attribution helps explain performance shifts when mobile traffic patterns change or app-based conversions fluctuate across different platforms and devices.
Finally, document specific actions based on your findings. "Increase budget on Campaign X by 30%" is actionable. "Performance looks good" is not. Your weekly analysis should always end with a prioritized list of optimizations to implement.
The Monthly Deep Dive
Weekly analysis catches tactical opportunities. Monthly deep dives reveal strategic shifts that require bigger changes.
Your monthly analysis should zoom out to identify trends that aren't visible in weekly data. Are your acquisition costs trending up across all channels? Is customer lifetime value declining for recent cohorts? Are certain audience segments becoming more or less profitable over time?
This is where you question fundamental assumptions. Maybe the channel you've always relied on is becoming saturated. Maybe a "low-performing" channel is actually driving high-LTV customers. Maybe your attribution model is systematically undervaluing certain touchpoints.
The monthly deep dive is also when you test new hypotheses. If you noticed that mobile traffic has lower conversion rates but higher LTV, this is when you design tests to optimize the mobile experience. If certain content types drive better engagement, this is when you plan content strategy shifts.
Real-world examples prove the value of systematic analysis. Rise Up Marketing builds client trust and cuts optimization time with Cometly AI by implementing repeatable frameworks that surface insights faster and enable data-driven decisions across multiple client accounts simultaneously.
The Quarterly Strategy Review
Quarterly reviews are where analysis becomes strategy. This is when you step back from tactical optimizations and evaluate whether your entire marketing approach is working.
Start by reviewing your original goals and assumptions. Did you hit your targets? If not, was it because your tactics failed or because your assumptions were wrong? Maybe you assumed Facebook would be your primary growth channel, but Google is actually delivering better results.
Next, evaluate your channel mix. Are you over-invested in channels with declining returns? Are you under-invested in channels with room to scale? Should you test entirely new channels based on where your best customers are spending time?
Finally, update your forecasts and budgets based on what you've learned. If your CAC has increased 20% over the quarter, your growth projections need to reflect that reality. If you've discovered a new channel that's scaling profitably, your budget allocation should shift accordingly.
The quarterly review is where you make the big bets that define your marketing strategy for the next three months. Get this right, and your weekly and monthly analysis becomes dramatically more effective because you're optimizing within a sound strategic framework.
Common Marketing Analysis Mistakes That Cost You Money
Even experienced marketers make analysis mistakes that quietly drain thousands from their budgets. These errors aren't obvious—they're subtle misinterpretations that lead to confidently wrong decisions.
Understanding these mistakes helps you avoid them and build more reliable analysis systems.
Mistaking Correlation for Causation
You notice that conversions always spike on Thursdays. So you increase your ad spend on Thursdays, expecting better results. Instead, performance stays flat and you've wasted budget.
What happened? You confused correlation with causation. Conversions might spike on Thursdays because that's when your weekly email goes out, not because Thursday itself is special. Or maybe your B2B customers make purchasing decisions at the end of their work week, regardless of your ad spend.
This mistake shows up everywhere in marketing analysis. Traffic and conversions both increased after you redesigned your website—but maybe conversions increased because you also launched a new campaign that week. Your Facebook ROAS improved after you raised prices—but maybe it improved because you simultaneously improved your targeting.
The solution is controlled testing. When you want to know if something causes better results, change only that one variable and measure the impact. Otherwise, you're just guessing about what's actually driving performance.
Ignoring Statistical Significance
You run an A/B test for three days. Variant B has a 3.2% conversion rate versus Variant A's 3.0%. You declare B the winner and roll it out to all traffic.
Two weeks later, performance is worse than before. What went wrong?
Your test didn't reach statistical significance. That 0.2 percentage point difference could easily be random noise, not a real improvement. You needed more data—more time, more traffic, or both—before making a decision.
This mistake costs marketers enormous amounts of money. They make changes based on insufficient data, then make more changes when those don't work, creating a cycle of constant optimization that never actually improves anything.
The fix is simple: use a statistical significance calculator before declaring any test a winner. Most A/B testing tools include this functionality. If your test hasn't reached 95% confidence, keep running it or acknowledge that you're making a judgment call, not a data-driven decision.
Optimizing for the Wrong Metrics
Your boss wants to see more leads, so you optimize your campaigns for lead volume. Leads increase 40%. Everyone celebrates.
Three months later, revenue is down. Sales is complaining about lead quality. What happened?
You optimized for the wrong metric. Lead volume increased, but lead quality tanked. You attracted more people who would never buy, diluting your sales team's time and actually hurting revenue.
This is one of the most expensive mistakes in marketing analysis. Optimizing for clicks instead of conversions. Optimizing for conversions instead of profitable conversions. Optimizing for new customers instead of customer lifetime value.
The solution is always connecting your metrics to business outcomes. Don't optimize for leads—optimize for qualified leads that convert to customers. Don't optimize for conversions—optimize for conversions with positive ROI. Don't optimize for customer acquisition—optimize for acquiring customers with strong LTV:CAC ratios.
Overlooking Segment-Level Performance
Your overall ROAS is 3.5x, so you're happy with campaign performance. But when you segment by device, you discover that desktop delivers 6x ROAS while mobile is at 1.2x ROAS.
You've been wasting half your budget on mobile traffic that barely breaks even, but you didn't know because you only looked at aggregate metrics.
This mistake hides everywhere in marketing data. Overall performance looks fine, but specific segments are dramatically underperforming. Maybe one audience segment has terrible LTV. Maybe one geographic region has sky-high CAC. Maybe one landing page converts at half the rate of others.
The fix is systematic segmentation. Every time you analyse marketing performance, break it down by channel, campaign, audience, device, geography, and any other relevant dimension. The insights hiding in segment-level data are often worth more than anything you'll find in aggregate metrics.
Advanced Analysis Techniques for Scaling Profitably
Once you've mastered the fundamentals of marketing analysis, these advanced techniques help you scale faster while maintaining or improving profitability.
Cohort Analysis for Predicting Long-Term Value
Standard analysis tells you how customers behave on average. Cohort analysis tells you how specific groups of customers behave over time—and that's far more valuable for making scaling decisions.
A cohort is a group of customers acquired during the same time period or through the same channel. By tracking cohorts separately, you can see if customer quality is improving or declining as you scale.
For example, you might discover that customers acquired in Q1 have 30% higher LTV than customers acquired in Q4. This tells you something important changed—maybe your targeting, your messaging, or the quality of traffic from your channels. Now you can investigate what made Q1 customers more valuable and replicate it.
Cohort analysis also reveals retention patterns that aggregate metrics hide. Maybe your overall retention rate looks stable, but recent cohorts are churning faster than older ones. That's an early warning sign that something in your acquisition or onboarding process has broken.
Incrementality Testing to Measure True Impact
Your retargeting campaigns show amazing ROAS. But here's the uncomfortable question: how many of those conversions would have happened anyway, even without the retargeting ads?
Incrementality testing answers this question by measuring the true incremental impact of your marketing, not just the conversions that happened to have a touchpoint.
The basic approach is simple: create a holdout group that doesn't see your ads, then compare their conversion rate to the group that does see your ads. The difference is your true incremental impact.
This often reveals uncomfortable truths. That retargeting campaign with 8x ROAS might only be driving 20% incremental conversions—the other 80% would have converted anyway. Your brand search campaigns might be capturing demand that already exists rather than creating new demand.
Incrementality testing helps you separate marketing that drives growth from marketing that just takes credit for growth that would have happened regardless. This distinction is critical for scaling profitably.
Predictive Modeling for Budget Allocation
Most marketers allocate budget based on past performance. Advanced marketers use predictive modeling to allocate budget based on expected future performance.
Predictive models use historical data to forecast how campaigns will perform at different budget levels. They account for factors like audience saturation, creative fatigue, competitive dynamics, and seasonality.
This lets you answer questions like: "If I increase this campaign's budget by 50%, what ROAS can I expect?" or "At what budget level will this channel become unprofitable?"
The most sophisticated models also incorporate external data—economic indicators, competitor activity, search trends—to predict how market conditions will impact your performance. This helps you scale aggressively when conditions are favorable and pull back before market shifts hurt your profitability.
Building these models requires statistical expertise, but even simple predictive approaches—like tracking how performance changes at different budget levels—can dramatically improve your scaling decisions.
Turning Analysis Into Action: The Optimization Workflow
Analysis without action is just expensive reporting. The real value comes from building a systematic workflow that turns insights into optimizations that drive measurable results.
The Insight-to-Action Pipeline
Every insight from your analysis should flow through a standardized pipeline: identify, prioritize, test, measure, scale.
Identify: Your analysis surfaces an opportunity or problem. Maybe a specific audience segment has 2x higher LTV than others. Maybe mobile conversion rates are declining. Maybe a new ad creative is outperforming existing ones.
Prioritize: Not every insight deserves immediate action. Prioritize based on potential impact and ease of implementation. A 5% improvement that takes an hour to implement beats a 10% improvement that takes a month.
Test: Before making major changes, test your hypothesis. If you think a new landing page will improve conversions, split test it against your current page. If you think a different audience will perform better, test it with a small budget first.
Measure: Track the results of your optimization with clear success metrics. Don't just implement changes and hope they work—measure whether they actually improved the metrics you care about.
Scale: When a test proves successful, scale it aggressively. If a new audience delivers 50% better ROAS, shift budget immediately. If a landing page variant improves conversions by 20%, roll it out to all traffic.
This pipeline ensures that your analysis actually drives business results rather than just generating interesting observations that never get implemented.
Building a Testing Calendar
Random, reactive testing rarely produces breakthrough results. Systematic, planned testing consistently does.
A testing calendar plans your optimization efforts weeks or months in advance. It ensures you're always testing something, that tests don't conflict with each other, and that you're systematically working through your highest-priority opportunities.
Your testing calendar should include what you're testing, why you're testing it, what success looks like, and when you'll make a decision. This prevents tests from running indefinitely without conclusions and ensures you're learning continuously.
The best testing calendars also include "learning sprints"—focused periods where you test multiple variations of the same element to quickly identify what works. Maybe you spend two weeks testing five different ad headlines, then another two weeks testing five different images, then combine the winners for maximum impact.
Creating Feedback Loops
The most powerful optimization workflows include feedback loops that make your analysis smarter over time.
Every test you run generates data about what works and what doesn't. Feed that data back into your analysis framework so future insights are informed by past learnings. If you discover that educational content drives higher LTV customers, your future analysis should segment by content type to find similar patterns.
Feedback loops also help you avoid repeating mistakes. If a test failed, document why so you don't waste time testing the same hypothesis again. If a channel stopped scaling profitably at a certain budget level, remember that threshold when planning future budget increases.
Over time, these feedback loops compound into a massive competitive advantage. Your analysis gets smarter, your tests get more targeted, and your optimization velocity increases dramatically.
The Future of Marketing Analysis: AI and Automation
Marketing analysis is being transformed by AI and automation. The marketers who adapt to these changes will scale faster and more profitably than those who don't.
Automated Insight Generation
The traditional approach to marketing analysis requires humans to manually dig through data looking for patterns. AI flips this model—it automatically surfaces insights and anomalies that deserve attention.
Modern analysis platforms use machine learning to identify significant changes in your data, predict which campaigns will scale profitably, and recommend specific optimizations. Instead of spending hours looking for insights, you spend minutes reviewing AI-generated recommendations and deciding which to implement.
This doesn't replace human judgment—it amplifies it. AI handles the tedious work of scanning data for patterns, freeing you to focus on strategic decisions and creative problem-solving.
Predictive Budget Optimization
AI-powered platforms can now predict how campaigns will perform at different budget levels and automatically adjust spending to maximize your objectives.
These systems learn from your historical data to understand how each campaign responds to budget changes, then continuously optimize allocation across all your campaigns. When a campaign starts showing diminishing returns, budget automatically shifts to higher-performing opportunities.
The result is better performance with less manual work. Instead of constantly monitoring campaigns and adjusting budgets, you set your objectives and let AI handle the tactical optimization while you focus on strategy.
Real-Time Attribution and Analysis
Traditional attribution analysis happens in hindsight—you analyze last week's or last month's data to understand what worked. AI enables real-time attribution that updates continuously as new data arrives.
This means you can see the true impact of your marketing as it happens, not days or weeks later. When a campaign starts underperforming, you know immediately. When a new audience segment shows promise, you can scale it before the opportunity disappears.
Real-time analysis compresses the optimization cycle from weeks to hours. You test, learn, and optimize faster than competitors who are still waiting for monthly reports to understand what's working.
The future of marketing analysis isn't about having more data—it's about having smarter systems that turn data into action faster than ever before. The marketers who embrace these tools will dominate their markets while others are still trying to figure out what happened last month.
Ready to elevate your marketing game with precision and confidence? Discover how Cometly's AI-driven recommendations can transform your ad strategy—**Get your free demo** today and start capturing every touchpoint to maximize your conversions.