
In today’s data-driven marketing landscape, guessing is no longer a viable strategy. If you're not measuring what converts, you're wasting time and money. That’s where conversion analytics comes in.
Conversion analytics gives you the clarity to understand what’s working across your marketing funnel—from the first ad click to the final sale. It goes beyond surface-level metrics to uncover the actions, touchpoints, and behaviors that truly drive revenue.
In this guide, we’ll walk you through everything you need to know about conversion analytics: what it is, why it matters, how to implement it, and which tools can take your tracking to the next level.
What Is Conversion Analytics?
Conversion analytics is the process of tracking and analyzing user behaviors that lead to a desired action—typically referred to as a conversion. That action might be filling out a demo request, signing up for a trial, making a purchase, or completing a form.
But here’s the key: conversion analytics isn’t just about counting conversions. It’s about understanding the who, how, and why behind them.
With the right setup, you can track:
- Which ads, channels, or campaigns led to the conversion
- The steps users took before converting
- Where drop-offs happen in the funnel
- The lifetime value and ROI of each conversion
To learn how this ties into revenue, check out our full ROI tracking article.
Why Conversion Analytics Is a Game-Changer
Most marketing teams focus on clicks, impressions, and traffic. But none of that matters if users aren’t converting. That’s why shifting your focus to conversions unlocks a new level of optimization.
Here’s what powerful conversion analytics can do for your business:
1. Reveal True Campaign Performance
Traffic doesn’t pay the bills—conversions do.
That’s why conversion analytics is the ultimate filter between noise and signal. You might be running campaigns that look successful at first glance—high click-through rates, decent engagement metrics, solid impressions—but those surface-level KPIs rarely tell the full story. Conversion analytics bridges that gap, helping you uncover which campaigns, creatives, and audience segments are actually responsible for pipeline and revenue.
Let’s break down how to truly measure campaign performance and where to find optimization opportunities.
Go Beyond Vanity Metrics
It’s easy to fall in love with CTRs, impressions, or even video watch times. But if those actions aren’t driving demos, sign-ups, or purchases, then you’re just burning budget. Conversion analytics allows you to go deeper—tracking not just whether someone clicked, but whether they converted, how much revenue they generated, and what other touchpoints influenced their decision.
To uncover more accurate signals across ad platforms, make sure your analytics are synced to first-party data, CRM events, and offline conversions. If you're still relying on platform-reported conversions alone, you're missing the full picture. Learn why modern teams are ditching GA4 and exploring Google Analytics alternatives like Cometly that prioritize attribution and pipeline impact.
Understand the Real Attribution Path
One of the biggest performance killers in marketing is last-click bias. If you're only giving credit to the last campaign or ad a user interacted with, you’re likely undervaluing your top-of-funnel and mid-funnel efforts. With multi-touch attribution, you can distribute credit across the full buyer journey and identify which channels consistently assist in conversions—even if they don’t close the deal directly.
This is especially useful for retargeting and remarketing strategies. That top-of-funnel Facebook video ad may not drive direct conversions, but it could be instrumental in pushing cold audiences into your funnel.
Dive deeper into attribution measurement to start analyzing each touchpoint’s contribution to revenue.
Segment Campaigns by Performance Traits
Once you have conversion data flowing, the real power comes from segmentation. You can segment by:
- Device (Are mobile visitors converting at the same rate as desktop?)
- Time of day (Do conversions spike on weekdays? Evenings?)
- Audience (Which lookalike segments or interest groups are converting?)
- Creative type (Are image ads outperforming videos?)
- Landing page experience (Which variant actually leads to more revenue?)
These insights allow you to make surgical adjustments rather than broad guesses. A great example of this strategy in action can be found in our article on 30 tips to improve ad performance—many of which are only possible with proper analytics in place.
Use the Right Reporting Stack
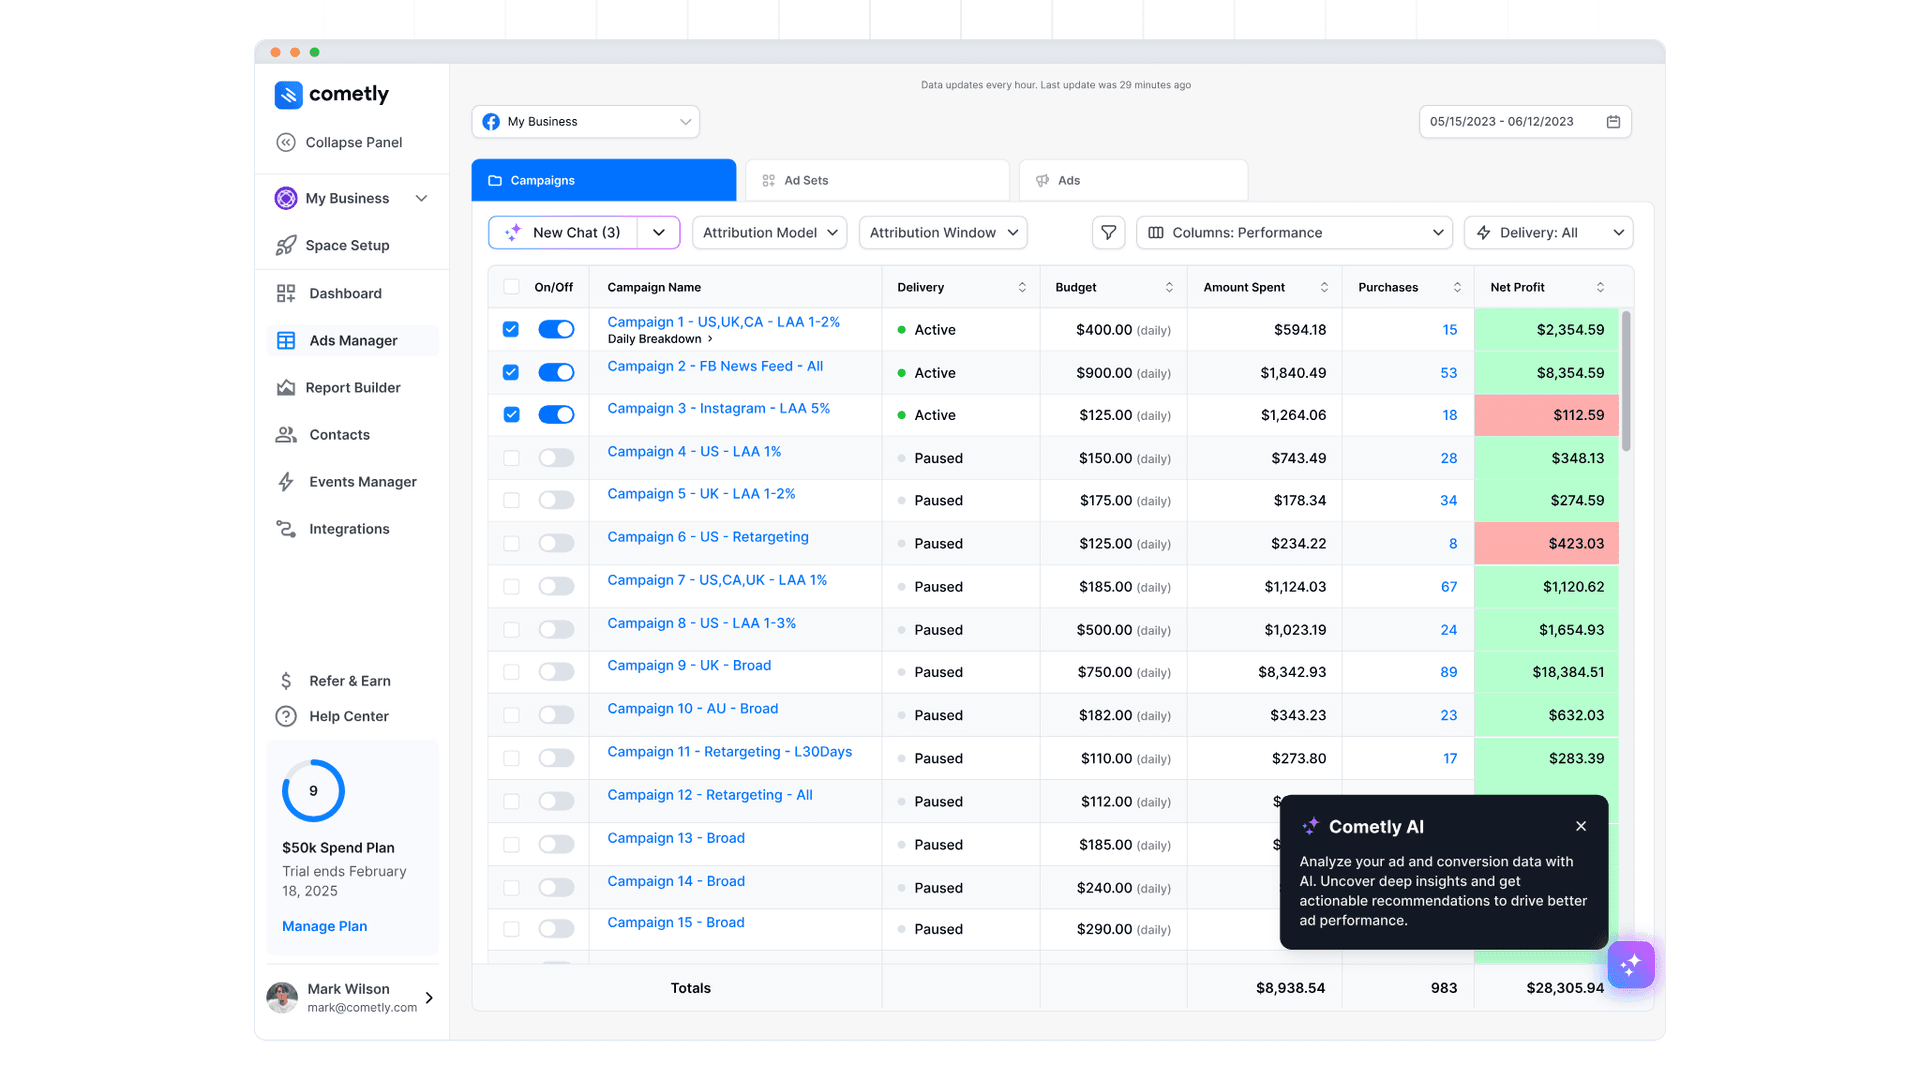
Let’s be honest—native ad platform reports aren’t designed for marketers who need a full-funnel view. That’s why tools like Cometly Ads Manager are critical. They let you see campaign performance from ad view to closed deal, not just click to website visit.
Pair it with a robust PPC reporting tool to pull in multi-channel data and automatically tie spend to revenue. This unlocks next-level insights like cost per SQL, ROAS by funnel stage, and campaign-level contribution to pipeline.
Want an example of a clean dashboard setup? Our article on marketing analytics dashboards walks through how top teams visualize campaign data.
Spot Underperformers Early
With conversion analytics in place, you don’t need to wait until the end of the month to evaluate a campaign. You can catch underperforming campaigns early and make decisions in real-time. Is a specific ad creative leading to high bounce rates? Does one landing page variant have a lower-than-average form fill rate? These insights empower you to run agile tests and iterate quickly.
Additionally, you can analyze campaign performance through different attribution lenses. For example, a campaign might look weak under last-click attribution but strong when viewed through a U-shaped attribution model, which gives weight to both the first and final touches.
Looking to build experiments around this? Explore A/B testing strategies and conversion funnel analysis.
Optimize Based on Revenue, Not Just Leads
One of the biggest mistakes performance marketers make is optimizing for the cheapest leads rather than the most valuable ones. With conversion analytics, you can align your marketing metrics with real business outcomes.
Use insights from revenue attribution models to break down which campaigns generate not only leads but qualified opportunities and closed-won deals.
If you’re a B2B SaaS company or run long sales cycles, consider integrating your conversion data with pipeline stages. This way, you’re not just measuring “MQLs,” you’re tracking true sales momentum.
Activate Lesser-Used Data for Smarter Campaigns
Don’t overlook lesser-used metrics that can be unlocked with a good analytics setup. For example:
- View-through conversions: Learn which display or video ads are contributing to conversions through impressions, not clicks. (view-through conversions guide)
- Pipeline attribution: Understand which campaigns contribute to pipeline velocity and size, even if they’re not closing deals directly. (pipeline attribution article)
- Customer journey analytics: Evaluate how long it takes a campaign to influence the journey across stages like awareness, evaluation, and purchase. (customer journey software)
2. Improve Lead Quality
Generating leads is easy. Generating high-quality leads? That’s the real challenge.
The traditional approach to lead generation often focuses on quantity over quality. But the best marketing teams know that 1,000 leads that never convert are worth less than 10 that actually become customers. That’s where conversion analytics comes into play.
Instead of optimizing your campaigns for surface-level form fills, conversion analytics gives you the ability to understand which leads are actually moving through your funnel—and which ones stall out immediately.
Move Beyond the MQL Trap
Many teams rely on outdated MQL definitions: a form fill, a whitepaper download, or an ad click. But none of those interactions tell you whether the lead is truly ready to buy. With conversion analytics, you can map post-lead behavior—tracking how users engage with your brand after their initial interaction.
Did they book a meeting? Attend a demo? Did they engage with product pages, pricing content, or your AI chat feature?
This context is critical for understanding intent and scoring leads more intelligently. You’ll know whether your campaigns are generating buyers—or just noise.
Attribute Lead Quality to the Right Sources
With tools like Cometly’s lead tracking, you can go far beyond basic attribution. You can see exactly which channels, campaigns, and even specific ads brought in your most valuable leads.
Maybe your YouTube ads are driving tons of leads, but they never convert. Meanwhile, your Google Search campaign with a lower volume produces high-LTV customers. Without proper analytics, it’s easy to misallocate budget to the wrong channel.
Use PPC reporting software to break down lead quality by source and make data-backed decisions.
You’ll also uncover hidden gems: organic blog content, referrals, or even partner campaigns that quietly bring in your highest-converting leads.
Understand Lead Behavior Post-Conversion
Not all leads are created equal—and conversion analytics helps you see why. You can track:
- How long it takes a lead to schedule a call
- Which content they consume before and after conversion
- What touchpoints (ads, emails, webinars) drive them deeper into the funnel
- Where they stall or drop off
This data helps you build better nurture flows, optimize CTAs, and prioritize outreach by your sales team. Want to design better flows? Check out our piece on conversion funnel analytics.
You can also combine this insight with server-side tracking to ensure complete visibility—even if ad blockers or browser issues would typically obscure the journey.
Align Sales and Marketing Around Lead Quality
One of the biggest disconnects in most organizations is the sales vs. marketing lead debate. Marketing says, “We’re sending tons of leads!” Sales says, “These leads are garbage.”
Conversion analytics ends the argument. With data that ties specific lead sources to closed-won deals, you can build a common truth that both teams can align around.
Use conversion data to:
- Score leads based on historical behavior
- Prioritize high-intent prospects in your CRM
- Trigger alerts when leads hit milestones like watching a demo or returning to the site
- Collaborate with sales on campaign optimization
Want more alignment between marketing and sales? Learn how to use pipeline attribution to track how leads impact the bottom line.
Improve Lead Capture Strategies
Lead quality isn’t just about where the lead came from—it’s also about how you captured them.
Are your forms asking the right qualifying questions? Is your chatbot capturing key buying signals? Is your lead magnet aligned with your offer?
Conversion analytics helps you test and refine every point of lead capture. For example, if leads from a pricing page form consistently convert better than those from an ebook download, you know where to focus your efforts.
You can also experiment with different funnel paths, lead gen content, and ad creatives—and track how each one impacts lead quality.
Customize Messaging Based on Behavior
Using analytics, you can segment leads based on how they interacted with your site and tailor your messaging accordingly. For instance:
- Someone who visited your ROI tracking page may be ready for a value-based case study.
- A lead who came from campaign analytics content might be more interested in tactical advice.
- A visitor that engaged with PPC reporting might respond well to comparisons between ad channels.
Personalizing nurture campaigns based on conversion paths improves both engagement and downstream conversion rates.
Measure the Right KPIs for Lead Quality
Don’t just focus on CPL (Cost Per Lead). With conversion analytics, you can track:
- Cost Per Qualified Lead (CPQL)
- Cost Per SQL (Sales Qualified Lead)
- Revenue Per Lead Source
- Lead-to-Customer Conversion Rate
This deeper level of insight allows you to justify budget increases for high-performing campaigns—even if they have a higher CPL—because they result in more revenue.
See How Long-Term Customers Were Acquired
Want to reduce churn or find more customers like your best ones?
Conversion analytics lets you reverse-engineer customer journeys. You can look back at how your top-paying or longest-retaining customers entered your funnel. Was it a webinar, a retargeting campaign, or a referral program?
Use that insight to double down on acquisition strategies that produce not just more leads—but more right-fit leads.
We cover this further in our customer journey software article, which breaks down how to view full-funnel behavior over time.
3. Reduce Cost Per Acquisition (CPA)
Knowing which sources are converting allows you to cut spend on what’s underperforming. This drives your CPA down and increases marketing efficiency.
The biggest benefit here is resource allocation. Let’s say you have four paid channels, but only two consistently deliver converting traffic. With conversion analytics, you can reallocate budget to the top performers and pause or test new strategies on the weaker ones.
You can also analyze the entire conversion funnel to see where drop-offs are increasing CPA. For instance, if users click your ads but bounce on your landing page, that’s a red flag for content relevance or UX design. Fixing those micro-barriers reduces friction and improves your cost efficiency.
Advanced tools can even help you segment CPA by funnel stage, device, or demographic. You may find mobile users have a significantly higher CPA due to a poor mobile experience, or that certain demographics convert faster when shown specific messaging.
Want to connect the dots between channel performance and cost efficiency? Explore how marketing analytics software can help you dig deeper into your spend-to-conversion ratios.
You can even use conversion analytics to determine the ideal blend of paid and organic efforts. Often, improving landing page copy, testing new offers, or adjusting CTA placement can drive big CPA improvements without needing to spend more.
4. Build a More Predictable Pipeline
Once you understand your conversion funnel, forecasting becomes easier. You can project pipeline velocity, conversion rates, and revenue with greater accuracy.
Pipeline predictability starts with understanding how leads flow through your funnel. With conversion analytics, you can map out each stage—from first touch to deal won—and identify average conversion rates, time delays, and bottlenecks.
For example, you might see that leads from Google Ads convert faster but churn more often, while organic leads move slowly through the funnel but have higher LTV. Knowing this allows your team to forecast more accurately and set realistic targets.
This is especially critical for sales-led teams who rely on pipeline forecasts for headcount planning, quota setting, and growth modeling. By understanding the behaviors and timelines of different lead sources, you can anticipate dips or surges before they happen.
Use Cometly’s analytics dashboard to get a real-time pulse on your pipeline health, segmented by source, attribution model, and funnel stage. Pair this with your CRM data to get an even clearer view.
And don’t forget to analyze historical trends. How did last quarter’s campaigns contribute to revenue? What was the average deal cycle? Are there seasonal shifts? The better your data, the smarter your forecasts.
Want to visualize the full journey? Our customer journey software article walks through how to track every step from click to close.
Conversion Analytics vs. Basic Conversion Tracking
Let’s clarify the difference.
 Conversion Analytics: How to Track, Analyze, and Improve Conversions
Still using basic goals in GA4? You may want to explore a better Google Analytics alternative like Cometly that’s purpose-built for conversion analytics.
Key Metrics to Track with Conversion Analytics
Want to go beyond “did they convert?” Here are deeper metrics to track—each offering a different lens to understand what’s working, what’s broken, and what’s quietly fueling your revenue growth.
Conversion Rate by Channel
This metric is foundational. Instead of just looking at your overall conversion rate, break it down by channel—Google Ads, Meta, LinkedIn, email, organic search, and more.
Tracking conversion rate by channel allows you to see not just where traffic is coming from, but where your highest-value actions are happening. You may discover that while Google Ads drives more traffic, Meta ads convert visitors at a higher rate. Or that organic blog traffic brings in your most qualified leads.
To better understand what’s happening across paid and organic efforts, see our in-depth guide on campaign analytics.
Time to Convert
How long does it take your average lead to convert? Time to convert is critical for understanding the buyer journey, especially in longer sales cycles like B2B SaaS. It helps you predict revenue timelines, spot friction, and optimize follow-up sequences.
For instance, you might find that users from cold paid social campaigns convert over 14–21 days, whereas Google Search traffic closes in under 5. That insight can influence budget allocation, retargeting cadences, and sales touchpoints.
Combine time-to-convert with insights from pipeline attribution to see how touchpoints accelerate or slow down deal velocity.
Funnel Drop-Off Points
Knowing how many people enter your funnel isn’t enough. You need to know where they leave. Funnel drop-off analysis pinpoints the steps where users abandon the process—whether that’s on your landing page, pricing page, sign-up form, or after booking a demo.
Armed with this data, you can A/B test CTAs, redesign friction-heavy pages, or better align messaging with user intent. In many cases, fixing a single broken funnel stage can result in double-digit lift in conversions.
We cover this kind of optimization extensively in our conversion funnel analytics breakdown.
Customer Journey Paths
Customer journey analytics helps you understand the full context of each conversion. It reveals the sequence of touchpoints—ads, pages, emails, videos, etc.—that influence buying decisions.
Some users convert after one interaction. Others may engage with your brand 10+ times across different channels. By mapping these paths, you’ll uncover which combinations of touchpoints tend to produce the highest-value customers.
You can also compare journeys across personas or traffic sources to design smarter nurture flows. Learn how to track and visualize entire journeys using customer journey software.
Attribution Model Influence
Different attribution models will tell you different stories. First-click models highlight what brings people in. Last-click shows what seals the deal. But to really understand influence, you need to apply models like linear, time decay, and position-based (U-shaped).
Model influence shows how each touchpoint contributes to conversion probability. It helps marketers understand not just where to spend, but how to prioritize messaging and engagement throughout the funnel.
For more on this, check out our popular piece on the ultimate guide to attribution models, or explore revenue attribution models to tie models directly to business outcomes.
View-Through Conversions
Click-based attribution only tells half the story. Many users don’t click your ad the first time they see it—but they remember it, come back later, and convert.
View-through conversion tracking allows you to capture those post-impression conversions. It’s especially valuable in channels like display and social, where engagement is often passive.
With Cometly, you can measure view-through conversions and assign credit to campaigns that influence buying behavior—even if there was no direct click.
Read more about how this works in our view-through conversions article.
How to Set Up Conversion Analytics
You’ll need three pillars to get started:
1. Pixel and Event Tracking
Install a pixel (like the Cometly pixel) across your site. Track events like pageviews, form fills, and purchases.
Want better accuracy? Use server-side tracking to bypass browser issues and ad blockers.
2. Unified Attribution
Ditch last-click. Use multi-touch attribution to credit every touchpoint.
Need help choosing the best model? Start with this guide to attribution models.
3. Dashboards and Reporting
Use Cometly’s report builder to visualize conversions across your campaigns, funnel stages, and revenue paths.
Conversion Analytics Use Cases by Business Type
B2B SaaS
Track SQLs, deals, and long sales cycles. Learn how B2B teams use attribution to improve results.
eCommerce
Track ROAS, upsells, and abandoned carts. Our eCommerce analytics guide shows how to improve product-level conversion tracking.
Agencies
Show clients exactly what’s working. Share insights from reporting tools for agencies.
Advanced Conversion Optimization Tips
Conversion analytics doesn’t stop at tracking—it helps you act.
Once you’ve implemented a robust analytics foundation, the next step is to use those insights to drive continuous improvements across your funnel. Below are advanced optimization strategies that high-performing teams use, all powered by the data surfaced through conversion analytics.
Run A/B Tests and Compare Funnel Performance
Not all tests are created equal. When you combine A/B testing with conversion analytics, you’re not just looking at which version got more clicks—you’re measuring which version led to more qualified conversions, pipeline creation, or revenue.
Want to test a new headline, creative, or CTA? Use analytics to compare the full downstream impact of each variation, not just the initial click-through rate. And don’t forget to test at multiple funnel stages: ad, landing page, form, nurture sequence, and even post-demo engagement.
To build your A/B testing strategy on a stronger data foundation, learn from our full guide to conversion funnel analytics.
Segment Users by Behavior or Channel
Segmentation is a game-changer. By slicing your analytics data based on behavior, traffic source, or persona, you can personalize your content, ads, and conversion paths in ways that dramatically improve results.
For example, if demo conversions from LinkedIn ads convert 3x higher than Meta, it might be time to rethink your budget split. Or maybe users who read your pricing page and blog post on campaign analytics are far more likely to sign up.
Behavior-based segmentation also allows for stronger nurture automation. Segment by:
- Page visit sequences (e.g., viewed pricing after feature page)
- Scroll depth or engagement time
- Entry path or campaign source
For more tactics, explore our post on marketing analytics tools to see how segmentation fits into a full-stack approach.
Use Predictive Analytics to Prioritize High-Intent Leads
What if you could know which leads were most likely to convert—before they even talked to sales?
That’s the power of predictive analytics fueled by conversion data. By analyzing patterns across historical conversions, you can build scoring models that surface high-intent leads based on behaviors, source, timing, and engagement.
This allows marketing and sales teams to:
- Prioritize follow-up
- Trigger workflows in your CRM or MAP
- Customize outreach for higher response rates
- Reduce wasted effort on low-fit leads
To make this actionable, sync your conversion data with tools like Cometly’s AI-driven analytics feature, which can guide you toward the best-performing campaigns and identify segments with the highest probability of closing.
Improve Messaging, Creatives, and Offers Based on Data
Too often, marketers guess what messaging will work. But conversion analytics gives you real evidence.
Maybe your product-focused messaging underperforms compared to value-based headlines. Maybe a certain customer story or use case drives more demo requests. Or maybe a discount offer works on Meta but tanks on LinkedIn.
Use conversion data to analyze not just CTRs, but conversion value per creative, offer, or audience. Then, double down on the high performers and phase out what’s underdelivering.
This is where tools like PPC reporting software and campaign analytics shine, letting you measure results down to the ad or keyword level.
Also check out our article on marketing attribution software to better understand how messaging performs across different attribution models and journey stages.
Final Word: Conversion Analytics Is Your Marketing Advantage
If you’re serious about marketing performance, conversion analytics isn’t optional—it’s essential.
It’s how you move from guessing to knowing. From reactive to proactive. From wasting spend to doubling down on what works.
Cometly helps you:
- Track the full buyer journey
- Attribute results with precision
- Optimize with real-time data
- Report confidently to your team or clients
Start Your Free Trial of Cometly
Ready to stop guessing and start scaling?
Start your free trial of Cometly and experience the power of real-time, multi-touch conversion analytics.
Whether you're a fast-growing B2B SaaS team, an eCommerce brand, or a performance-focused agency—Cometly gives you the insights, clarity, and confidence to grow faster.
Conversion analytics is how you win. Cometly is how you do it.


