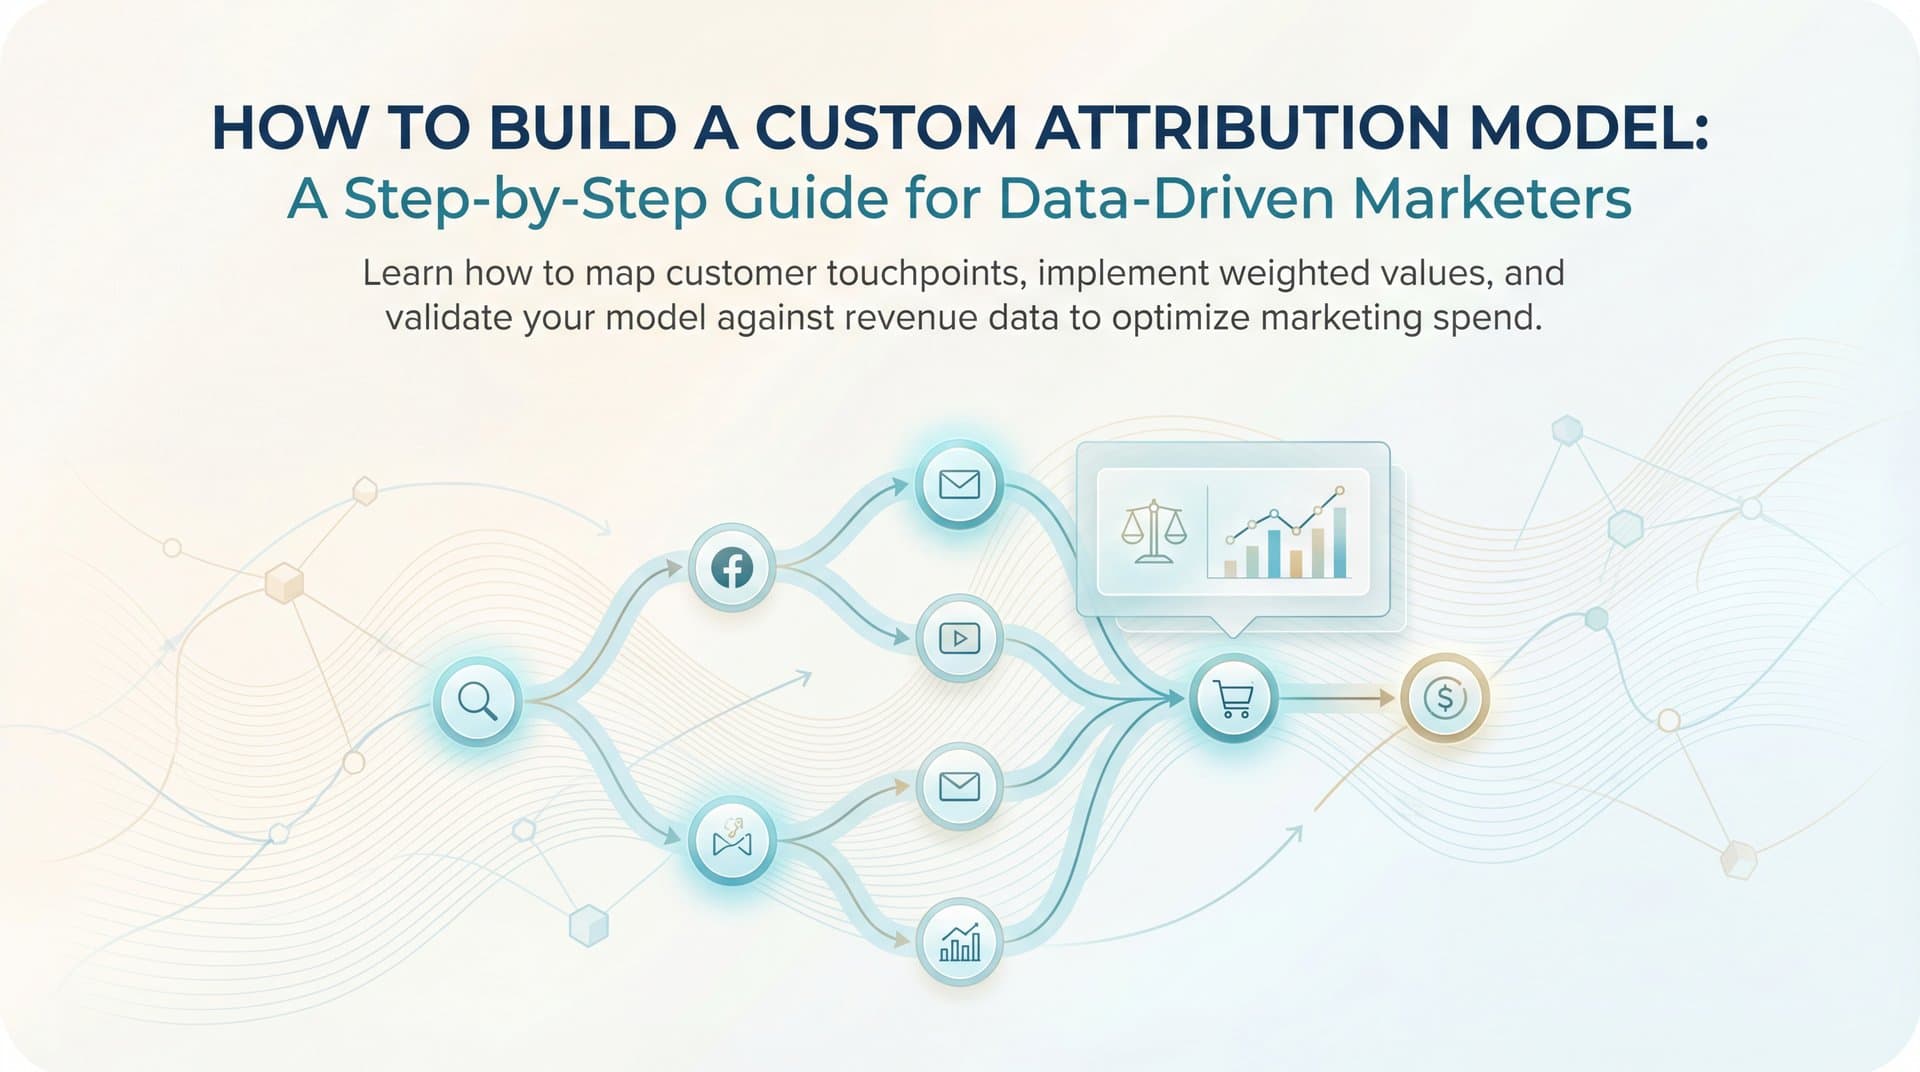
Standard attribution models like last-click or first-touch rarely reflect how your customers actually buy. A prospect might discover your brand through a LinkedIn ad, research you via organic search, click a retargeting ad, and finally convert after receiving an email sequence. Giving all the credit to just one of these touchpoints means misallocating budget and missing optimization opportunities.
A custom attribution model lets you assign credit based on how your specific audience behaves—not how a generic model assumes they behave. This guide walks you through building a custom attribution model from scratch, covering everything from mapping your customer journey to implementing weighted touchpoint values and validating your model against real revenue data.
By the end, you'll have a framework tailored to your business that shows exactly which channels and campaigns deserve more investment.
Step 1: Map Your Customer Journey and Identify Key Touchpoints
Before you can build a custom attribution model, you need to understand what you're actually attributing. This starts with a comprehensive audit of every channel currently driving traffic to your business.
Pull data from all your marketing channels: paid search, paid social, display ads, organic search, email campaigns, social media posts, referral traffic, and direct visits. Export the last 90 days of traffic data from your analytics platform and categorize each source. You're looking for patterns, not perfection at this stage.
Next, document the typical path to conversion. How many touchpoints occur before someone becomes a customer? What's the average journey length? Use your analytics platform to examine multi-channel conversion paths. Look specifically at users who converted versus those who didn't—the differences reveal which touchpoints matter most.
Pay attention to sequence. Does organic search typically come before or after paid ads in your converting journeys? Do email clicks tend to be final touchpoints or early research moments? These patterns inform how you'll weight each channel later.
Identify your most frequent touchpoint combinations. You might discover that 60% of your conversions involve both organic search and email, while only 15% involve paid social alone. These combinations tell you which channels work together to drive results.
Create a visual map of your most common conversion paths. List the three to five journey patterns that account for the majority of your revenue. This becomes your reference document for the entire model-building process.
Success indicator: You have a complete touchpoint inventory showing average journey length, the most common conversion paths, and which channels appear most frequently in winning versus non-winning journeys. If you can't clearly articulate your typical customer journey in three sentences, you need more data before proceeding.
Step 2: Define Your Conversion Events and Attribution Window
Your attribution model is only as good as what you're measuring. Start by defining exactly what counts as a conversion for your business. For e-commerce, this might be a completed purchase. For B2B companies, it could be a demo booking or qualified lead submission.
Assign monetary values to each conversion type whenever possible. If you're tracking multiple conversion events, weight them appropriately. A demo booking that converts to a customer 40% of the time with an average deal size of $10,000 has a value of $4,000. A content download might be worth $50 based on historical conversion rates.
This valuation lets you calculate attributed revenue, not just attributed conversions. Understanding revenue attribution reveals which channels drive profitable growth, not just activity.
Now set your attribution window—the timeframe during which touchpoints receive credit for a conversion. This should match your actual sales cycle, not an arbitrary number. If you're selling impulse-buy products where most purchases happen within hours of discovery, a 7-day window makes sense.
For B2B companies with longer sales cycles, extend your window to 30, 60, or even 90 days. Analyze your historical data to see how long prospects typically take from first touch to conversion. If 80% of your customers convert within 45 days, that's your window.
Decide whether to track micro-conversions as supporting events. Email signups, content downloads, and webinar registrations don't generate immediate revenue, but they're often critical steps in the journey. Including them gives you visibility into the full funnel, though you'll want to assign them lower weights than final conversion events.
Success indicator: You have documented conversion definitions with clear monetary values and a justified attribution window based on your actual sales cycle data. You should be able to explain why your window is 30 days instead of 7 or 90 using real customer behavior data.
Step 3: Choose Your Base Model and Weighting Logic
Every custom attribution model starts with a foundation. The three most common base models are linear (every touchpoint gets equal credit), time-decay (recent touchpoints get more credit), and position-based (first and last touchpoints get the most credit, with the middle distributed evenly).
Linear attribution makes sense when every touchpoint genuinely contributes equally to the decision. This is rare in practice but can work for short sales cycles with few touchpoints. Time-decay attribution works well when recent interactions matter more than early ones—think of retargeting campaigns that close deals after initial awareness.
Position-based models, often called U-shaped attribution, typically assign 40% credit to the first touch, 40% to the last touch, and distribute the remaining 20% across middle touchpoints. This approach recognizes that discovery and final conversion moments are particularly valuable.
Here's where customization begins. Review your customer journey map from Step 1. If you consistently see that prospects who engage with mid-funnel content like case studies or comparison pages convert at higher rates, increase the weight for those touchpoints.
Consider channel-specific adjustments based on intent. Brand search queries often appear in converting journeys, but they're capturing existing demand rather than creating it. Someone searching your company name already knows about you. Give brand search less credit than non-brand discovery channels that introduce prospects to your solution.
Similarly, direct traffic often represents people who already know your brand and are returning to convert. While the direct visit might be the last touch, the real value came from earlier touchpoints that built awareness and consideration.
Document your weighting formula with clear rationale. For example: "First touch receives 30% because our data shows that the initial discovery channel strongly influences final conversion. Last touch receives 30% because the final interaction indicates buying readiness. Middle touchpoints receive 40% distributed proportionally, with content engagement weighted 1.5x standard touchpoints because prospects who view case studies convert at 2x the rate of those who don't."
Success indicator: You have a documented weighting formula where every decision is tied to your actual customer behavior data. If someone asks why you weighted a channel a certain way, you can point to specific patterns in your conversion paths.
Step 4: Set Up Cross-Platform Tracking Infrastructure
Your custom attribution model requires complete data. That means connecting every marketing channel, your CRM, your website analytics, and your ad platforms into a unified tracking system. Without this infrastructure, you're building a model on incomplete information.
Start by connecting all your ad platforms to a central attribution system. This includes Meta Ads, Google Ads, LinkedIn Ads, and any other paid channels you're running. Each platform reports conversions differently, and most only see their own touchpoints. A unified system shows the complete journey.
Integrate your CRM to connect marketing touchpoints with actual revenue. This is especially critical for B2B companies where the sale happens offline. You need to know not just that someone filled out a form, but that they became a customer and what they spent.
Implement server-side tracking to capture touchpoints that client-side cookies miss. Since iOS 14 and increasing privacy regulations, browser-based tracking has become significantly less reliable. Server-side tracking captures events directly from your server, bypassing browser restrictions and providing more accurate data.
This is particularly important for mobile traffic and users with ad blockers. A significant portion of your audience won't trigger client-side tracking pixels, which means standard analytics platforms miss their entire journey. Server-side tracking fills these gaps.
Establish consistent UTM parameters and naming conventions across all campaigns. Every ad, email, and social post should follow the same structure. Use a standard format like utm_source for the platform, utm_medium for the channel type, utm_campaign for the campaign name, and utm_content for specific ad variations.
Inconsistent naming breaks your attribution model. If you sometimes tag Facebook ads as "facebook" and sometimes as "fb" or "meta," your model treats them as separate channels. Create a tagging guide and enforce it across your entire marketing team. Understanding customer attribution tracking fundamentals helps ensure your data remains clean and actionable.
Success indicator: You have a single source of truth showing the complete customer journey from first touch to revenue. When you look up any converted customer, you can see every marketing touchpoint they experienced, in sequence, with accurate timestamps. If you can't trace a complete journey for at least 80% of your conversions, your tracking infrastructure isn't ready.
Step 5: Build and Test Your Custom Model
Now you're ready to apply your weighting logic to real data. Export your historical conversion data for the past 90 days, including all touchpoints for each converting customer. This is where your unified tracking system proves its value.
Apply your weighting formula to each touchpoint in every customer journey. If a customer had five touchpoints—paid social, organic search, email, retargeting ad, and direct visit—calculate the attributed value for each based on your weights. Sum these across all conversions to get attributed revenue per channel.
Compare your custom model results against standard attribution models. Run the same data through last-click, first-click, and linear attribution. A thorough comparison of attribution models reveals where your model diverges from generic approaches.
You should see meaningful differences. If your custom model produces nearly identical results to last-click attribution, either your weighting logic isn't actually custom or your customer journeys are simpler than you thought. More likely, you'll see that channels like organic search, email, and mid-funnel content receive more credit in your custom model than they do in last-click.
This is the insight you're after. Your custom model should highlight channels that platform-native attribution undervalues. These are your optimization opportunities.
Run a validation period where you track both your custom model and platform-reported conversions. Monitor performance for 30 days without making any budget changes. This establishes a baseline and lets you verify that your model produces stable, actionable insights.
Look for consistency. Your attributed revenue should align reasonably with your actual revenue. If your model attributes $100,000 in revenue to your marketing channels but you only generated $80,000 total, something's wrong with your tracking or your conversion values. Learning how to fix attribution discrepancies becomes essential when numbers don't align.
Test edge cases. What happens with single-touch conversions? Does your model handle them appropriately? What about journeys with 15+ touchpoints? Make sure your weighting logic produces sensible results across the full range of customer behaviors.
Success indicator: Your custom model produces insights that differ meaningfully from default attribution, the differences make logical sense based on your customer journey understanding, and the attributed revenue aligns with your actual revenue within a reasonable margin.
Step 6: Optimize Budget Allocation Based on Model Insights
Your custom attribution model reveals which channels deserve more investment. Now you need to act on those insights systematically.
Identify channels that your model shows are undervalued by standard attribution. These are typically mid-funnel touchpoints like content marketing, email nurture sequences, and organic search. If your custom model attributes 25% of revenue to organic content but last-click gives it 8%, you've found an optimization opportunity.
Shift budget gradually toward undervalued channels. Don't make dramatic changes overnight. Start by reallocating 10-15% of your budget toward channels your model identifies as high-value. Monitor results for four to six weeks before making additional changes.
Set up ongoing monitoring to track whether budget changes improve overall marketing efficiency. Watch your blended customer acquisition cost and return on ad spend. Your custom model should help you spend smarter, which means lower acquisition costs or higher revenue per dollar spent.
If you reallocate budget and your overall performance declines, investigate. Either your model has flaws, your implementation was incorrect, or external factors changed. Attribution models are tools for decision-making, not guarantees of outcomes.
Refine your weights quarterly based on new data. Your customer journey evolves as your marketing mix changes, your product matures, and market conditions shift. What worked in Q1 might not work in Q4. Review your conversion path data every quarter and adjust your model accordingly. Knowing when to switch attribution models entirely can also improve your results as your business scales.
Watch for seasonal patterns. B2B companies often see different buying behaviors in Q4 versus Q1. E-commerce businesses see dramatic shifts around holidays. Your attribution weights might need seasonal adjustments to stay accurate.
Success indicator: You see measurable improvement in marketing efficiency after implementing model-driven budget shifts. This could mean lower cost per acquisition, higher revenue per dollar spent, or better conversion rates. The specific metric matters less than the directional improvement.
Making Your Model Work Long-Term
Building a custom attribution model requires upfront investment in tracking infrastructure and analysis, but the payoff is marketing decisions based on how your customers actually behave. Start by mapping your real customer journey, define clear conversion events, establish weighting logic grounded in data, and ensure your tracking captures every touchpoint.
Then validate your model against revenue outcomes and use it to guide budget allocation. Your custom model will never be perfect, but it will be far more accurate than generic alternatives—and accuracy is what drives profitable scaling.
Before you launch, run through this checklist: Are all channels tracked with consistent naming conventions? Does your attribution window match your actual sales cycle? Have you documented your weights with clear rationale? Did you schedule a validation period to test your model against real outcomes?
Think of your custom attribution model as a living system that evolves with your business. The channels that drive results today might not be the same ones that drive results six months from now. Regular refinement keeps your model accurate and your marketing decisions sharp.
The most common mistake is building a model once and never updating it. Set quarterly reviews on your calendar. Examine your conversion paths, verify your tracking is still capturing complete journeys, and adjust weights based on new patterns. This ongoing maintenance is what separates useful models from abandoned spreadsheets.
Ready to elevate your marketing game with precision and confidence? Discover how Cometly's AI-driven recommendations can transform your ad strategy—Get your free demo today and start capturing every touchpoint to maximize your conversions.