You're running campaigns across Meta, Google, LinkedIn, and email. Budget is flowing. Clicks are happening. But when your CEO asks which channels actually drive revenue, you're stuck piecing together fragmented data from five different dashboards. Sound familiar?
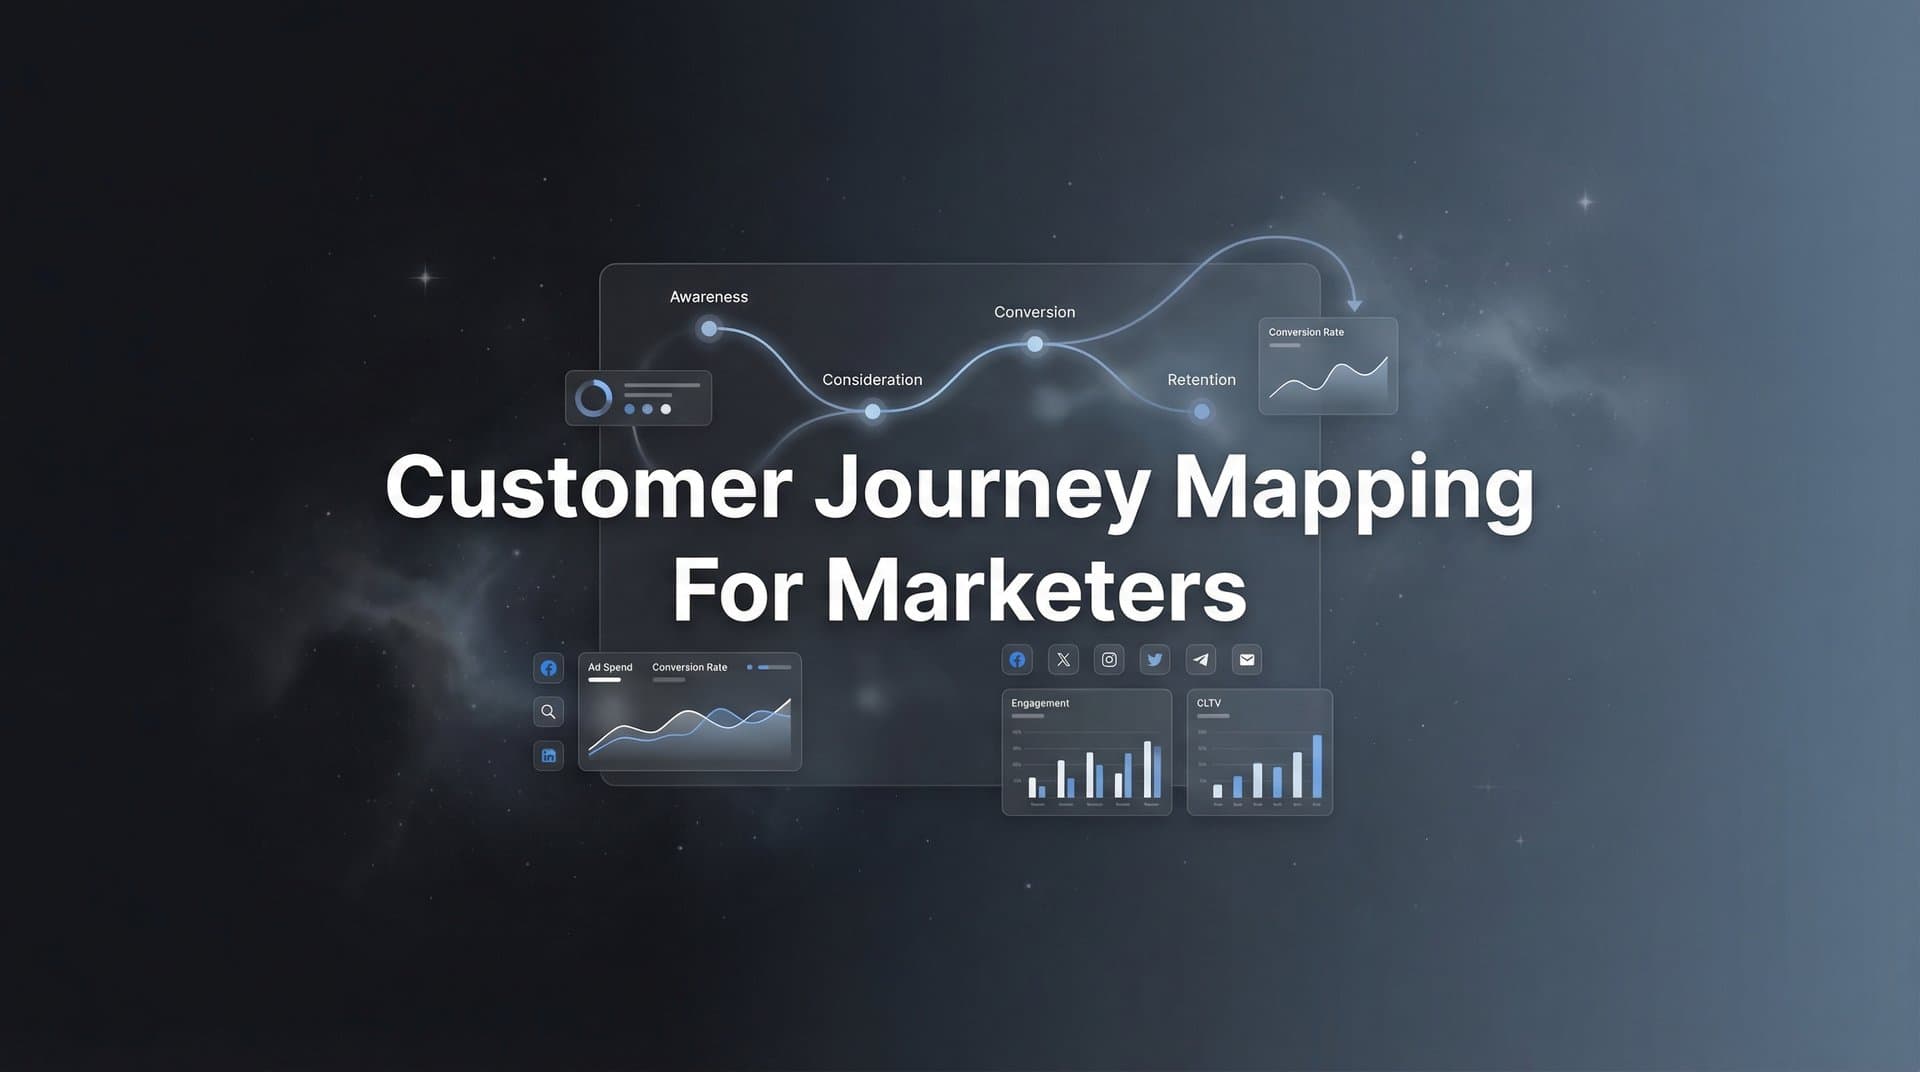
Customer journey mapping solves this exact problem by visualizing how prospects move from first ad click to closed deal. Not the theoretical buyer journey diagrams from marketing textbooks, but a real, data-backed map showing which touchpoints in your actual tech stack drive conversions.
This guide walks you through building a customer journey map specifically designed for marketers who need to understand attribution and optimize ad spend. By the end, you'll have a working journey map that connects your marketing touchpoints to real revenue, not vanity metrics like impressions or page views.
Whether you're managing campaigns for a SaaS company or an ecommerce brand, these steps will help you identify which channels deserve more budget and which are quietly burning cash. No more guessing. No more defending budget decisions with gut feelings. Just clear visibility into what's actually working.
Step 1: Define Your Conversion Goals and Key Revenue Events
Before you can map a journey, you need to know where that journey ends. What counts as a conversion in your business? This seems obvious until you realize that most marketing teams track dozens of events without clearly defining which ones actually matter.
Start by identifying your primary conversion events. These are the actions that directly generate revenue or qualified pipeline. For a SaaS company, this might be "demo booked" or "trial started." For ecommerce, it's "purchase completed." For a service business, it could be "consultation scheduled."
Pick three to five primary events maximum. More than that and you'll dilute your focus. Less than that and you're probably missing important conversion points.
Next, map your secondary micro-conversions. These are actions that indicate buying intent but don't directly generate revenue. Think pricing page visits, case study downloads, product comparison tool usage, or email replies to nurture sequences. These customer journey touchpoints matter because they help you understand the path prospects take before they convert.
Here's the crucial step most marketers skip: connect these events to actual revenue values in your CRM. A demo booked might convert to revenue 30% of the time with an average deal size of $5,000. That makes each demo worth $1,500 in expected value. A pricing page visit might convert at 5% with the same deal size, making it worth $250.
When you assign dollar values to each conversion event, you can finally compare the true value of different marketing touchpoints. A channel that drives 100 pricing page visits ($25,000 in expected value) might actually be more valuable than one that drives 10 demos ($15,000 in expected value), even though demos feel more important.
Document all of this in a simple spreadsheet. Three columns: Event Name, Conversion Rate to Revenue, Average Deal Value. This becomes your north star for everything that follows.
Success indicator: You have a clear list of three to five conversion events with dollar values attached, and your team agrees these are the metrics that actually matter for business growth.
Step 2: Audit Every Marketing Touchpoint in Your Current Stack
Now you need a complete inventory of every place a prospect might interact with your brand before converting. Most marketers think they know their touchpoints, but this exercise always reveals blind spots.
Start with your paid channels. List every platform where you're actively spending money: Meta (Facebook and Instagram), Google Ads, LinkedIn, TikTok, Twitter, programmatic display, retargeting networks, affiliate programs. For each one, note whether you're running search, display, video, or multiple ad formats.
Next, document your organic touchpoints. This includes SEO (organic search traffic), email marketing (both promotional and nurture sequences), social media (organic posts and engagement), referral traffic, direct traffic, and any content syndication or guest posting efforts.
Don't forget the touchpoints that live outside your website. Sales calls, product demos, webinars, trade show interactions, customer support conversations. These all influence the journey, especially in B2B where high-touch sales processes are common.
For each touchpoint, document your current tracking method. Are you using UTM parameters? Pixel tracking? Server-side events? CRM integration? Or worse, nothing at all? Understanding how marketers use UTMs for campaigns is essential for accurate tracking.
This is where you'll discover the gaps. Common blind spots include iOS users who block tracking pixels, cross-device journeys where someone clicks an ad on mobile but converts on desktop, phone calls generated by ads, and offline events that happen after online touchpoints.
Pay special attention to retargeting and remarketing. These channels rarely get credit in last-click attribution models, but they often play a crucial role in moving prospects from awareness to consideration. If you're not tracking view-through conversions or assisting touchpoints, you're probably undervaluing your retargeting efforts.
Create a master spreadsheet with four columns: Touchpoint Name, Channel Type (paid/organic), Current Tracking Method, and Tracking Status (fully tracked, partially tracked, or not tracked). Be brutally honest about the gaps. You can't fix what you don't acknowledge.
The most common gap? The space between ad click and CRM conversion. Your ad platforms know someone clicked. Your CRM knows someone converted. But there's often no clear connection between the two, especially when days or weeks pass between click and conversion.
Success indicator: You have a complete inventory of all channels with tracking status noted, and you've identified specific gaps where touchpoints aren't being captured accurately.
Step 3: Connect Your Data Sources for Full Journey Visibility
This is where customer journey mapping gets real. You need to connect your ad platforms, website analytics, and CRM so you can see a single customer's complete path from first ad click through to revenue.
Start by integrating your ad platforms with your CRM. Most modern CRMs offer native integrations with Meta, Google, and LinkedIn that let you pass conversion data back to the ad platforms. This serves two purposes: it helps the ad platforms optimize their algorithms, and it creates a record in your CRM of which ads generated which leads.
But here's the problem with browser-based tracking: it's increasingly unreliable. iOS privacy updates, cookie blockers, and cross-device journeys create gaps that traditional pixel tracking can't bridge. A prospect might click your Meta ad on their iPhone, visit your pricing page on their work laptop, and convert three days later on their iPad. Browser-based tracking sees three different people.
This is where server-side tracking becomes critical. Instead of relying on browser pixels that users can block, server-side tracking captures events directly from your server to the ad platforms and analytics tools. When someone fills out a form, your server sends that conversion event directly to Meta, Google, and your analytics platform, regardless of whether their browser blocked the tracking pixel.
Set up a central analytics system that receives events from all sources. This could be a dedicated attribution platform, a data warehouse, or even a well-configured Google Analytics 4 property with BigQuery integration. The key is having one place where you can see all touchpoints for a single customer journey. Many teams benefit from a customer journey analytics platform designed specifically for this purpose.
Make sure your website events flow into this central system. Form submissions, page views, button clicks, video plays, pricing calculator usage. Every meaningful interaction should be captured and tied to a user identifier that persists across sessions.
The technical implementation varies based on your stack, but the goal is always the same: when you look up a customer in your CRM, you should be able to see every ad they clicked, every page they visited, every email they opened, and every touchpoint that influenced their decision to convert.
Test your setup by creating a test lead yourself. Click one of your ads, visit your website, fill out a form. Then check your CRM, your analytics platform, and your ad platform. Can you see the complete journey? If not, you've found your next gap to fix.
Success indicator: You can look up a real customer in your system and see their complete path from first ad click through to CRM conversion, including all touchpoints along the way.
Step 4: Map the Typical Paths Your Best Customers Take
Now that you're capturing journey data, it's time to analyze it. Start by filtering for your closed-won deals from the past 90 days. These are your best customers, the ones who actually generated revenue. What did their journeys look like?
Look for patterns in first-touch channels. What percentage of high-value customers first discovered you through Google search versus Meta ads versus LinkedIn? This tells you which channels are best at generating awareness among your ideal customers, not just generating cheap clicks.
Many marketing teams discover that their highest-value customers come from different channels than their highest-volume channels. You might get 1,000 leads per month from Meta but only 100 from LinkedIn, yet those 100 LinkedIn leads might close at 3x the rate with 2x the deal size. That's a golden path worth investing in.
Next, identify the mid-funnel touchpoints that commonly appear in high-value journeys. Do your best customers typically visit the pricing page multiple times before converting? Do they download case studies? Do they engage with comparison content? These patterns reveal the content and touchpoints that help move serious prospects toward a decision. Learning how to analyze customer journeys effectively makes this process much more actionable.
Document the average time between first touch and conversion for different customer segments. Enterprise deals might take 60 days with 15 touchpoints. Small business customers might convert in 7 days with 4 touchpoints. Understanding these timelines helps you set realistic expectations and avoid prematurely cutting campaigns that are actually working but need time to mature.
Create visual representations of your two to three most common golden paths. For example: "Enterprise Golden Path: LinkedIn ad click → Blog article → Case study download → Pricing page visit → Demo request → Email nurture sequence → Sales call → Closed deal. Average time: 45 days."
Compare these golden paths to your current marketing mix. Are you investing heavily in channels that rarely appear in high-value journeys? Are you neglecting touchpoints that consistently show up in your best customer paths?
Pay attention to the sequence, not just the presence of touchpoints. A prospect who visits your pricing page before reading any content might be a different buyer persona than one who reads three blog posts before checking pricing. These sequence patterns can inform how you structure your campaigns and content.
Success indicator: You have two to three documented golden paths that high-value customers commonly follow, including typical touchpoint sequences and conversion timelines.
Step 5: Identify Drop-Off Points and Attribution Gaps
Your journey map should reveal not just what's working, but what's broken. Start by identifying where prospects commonly exit the journey before converting.
Look at your funnel metrics. How many people click your ads but never visit a second page? How many visit your pricing page but never request a demo? How many start your trial but never activate? Each of these drop-off points represents either a messaging mismatch or a friction point you need to address.
Sometimes the drop-off isn't about your website or product. It's about the journey itself. If prospects consistently engage with your content for two weeks then disappear, you might need more mid-funnel touchpoints to maintain engagement during the consideration phase. Understanding the customer journey stages helps you identify exactly where these gaps occur.
Next, spot channels that generate clicks but rarely appear in conversion paths. These are your vanity metric channels. They look good in your ad platform dashboard (lots of clicks, low cost per click), but when you trace those clicks forward, they don't lead to revenue.
This is especially common with broad awareness campaigns. A viral social post might drive 10,000 clicks, but if none of those visitors match your ideal customer profile, they'll bounce and never convert. The clicks feel like success, but they're not moving your business forward.
Compare first-touch attribution to last-touch attribution for each channel. First-touch shows which channels start the journey. Last-touch shows which channels get the final interaction before conversion. The gap between these reveals which channels are over or under-credited. Many marketers struggle with customer journey attribution problems that distort their understanding of channel performance.
Retargeting campaigns almost always look terrible in first-touch attribution (they rarely start the journey) but often look great in last-touch attribution (they frequently get the final click). If you only looked at first-touch data, you'd cut retargeting. If you only looked at last-touch data, you'd massively over-invest in it. The truth is somewhere in the middle.
Document these attribution gaps for your top five channels. Create a simple table showing first-touch conversions, last-touch conversions, and total assisted conversions for each channel. This reveals which channels are discovery engines, which are closers, and which play a supporting role throughout the journey.
Success indicator: You have a clear list of problem areas (drop-off points and low-performing channels) and a documented understanding of which channels get over or under-credited in single-touch attribution models.
Step 6: Optimize Your Ad Spend Based on Journey Insights
Now comes the payoff. Your journey map should directly inform budget decisions. Start by reallocating spend toward channels that consistently appear in high-value customer journeys, even if they don't look impressive in last-click attribution.
If your analysis shows that prospects who engage with LinkedIn ads early in their journey convert at 3x the rate of other channels, that's a signal to increase LinkedIn budget, even if LinkedIn rarely gets last-click credit. The channel is doing valuable work at the top of the funnel that pays off later.
Feed your enriched conversion data back to ad platforms to improve their targeting algorithms. When you send server-side conversion events with revenue values attached, Meta and Google can optimize for high-value conversions, not just volume. Using conversion tracking software for multiple ad platforms streamlines this process significantly.
Set up conversion value optimization in your ad platforms. Instead of optimizing for "purchases" or "leads," optimize for "purchase value" or "lead value" using the dollar amounts you defined in Step 1. The algorithms will start showing your ads to people who look like your high-value customers, not just people who are likely to click.
Create campaign structures that align with your golden paths. If your best customers typically engage with educational content before requesting a demo, build a campaign sequence that mirrors this: awareness campaign with educational content, retargeting campaign for pricing page visitors, conversion campaign for demo requests.
Set up ongoing monitoring to track how journey patterns shift over time. Customer behavior changes. New channels emerge. Competitors adjust their strategies. Your journey map from March might not reflect reality in September. Schedule monthly reviews where you update your golden paths and check for new drop-off points or attribution gaps. The right customer journey tracking tools make this ongoing analysis much easier to manage.
Use your journey insights to inform creative decisions, not just budget allocation. If you notice that prospects who watch your product demo video convert at 5x the rate of those who don't, create more video ads that introduce the product. If case study downloads consistently appear in enterprise customer journeys, promote case studies more heavily in your enterprise-focused campaigns.
Success indicator: Your budget decisions are now backed by multi-touch journey data, not just last-click metrics, and you have a process for regularly updating your strategy based on evolving journey patterns.
Your Journey Map Is Now a Living Revenue Engine
You've built something most marketing teams never create: a data-backed map that connects marketing activity to actual revenue. Not theories about how customers should behave, but evidence of how your best customers actually move from awareness to conversion.
Quick checklist to confirm you're ready: conversion events defined with revenue values, all touchpoints audited and tracked, data sources connected for full visibility, golden paths documented, drop-off points identified, and budget decisions aligned with journey insights.
The most effective marketing teams revisit their journey maps monthly, adjusting as they launch new campaigns or enter new channels. Your map should evolve as your business grows and customer behavior shifts. What works in Q1 might need adjustment by Q3.
With accurate attribution data flowing from every touchpoint, you can confidently scale the campaigns that actually drive results. No more defending budget decisions with guesswork. No more wondering which channels deserve more investment. Just clear visibility into what's working and what's not.
Ready to elevate your marketing game with precision and confidence? Discover how Cometly's AI-driven recommendations can transform your ad strategy. Get your free demo today and start capturing every touchpoint to maximize your conversions.