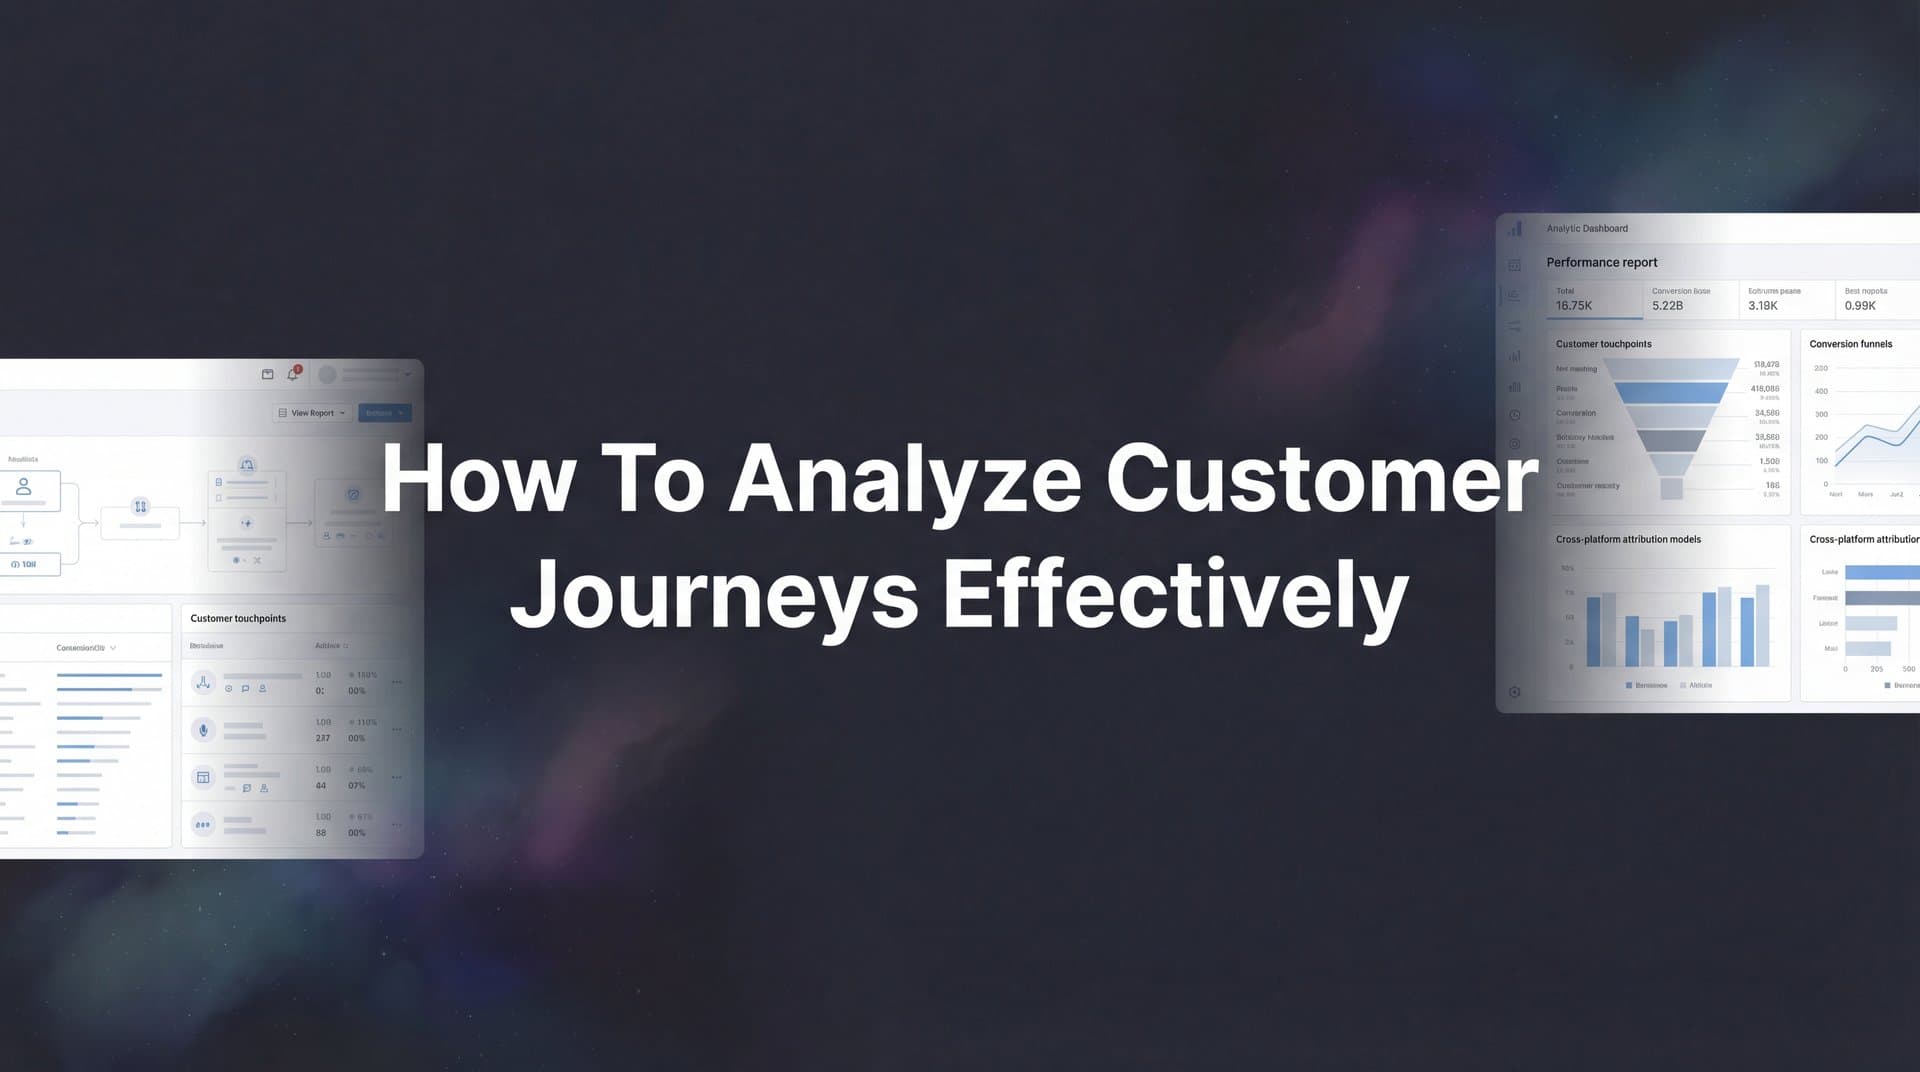
Your best-converting customer just clicked an Instagram ad, visited your pricing page three days later via Google search, read two blog posts over the following week, and finally converted after clicking a retargeting ad. Which channel gets credit for that sale? If you're only looking at last-click attribution, you'd say retargeting. But that Instagram ad started the entire journey—and those blog posts built the trust that made the conversion possible.
Most marketers are flying blind when it comes to understanding how customers actually move through their funnel. You see channel-specific metrics—Facebook says it drove 50 conversions, Google claims 80—but those numbers overlap, double-count, and tell completely different stories depending on which dashboard you're looking at.
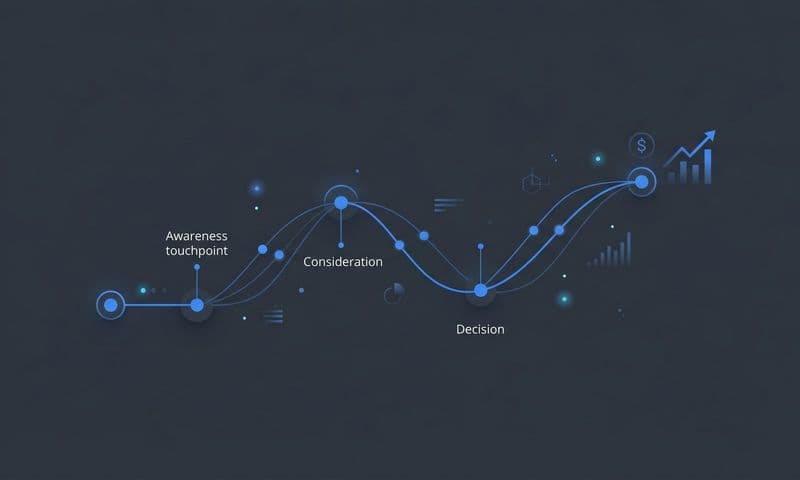
The reality? Modern buyers don't convert in a straight line. They bounce between channels, devices, and touchpoints before making a decision. B2B purchases especially involve multiple stakeholders, extended research phases, and numerous interactions across weeks or months.
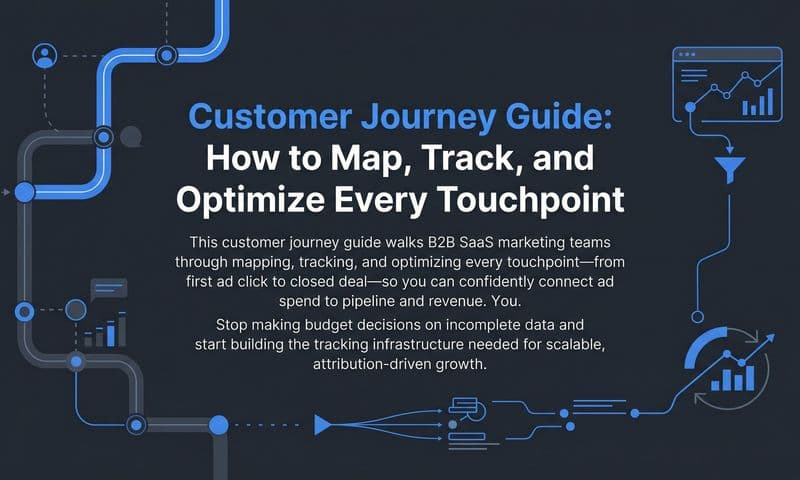
This guide walks you through a practical six-step framework for analyzing customer journeys effectively. You'll learn how to connect fragmented data sources, map the actual paths customers take, identify which channels truly drive conversions, and turn those insights into confident budget decisions. Whether you're managing campaigns across Meta, Google, TikTok, or a dozen other platforms, this process helps you see the complete picture—not just isolated snapshots.
By the end, you'll have a repeatable system for understanding exactly how your customers convert, which touchpoints matter most, and where your next marketing dollar should go.
Step 1: Connect Your Data Sources for Complete Journey Visibility
You can't analyze what you can't see. The first step in effective customer journey analysis is connecting every source where customer interactions happen—ad platforms, your website, CRM, email system, and any offline conversion events like phone calls or in-person meetings.
Here's the problem most marketers face: each platform operates in its own silo. Meta tracks ad clicks and conversions within its ecosystem. Google does the same. Your website analytics captures sessions and pageviews. Your CRM records deal stages and revenue. These systems don't naturally talk to each other, which means you're looking at fragments of the customer journey, not the complete story.
Start by listing every touchpoint where customers interact with your brand. This typically includes paid ad platforms (Meta, Google, TikTok, LinkedIn), organic channels (search, social, email), your website or app, and backend systems like your CRM or payment processor. Each of these generates data about customer behavior, but that data lives in separate databases with different tracking methods and attribution logic. Understanding customer journey touchpoints is essential for building this comprehensive view.
The next challenge: browser-based tracking is increasingly unreliable. iOS privacy changes, cookie restrictions, and ad blockers mean traditional pixel-based tracking misses a significant portion of customer activity. You might see someone click an ad on their iPhone, but if they convert later on a laptop, those two events appear disconnected in your analytics.
This is where server-side tracking becomes essential. Unlike browser-based pixels that rely on cookies, server-side tracking captures data directly from your server to the analytics platform. When a customer submits a form, makes a purchase, or completes any meaningful action, your server sends that event data immediately—regardless of browser settings or device changes. Learning how tracking pixels work helps you understand why server-side alternatives have become necessary.
Set up integrations that connect your ad platforms to your analytics system and your CRM. Modern attribution platforms can receive data from multiple sources, match it to individual customer journeys using identifiers like email addresses or customer IDs, and build a unified view of how each person moved through your funnel.
Before moving forward, verify everything is working correctly. Run test conversions, check that events are appearing in your analytics dashboard, and confirm that data from different sources is being matched to the same customer records. If your tracking foundation is shaky, every analysis you build on top of it will be unreliable.
Step 2: Define Your Key Conversion Events and Micro-Conversions
Not all customer actions carry equal weight. A newsletter signup means something different than a demo request, which means something different than a closed deal. To analyze customer journeys effectively, you need to define exactly which events matter and how much they matter.
Start with your primary conversion events—the actions that directly indicate purchase intent or revenue. For e-commerce, that's typically a completed purchase. For SaaS, it might be a trial signup or demo request. For lead-gen businesses, it's often a qualified form submission or booked sales call. These are your north star metrics, the events that ultimately determine marketing success.
But customers rarely jump straight to those high-intent actions. They signal interest through smaller behaviors first—what we call micro-conversions. These might include viewing your pricing page, downloading a resource, watching a product video, comparing features, or engaging with customer reviews. Each of these actions indicates the customer is moving closer to a decision, even if they're not ready to convert yet.
Map out the typical progression customers follow in your business. A B2B software buyer might first download a comparison guide, then attend a webinar, then request a demo, then start a trial, and finally convert to a paid plan. Each of those steps represents meaningful progress, and tracking them helps you understand which early-stage touchpoints lead to eventual conversions. This aligns with understanding the stages of the customer journey in your specific context.
Assign value weights to different conversion types based on their business impact. A closed deal worth $10,000 obviously carries more weight than a content download. But that content download might be the first step in a journey that leads to multiple high-value deals. Some attribution systems let you assign fractional values to micro-conversions—perhaps a pricing page view is worth 10% of a full conversion, while a demo request is worth 50%.
Verify your conversion tracking is capturing these events accurately. Fire test events for each conversion type and confirm they're appearing in your analytics with the correct labels and values. Check that events are being attributed to the right traffic sources. If someone clicks a Facebook ad, then converts three days later, that conversion should be connected back to that original Facebook click—not just attributed to "direct" traffic.
The goal is creating a clear hierarchy of customer actions that lets you evaluate which touchpoints move people toward your most valuable outcomes. When you analyze customer journeys in the next steps, you'll be looking at sequences of these defined events—not just generic "sessions" or "pageviews."
Step 3: Map the Typical Paths Customers Take Before Converting
Now that you're capturing complete data and tracking meaningful events, it's time to identify the actual paths customers follow. This is where journey analysis moves from theory to reality—you're looking at real sequences of touchpoints that led to real conversions.
Start by analyzing your highest-value customers. Pull conversion data for the past 60-90 days and examine the touchpoint sequences that preceded each purchase. You're looking for patterns: What channels did these customers interact with? In what order? How many touchpoints occurred before they converted?
Many marketers are surprised to discover how complex their customer journeys actually are. You might assume customers see one ad and convert, but the data often reveals 5, 8, or even 12+ touchpoints spanning multiple channels and several weeks. A typical B2B journey might look like: paid social ad click → blog post visit → email newsletter signup → webinar attendance → retargeting ad click → pricing page visit → demo request → conversion. Understanding the customer path to purchase reveals these complex patterns.
Identify how many touchpoints typically occur before conversion in your specific business. This number varies dramatically by industry, product complexity, and price point. A $20 impulse purchase might convert after 1-2 touchpoints. A $50,000 enterprise software sale might require 15+ interactions across three months. Understanding your typical journey length helps you set realistic expectations for campaign performance and budget allocation.
Look for the channels that most frequently appear in winning journey sequences. You might discover that while paid search gets credit for final conversions, paid social consistently appears as the first or second touchpoint in high-value customer journeys. Or you might find that customers who engage with educational content (blog posts, guides, webinars) before requesting a demo have significantly higher conversion rates than those who go straight to a sales conversation.
Document common journey patterns. Do customers typically discover you through social ads, then search for your brand name later and convert? Do they find you organically first, then see retargeting ads that bring them back to convert? Are there specific content pieces that consistently appear in converting journeys? These patterns reveal which channel combinations work synergistically to drive conversions.
Pay attention to timing as well. How much time typically elapses between first touch and conversion? Are there specific touchpoint sequences that shorten the sales cycle? Understanding timing helps you set appropriate attribution windows and avoid prematurely judging campaigns that plant seeds for future conversions rather than driving immediate results. Robust customer journey tracking software makes this analysis significantly easier.
Step 4: Compare Attribution Models to Understand Channel Contribution
Here's where many marketers get journey analysis wrong: they rely on a single attribution model and treat its results as absolute truth. In reality, different attribution models tell different stories about channel performance—and each story reveals something valuable.
Single-touch attribution models assign 100% of conversion credit to one touchpoint. Last-click attribution gives all credit to the final interaction before conversion—typically search, retargeting, or direct traffic. First-click attribution credits the initial touchpoint that started the customer journey—often paid social, display, or organic content. Both models are incomplete because they ignore everything that happened in between.
Last-click attribution systematically undervalues awareness and consideration channels. If a customer discovers your brand through a Facebook ad, researches your product over two weeks, and finally converts after clicking a Google search ad, last-click gives Facebook zero credit—even though that initial ad started the entire journey. This leads to underinvestment in top-of-funnel channels that generate new customer awareness.
First-click attribution has the opposite problem: it overvalues initial touchpoints while ignoring the nurturing and remarketing efforts that actually closed the deal. Just because someone clicked an ad doesn't mean that ad deserves full credit if it took five more interactions to convince them to buy.
Multi-touch attribution distributes credit across multiple touchpoints in the customer journey. Linear attribution splits credit evenly across all interactions. Time-decay attribution gives more weight to touchpoints closer to conversion. Position-based (U-shaped) attribution emphasizes both the first and last touchpoints while giving some credit to middle interactions. Data-driven attribution uses machine learning to assign credit based on which touchpoints statistically increase conversion probability. Learning how to measure marketing attribution properly is crucial for accurate analysis.
Compare how different models credit your channels. Run the same conversion data through last-click, first-click, and a multi-touch model. You'll likely see dramatically different results. Paid search might dominate in last-click but show much lower value in first-click. Social media might appear weak in last-click but strong in first-click and multi-touch models. Content marketing might barely register in single-touch models but show consistent presence in multi-touch analysis.
The goal isn't to find the "right" attribution model—it's to understand the full picture. Last-click tells you which channels close deals. First-click reveals which channels generate new customer awareness. Multi-touch models show which channels consistently contribute throughout the journey. Each perspective is useful for different decisions. Understanding how to measure assisted conversions helps you see the full contribution of each channel.
Choose the attribution approach that aligns with your sales cycle and business model. If you have a short, simple sales process with few touchpoints, last-click might be sufficient. If you have a complex B2B sale with multiple stakeholders and extended consideration periods, multi-touch attribution becomes essential for understanding true channel value. Many marketers use multiple models simultaneously—optimizing for last-click conversions while monitoring multi-touch data to ensure they're not neglecting important awareness channels.
Step 5: Identify Drop-Off Points and Journey Friction
Understanding successful customer journeys is valuable, but analyzing where prospects drop off is equally important. These friction points represent lost revenue and wasted ad spend—but they're also opportunities for optimization.
Start by analyzing where prospects exit the journey without converting. Look at customers who took one or two touchpoints but never progressed further. Did they click an ad but bounce immediately from the landing page? Did they visit your pricing page but never request a demo? Did they start a trial but never activate key features? Each drop-off point indicates a breakdown in your funnel.
Compare journey completion rates across different entry channels. You might discover that customers who enter through paid social ads have a 15% conversion rate, while those who enter through paid search convert at 25%. That gap suggests either targeting issues (social ads attracting less qualified traffic) or messaging misalignment (the ad promises something the landing page doesn't deliver). Knowing how to analyze multi-channel ad performance helps identify these discrepancies.
Dig deeper into the characteristics of drop-off traffic. Are certain ad types or targeting parameters attracting people who never convert? If you're running both interest-based targeting and lookalike audiences, do they show different completion rates? If you're testing multiple ad creatives, do some consistently bring in traffic that bounces while others drive engaged visitors who progress through the funnel?
Look for patterns in timing. Do prospects who engage with your brand over multiple sessions convert at higher rates than those who try to make a decision in one visit? Are there specific time intervals between touchpoints that correlate with higher conversion probability? Understanding these patterns helps you optimize remarketing timing and frequency.
Examine the relationship between journey length and conversion quality. Sometimes shorter journeys indicate high intent and convert at high rates. Other times, they represent impulse clicks from unqualified traffic that churns quickly. Meanwhile, longer journeys with more touchpoints might have lower conversion rates but produce higher-value customers with better retention. Quality matters as much as quantity—which is why customer lifetime value analysis should inform your optimization decisions.
Use drop-off insights to refine targeting and messaging. If you're seeing high drop-off rates after the first touchpoint, your ad creative might be attracting the wrong audience or setting unrealistic expectations. If prospects engage with multiple touchpoints but drop off before converting, you might have friction in your conversion process—complicated forms, unclear pricing, missing information, or inadequate trust signals.
Test specific improvements at identified friction points. If pricing page visitors aren't converting, try adding customer testimonials, clarifying value propositions, or simplifying pricing tiers. If trial users aren't activating, improve onboarding sequences and feature education. Measure whether these changes reduce drop-off rates and increase journey completion.
Step 6: Turn Journey Insights Into Budget Optimization Decisions
Journey analysis only creates value if you act on what you learn. The final step is translating insights into concrete budget allocation decisions that improve marketing efficiency and drive better results.
Start by reallocating spend toward channels that consistently appear in converting journeys. If your multi-touch attribution analysis reveals that paid social ads frequently serve as the first touchpoint for high-value customers, but you've been underinvesting in social because it doesn't show strong last-click conversions, it's time to adjust. Increase budget for channels that play important roles in customer journeys, even if they don't get credit in last-click models.
Scale campaigns that effectively move customers through the funnel. You're not just looking for channels that drive conversions—you're looking for channels that advance prospects from awareness to consideration to decision. A campaign that generates qualified leads who later convert through other channels is valuable even if it doesn't show direct conversions. Focus on the full journey contribution, not just the final click. This approach helps reduce customer acquisition cost over time.
Feed better conversion data back to ad platforms to improve their optimization algorithms. Modern ad platforms like Meta and Google use machine learning to identify and target high-converting audiences. But they can only optimize based on the conversion data you send them. If you're only tracking final purchases, the algorithm doesn't learn which types of people engage with your content, request demos, or show other high-intent behaviors.
By sending micro-conversion events back to ad platforms—pricing page views, content downloads, video watches—you give their algorithms more signals to work with. This helps them identify valuable prospects earlier in the journey and optimize delivery toward people likely to engage deeply with your brand, not just those likely to click. Discover how ad tracking tools can help you scale ads with this enhanced data feedback loop.
Establish a regular review cadence to continuously refine based on journey analysis. Customer behavior evolves, new competitors enter the market, platform algorithms change, and your own marketing mix shifts over time. What worked three months ago might not work today. Schedule monthly or quarterly deep dives into customer journey data to identify emerging patterns, spot degrading performance in specific channels, and catch new opportunities early.
Create feedback loops between journey analysis and campaign execution. When you launch new campaigns, monitor not just immediate conversion metrics but also how they affect overall customer journeys. Are new ad creatives attracting higher-quality traffic that progresses further through the funnel? Are changes to landing pages improving journey completion rates? Connect execution decisions directly to journey outcomes.
Document what you learn so insights compound over time. Build a knowledge base of journey patterns, successful channel combinations, optimal touchpoint sequences, and conversion path characteristics for different customer segments. This institutional knowledge helps new team members understand what works, prevents repeated testing of failed approaches, and creates a foundation for increasingly sophisticated optimization.
Your Roadmap to Data-Driven Marketing Decisions
Analyzing customer journeys effectively transforms marketing from educated guessing into a data-driven discipline. You move from asking "Which channel drove this conversion?" to understanding "How do all my channels work together to create conversions?"
Here's your quick implementation checklist: Connect all data sources with server-side tracking to capture complete journey visibility. Define and track meaningful conversion events and micro-conversions that signal progress toward purchase. Map the common paths your highest-value customers take before converting. Compare attribution models to understand true channel contribution beyond last-click metrics. Identify and fix friction points where prospects drop off without converting. Optimize budget allocation based on what the journey data reveals about channel effectiveness.
The marketers who master customer journey analysis don't just report on performance—they actively shape it. They know which channels generate awareness, which nurture consideration, and which close deals. They understand how channels work synergistically rather than in isolation. They spot problems early and opportunities faster than competitors still relying on surface-level metrics.
Start with one campaign or channel. Apply this framework to understand how it contributes to customer journeys. Document what you learn. Then expand to additional channels and more complex journey analysis. As your understanding deepens, your optimization decisions become more confident and your marketing efficiency improves.
The customer journey data is already there—you just need the right system to capture it, connect it, and turn it into actionable insights. Ready to elevate your marketing game with precision and confidence? Discover how Cometly's AI-driven recommendations can transform your ad strategy—Get your free demo today and start capturing every touchpoint to maximize your conversions.