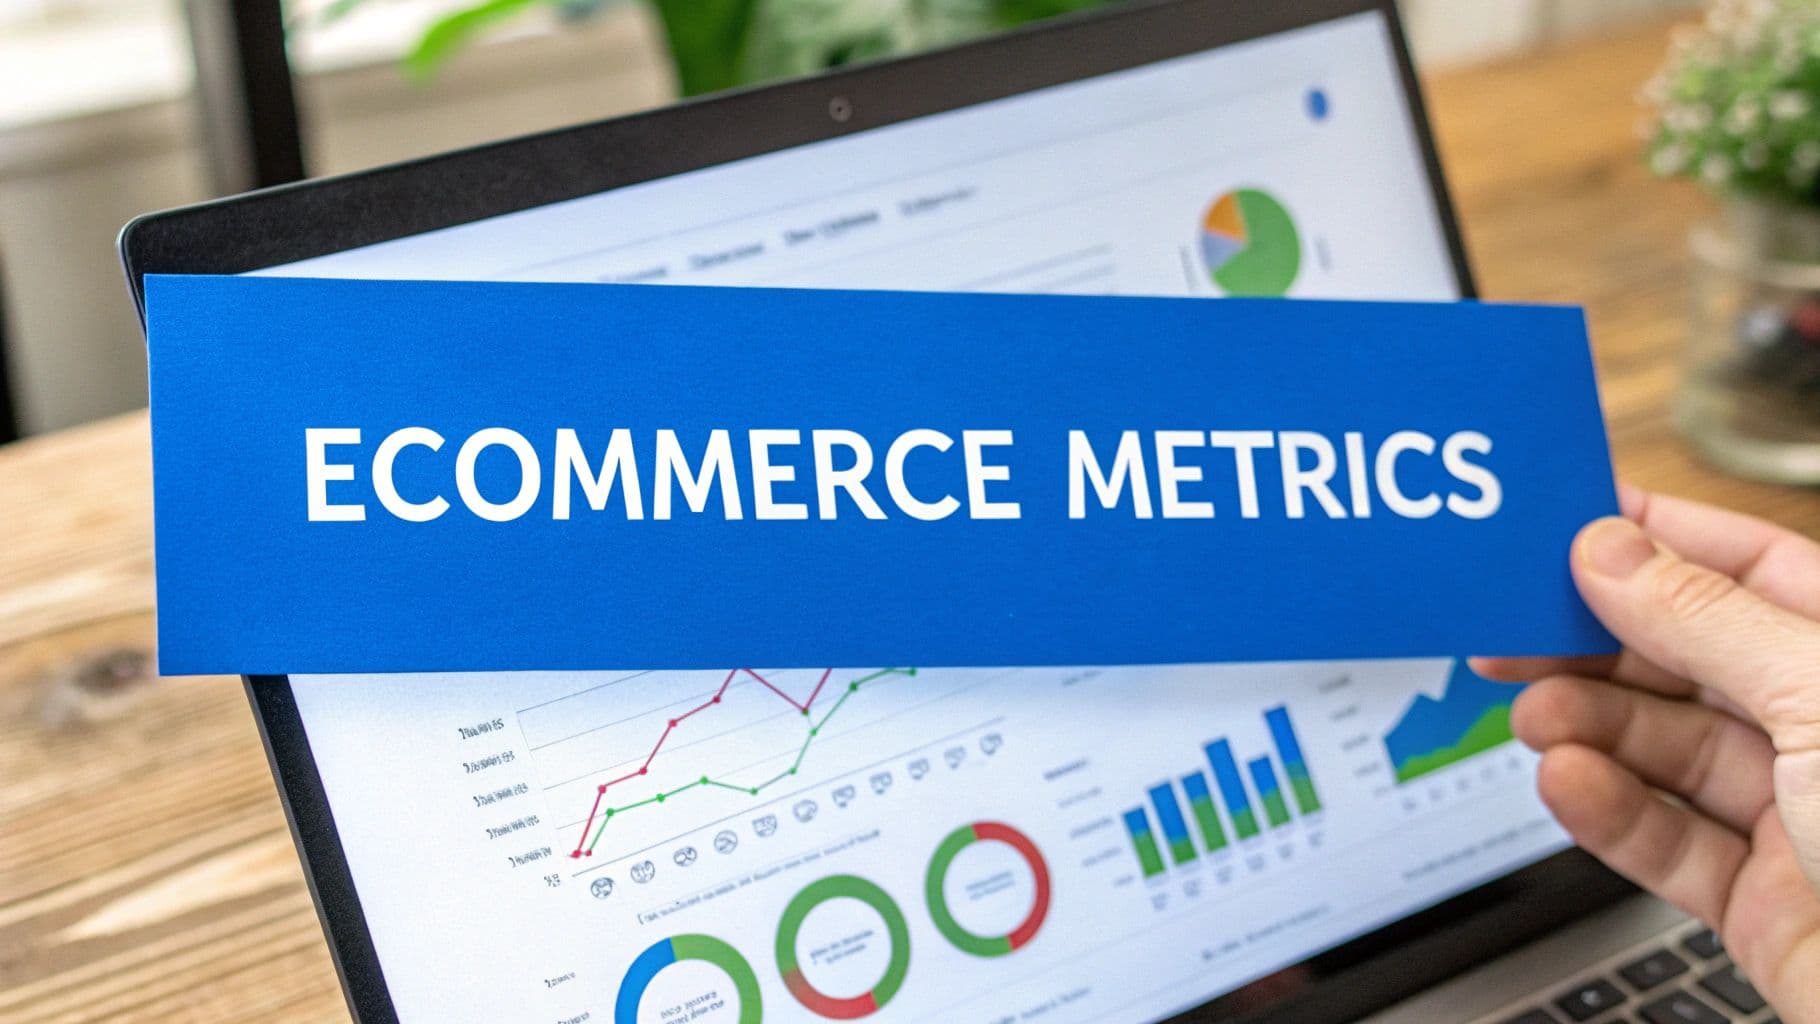
E-commerce performance metrics are the vital signs of your online store. They measure everything from how much it costs to land a new customer to the total value they bring to your business over time. If you want to build a healthy, profitable, and scalable brand, you have to know your numbers.
Your Dashboard for Profitable Growth
Trying to grow an e-commerce business without tracking performance metrics is like flying a plane blindfolded. You might feel like you're moving forward, but you have no idea if you're heading toward a mountain or open sky. These metrics are your instruments—they give you the hard data you need to make smart, profitable decisions instead of just guessing.
Understanding this data goes way beyond just celebrating high sales numbers. It’s about diagnosing the health of your entire operation. A ton of website traffic means nothing if your conversion rate is abysmal. A low customer acquisition cost (CAC) is a hollow victory if those customers buy once and never come back.
Real, sustainable success is all about the balance and interplay between your key performance indicators (KPIs).
The Core Metrics Ecosystem
The most important metrics don't exist in a vacuum. Think of them as an interconnected ecosystem where each one directly influences the others, creating a cause-and-effect chain that ultimately determines your profitability.
It boils down to a few core ideas:
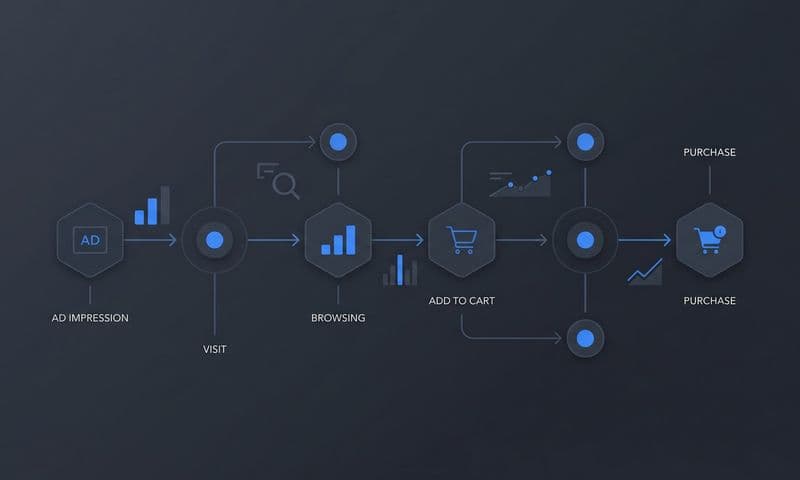
- Customer Acquisition Cost (CAC): This is what you pay to get a new customer in the door. It's the cost of your growth engine.
- Average Order Value (AOV): This is the initial fuel for that engine—how much each customer spends in a single purchase.
- Customer Lifetime Value (CLV): This is the total power your engine produces over its lifetime, representing the total revenue you'll get from a single customer.
This simple concept map shows how the journey from acquiring a customer to nurturing their long-term value all fits together.
 Mastering E Commerce Performance Metrics for Sustainable Growth
As you can see, a profitable business model is one where your CLV is significantly higher than your CAC. By focusing on strategies that increase both AOV and repeat purchases, you directly boost your CLV. This makes every dollar you spend on acquisition more efficient and your growth more sustainable.
You can learn more about how these pieces fit together by building a comprehensive marketing KPI dashboard.
The goal is to build a business where the cost to acquire a customer is paid back multiple times over their relationship with your brand. This simple principle separates businesses that merely survive from those that thrive and scale.
To help you get started, here's a quick look at the most essential metrics that every e-commerce business should have on its radar. This table breaks down the key categories and explains what each metric measures, giving you a solid foundation for building your own performance dashboard.
Key E Commerce Performance Metrics at a Glance
Metric Category | Key Metrics | What It Measures |
|---|---|---|
Revenue & Profitability | Revenue, Gross Profit, Net Profit | The overall financial health and long-term sustainability of the business. |
Customer Value | Average Order Value (AOV), Customer Lifetime Value (CLV) | How much revenue each customer generates per transaction and across their entire relationship with the business. |
Acquisition Efficiency | Customer Acquisition Cost (CAC), LTV:CAC Ratio | The cost-effectiveness of acquiring new customers relative to the value they generate over time. |
Marketing Performance | Return on Ad Spend (ROAS), Conversion Rate | The efficiency of advertising campaigns and how well the website converts visitors into customers. |
Customer Loyalty | Customer Retention Rate, Churn Rate | The ability to retain existing customers and minimize customer loss over time. |
This table provides a high-level overview, but the real power comes from digging into each of these numbers, understanding how they connect, and using them to guide your strategy.
Decoding Your Acquisition and Revenue Engine
Beyond the simple thrill of seeing total sales climb, the real story of your e-commerce success is written in the metrics that connect your marketing spend to your revenue. This is where we decode the engine of your business, looking at how efficiently you attract customers and how much value each one brings.
Getting these numbers right is the difference between blindly throwing money at ads and strategically investing in profitable growth.
 Mastering E Commerce Performance Metrics for Sustainable Growth
Many brands get obsessed with driving down their Cost Per Acquisition (CPA), thinking a lower number always means they're winning. While efficiency is great, a low CPA can be a siren's song. If you're paying pennies to acquire customers who only make tiny, one-time purchases, you might be winning the battle but losing the war on profitability.
The key is to look at acquisition costs in relation to the revenue they generate. That means shifting your focus to metrics that paint a much richer, more complete picture of your performance.
Going Beyond the First Purchase with Average Order Value
One of the fastest ways to improve profitability without spending a dime more on ads is by focusing on Average Order Value (AOV). This metric tells you, on average, how much a customer spends in a single transaction. A higher AOV means every conversion is more valuable, which directly juices the return on your acquisition efforts.
Think of it like a coffee shop. Selling a single $4 coffee is fine. But convincing that same customer to add a $3 pastry increases the AOV by 75%. The cost to get them in the door was the same, but the outcome was far more profitable.
Here are a few proven ways to bump up your AOV:
- Product Bundling: Group related products together for a slightly better price. This encourages customers to buy a complete set instead of just one item.
- Upselling and Cross-selling: Offer a premium version of a product (an upsell) or complementary items (a cross-sell) right at checkout.
- Free Shipping Thresholds: Motivate customers to add more to their cart to hit that free shipping sweet spot. This tactic alone can lift AOV by as much as 30%.
By strategically increasing your AOV, you make every dollar you spend on advertising work that much harder, turning marginal campaigns into home runs.
Understanding Your True Marketing ROI with ROAS
While AOV zeroes in on the value of a single transaction, Return on Ad Spend (ROAS) measures the raw effectiveness of your advertising campaigns. It answers a simple but vital question: for every dollar I put into ads, how many dollars do I get back?
The formula is straightforward:
ROAS = Total Revenue from Ad Campaign / Total Cost of Ad Campaign
A ROAS of 4:1 means you’re generating $4 in revenue for every $1 you spend. It's a fundamental scoreboard for campaign profitability. But there's a catch—its accuracy depends entirely on how you attribute sales to your marketing channels.
This is where most businesses get it wrong. As the global e-commerce market barrels toward a staggering $6.86 trillion in sales, the customer journey is getting messier. Mobile commerce is set to claim $2.51 trillion of that, yet conversion rates tell a tricky story: desktops convert at 4.8% versus mobile's 2.9%. This is a huge challenge, with mobile cart abandonment rates hitting 77.2% compared to 71.3% overall. For brands, accurately tracking revenue across every device is non-negotiable if they want to optimize spend and capture this growth.
The Pitfalls of Last-Click Attribution
By default, most ad platforms use a "last-click" attribution model. This means they give 100% of the credit for a sale to the very last ad a customer clicked before buying.
Imagine a customer journey like this:
- They see a Facebook ad and become aware of your brand.
- A week later, they watch a YouTube review of your product.
- Finally, they search for your brand on Google and click a search ad to make a purchase.
With last-click attribution, Google Ads gets all the glory. Your ROAS for Facebook and YouTube would look terrible. You might conclude those channels are duds and cut their budgets, unknowingly shutting down the very platforms that introduced customers to your brand in the first place.
This flawed model creates massive blind spots, hiding the true value of your top-of-funnel marketing. To get an accurate ROAS, you need a multi-touch attribution system that gives credit where credit is due across the entire customer journey. This is precisely what tools like Cometly are built for—giving you a clear, unbiased view of what’s actually driving your revenue.
You can dive deeper into this in our detailed guide on how to calculate Return on Ad Spend accurately.
Measuring Long-Term Customer Value and Loyalty
Getting a new customer is an investment. But the real, sustainable profit in e-commerce doesn't come from that first sale—it comes from keeping them around. While acquisition metrics tell you how fast you're growing your customer base, loyalty metrics reveal if that growth is actually profitable for the long haul. This is the critical shift from thinking about single transactions to understanding the entire customer relationship.
Think of your business like a bucket you're trying to fill with water (your customers). Acquisition is the faucet pouring water in. But if that bucket is riddled with holes, you’ll have to keep the faucet on full blast just to stay level. Loyalty and retention metrics are all about plugging those holes.
Calculating Customer Lifetime Value
The cornerstone of long-term thinking is Customer Lifetime Value (CLV or LTV). This metric predicts the total revenue your business can expect from a single customer throughout their entire relationship with you. It looks beyond the initial purchase to capture the full picture of what a customer is truly worth.
Calculating a precise CLV can get pretty complex, but a simple and powerful formula to get you started is:
CLV = Average Order Value (AOV) x Average Purchase Frequency x Average Customer Lifespan
For example, if your average customer spends $100 per order (AOV), buys 3 times a year, and sticks with your brand for 2 years, their CLV is $100 x 3 x 2 = $600. This one number is a game-changer for your strategy. It tells you exactly how much you can afford to spend to acquire a similar customer and still turn a profit.
For a deeper dive into this crucial metric, check out our comprehensive guide on Customer Lifetime Value analysis.
The Ultimate Health Indicator: The LTV to CAC Ratio
Knowing your CLV is powerful, but pairing it with your Customer Acquisition Cost (CAC) is where the magic really happens. The LTV:CAC ratio is arguably the single most important health indicator for any e-commerce business. It directly compares how much a customer is worth to you over time versus what it cost to get them in the door.
- An LTV:CAC ratio of 1:1 means you're just breaking even on each customer. That leaves no room for operational costs or profit. This is a danger zone.
- An LTV:CAC ratio below 1:1 means you're actively losing money on every new customer you bring in. Your business model simply isn't sustainable.
- An LTV:CAC ratio of 3:1 or higher is widely considered the gold standard. It’s a sign of a healthy, profitable, and scalable business.
A strong ratio tells you that your marketing is efficient, your product is a hit, and your customers are sticking around. It’s the ultimate proof that your growth engine isn't just running—it's running profitably.
Plugging the Leaks with Churn and Retention Rates
To improve that LTV:CAC ratio, you have to keep customers coming back for more. This is where you measure the holes in your bucket using two key metrics: churn rate and retention rate.
Customer Churn Rate is the percentage of customers who stop buying from you over a specific period. Think of it as a direct measure of how many customers you’re losing. A high churn rate forces you into a constant, expensive cycle of acquiring new customers just to replace the ones who are walking away.
On the flip side, Customer Retention Rate measures the percentage of customers who stay with you over time. Boosting this number is one of the most effective ways to drive profitability. Studies consistently show that increasing customer retention by just 5% can increase profits by anywhere from 25% to 95%.
By focusing on the customer experience, loyalty programs, and excellent service, you directly lower churn and increase retention. This makes every customer more valuable and strengthens the very foundation of your business.
Uncovering Your Best Customers with Cohort Analysis
So, how do you figure out which marketing efforts bring in the most loyal, high-value customers? The answer is cohort analysis. A cohort is just a group of users who share a common characteristic—most often, the month they made their first purchase.
Instead of looking at all your customers as one massive, faceless group, cohort analysis lets you track the behavior of specific segments over time. For example, you could compare the LTV of customers acquired from a Facebook campaign in January versus those who came from a Google Ads campaign in the same month.
This level of analysis delivers incredible insights:
- Identify Your Most Valuable Channels: Discover which acquisition channels consistently deliver customers with the highest LTV, not just the lowest initial CAC.
- Pinpoint Retention Issues: See if customers from a certain period are churning faster than others, which might point to a problem with a product batch or a flawed marketing message.
- Measure the Impact of Changes: Test how new features or loyalty programs affect the long-term behavior of new customer cohorts.
By using cohort analysis, you move from making broad assumptions to drawing specific, data-backed conclusions about what truly drives long-term customer loyalty and value.
Optimizing Your Funnel for Maximum Conversions
Getting traffic to your site is just the starting line. The real race is turning those visitors into paying customers, because that’s what actually builds a profitable e-commerce business.
While high-level metrics like revenue and loyalty tell you if the business is healthy, conversion metrics are your diagnostic tools. They drill down into the nitty-gritty of your sales funnel, pinpointing exactly where friction is causing potential customers to bail.
By really getting a handle on these metrics, you can make data-driven tweaks to your site and checkout that squeeze more sales out of the traffic you already have.
The All-Important Conversion Rate
First up is the most fundamental metric of all: your overall Conversion Rate (CVR). This is simply the percentage of your website visitors who end up making a purchase. Think of it as the ultimate report card for your site’s ability to persuade and sell.
The formula couldn't be simpler:
Conversion Rate (CVR) = (Total Number of Sales / Total Number of Website Visitors) x 100
Everyone wants to know, "What's a good conversion rate?" The honest answer? It depends. Benchmarks swing wildly depending on the industry, traffic source, and even the device someone is using.
On average, e-commerce conversion rates tend to hover between 2% and 4%. But the top 20% of stores are hitting 3.5% to 5% or even higher. Digging into the data, you’ll see huge differences: personal care often leads the pack at 6.8%, while industries like retail fashion (1.9%) and home decor (1.4%) lag behind.
Breaking Down the Customer Journey with Micro-Conversions
A customer rarely lands on your site and buys instantly. They take a series of smaller steps—or micro-conversions—that eventually lead to the final purchase. Tracking these smaller actions is absolutely critical for figuring out where your funnel is leaking.
Imagine your sales process as a series of gates. If a huge crowd of people gets stuck at one particular gate, you know exactly where to focus your energy.
Here are the key micro-conversions you should be watching:
- Add-to-Cart Rate: What percentage of visitors add at least one item to their cart? A low number here could mean your product pages aren't compelling, your pricing is off, or your calls-to-action are weak.
- Checkout Initiation Rate: Of all the people who added something to their cart, how many actually started the checkout process? If you see a big drop-off here, your cart page might be confusing or missing trust signals.
- Checkout Completion Rate: Finally, of those who begin the checkout, what percentage actually finish it? This metric helps you zero in on problems with the final payment and shipping steps.
This screenshot from Cometly shows how a unified dashboard helps you see that entire journey in one place, from the first ad click all the way to the final sale.
 Mastering E Commerce Performance Metrics for Sustainable Growth
By tracking each of these steps, you get a much richer story than a single, flat conversion rate could ever tell you.
Tackling the Billion-Dollar Problem of Cart Abandonment
The single biggest leak in nearly every e-commerce funnel is the Cart Abandonment Rate. This metric tracks the percentage of shoppers who add items to their cart but leave without buying anything.
The numbers are genuinely staggering. On average, over 70% of all online shopping carts are abandoned. On mobile devices, that number can soar past 77%.
Cart abandonment represents a massive pool of high-intent customers who were one step away from giving you money. Understanding why they leave is one of the most profitable activities you can undertake.
So, why do they leave? The reasons are surprisingly consistent:
- Unexpected Costs: Surprise shipping fees, taxes, and other last-minute charges are the #1 conversion killer.
- Forced Account Creation: Making someone create an account just to buy something adds way too much friction.
- Complex Checkout Process: If your checkout page is long, confusing, or just looks untrustworthy, people will run for the hills.
Once you know why people are leaving, you can start implementing targeted fixes. Our guide on building a high-impact conversion optimization strategy walks through actionable steps to plug these common leaks. For more ideas, you might also find some great insights in these 10 proven e-commerce conversion rate optimization tips.
Ultimately, optimizing your funnel is all about making the path to purchase as smooth and transparent as possible. By meticulously tracking these conversion-focused metrics, you can systematically remove friction, build trust, and turn more of your browsers into loyal customers.
Building a Unified E-Commerce Metrics Dashboard
Knowing your metrics is a great first step, but isolated numbers are just noise. The real power comes from unifying them into a single, cohesive dashboard that tells a clear story about your business. This is where you bridge the gap between theory and profitable action.
Too many brands operate in data silos. Their Shopify store tells one story, their payment processor another, and their ad platforms each paint a completely different picture. This fragmentation makes it impossible to see what's truly driving growth, leading to wasted ad spend and missed opportunities.
The solution is to build a unified dashboard that acts as your single source of truth, pulling data from every corner of your business into one place. This allows you to track high-level metrics like your LTV:CAC ratio right alongside granular data like channel-specific ROAS.
 Mastering E Commerce Performance Metrics for Sustainable Growth
From Disjointed Data to a Single Source of Truth
Imagine trying to assemble a puzzle where the pieces come from three different boxes. It's confusing, frustrating, and you'll never see the full image. That's what relying on the native analytics of individual platforms is like.
Your first objective is to centralize your data. This means connecting all those disparate sources to create one unified view of the customer journey, from their very first interaction with your brand to their most recent purchase.
A modern measurement strategy requires integrating:
- Storefront Data: Information from platforms like Shopify or WooCommerce on sales, products, and customer orders.
- Ad Platform Data: Spend and performance metrics from sources like Facebook Ads, Google Ads, and TikTok Ads.
- Payment Processor Data: Transaction details from Stripe or PayPal that confirm actual revenue collected.
By bringing these streams together, you can finally move beyond the flawed, biased reporting within ad platforms and start making decisions based on reality.
A unified dashboard isn't just a reporting tool; it's a strategic asset. It transforms raw data into actionable intelligence, enabling you to allocate your budget with precision and confidence.
The Power of Multi-Touch Attribution
One of the biggest wins from a unified dashboard is the ability to implement a sophisticated multi-touch attribution model. As we've discussed, last-click attribution—the default for most ad platforms—is dangerously misleading. It gives 100% of the credit to the final touchpoint, ignoring all the other marketing efforts that influenced the customer along the way.
Multi-touch attribution, by contrast, analyzes the entire customer path. It assigns partial credit to each touchpoint, providing a far more accurate picture of how your marketing channels work together to drive sales.
For example, a customer might:
- Discover your brand through a TikTok video.
- Get retargeted with a Facebook ad a few days later.
- Receive a promotional email a week after that.
- Finally, make a purchase after clicking a Google Search ad.
A multi-touch model recognizes that TikTok, Facebook, and your email campaign all played a vital role. This insight is critical for understanding the true ROI of your marketing mix. For a deeper understanding, explore our guide on the best e-commerce analytics tools that can help you implement this.
Putting It All Together: A Practical Example
Let's see how this unified view translates into smarter decisions. Imagine you're spending $5,000 per month on both Facebook Ads and Google Ads.
- Your Facebook Ads Manager shows a 2x ROAS, suggesting it's underperforming.
- Your Google Ads Dashboard shows a 5x ROAS, making it look like a clear winner.
Based on this siloed data, the obvious move is to shift your budget from Facebook to Google. But a unified dashboard with multi-touch attribution tells a different story.
It reveals that 80% of customers who convert through Google Ads first discovered your brand on Facebook. Facebook is your workhorse for generating initial interest, while Google is closing the deal.
By cutting your Facebook budget, you would have inadvertently starved your Google campaigns of qualified leads, causing your overall sales to plummet. The unified view prevents this catastrophic mistake. It shows you that both channels are essential and provides the data needed to optimize them in harmony, not in isolation. This holistic understanding of your e-commerce performance metrics is the key to unlocking scalable, profitable growth.
Answering Your E-Commerce Metrics Questions
Once you get a handle on the core e-commerce metrics, the real questions start popping up. What should I actually focus on? How often should I check this stuff? And why do my numbers never match across different platforms?
It's one thing to know the definitions, but it's another to apply them in the real world. Let's tackle the practical, everyday questions that trip up marketers and founders, moving from theory to action.
What Is the Most Important E Commerce Metric to Track
If you had to pick just one, the LTV:CAC ratio is the undisputed king of sustainable growth. It cuts through the noise and answers the single most important question for any business: are we acquiring customers profitably over the long run?
While metrics like conversion rate or CPA are crucial for day-to-day tactics, LTV:CAC reveals the fundamental health of your entire business model. It tells you if you have a real, scalable operation.
A healthy ratio, ideally 3:1 or higher, is a powerful signal that your business engine is running smoothly. Anything less, and you might be burning cash to acquire customers who will never pay you back.
How Often Should I Review My Performance Metrics
Not all metrics deserve your daily attention. The trick is to separate them into two buckets: the numbers that guide your daily tactics and the ones that inform your long-term strategy.
- Leading Indicators: These are your real-time pulse checks. Think ROAS, CPA, and Conversion Rate. When you're running active ad campaigns, you should be looking at these daily, or at the very least, a few times a week. They tell you what's happening right now.
- Lagging Indicators: These metrics paint the bigger picture over time. Customer Lifetime Value (CLV) and Churn Rate fit in here. Checking them monthly or quarterly gives you a stable, meaningful view of long-term trends without getting distracted by daily noise.
A real-time dashboard is your best friend here. It lets you keep an eye on everything without getting bogged down in pulling manual reports.
The biggest mistake is treating all metrics with the same urgency. Daily fluctuations in LTV are meaningless noise, while a sudden drop in ROAS requires immediate attention. Match your review frequency to the metric's strategic importance.
Why Do My Ad Platforms and Analytics Tools Show Different Numbers
Welcome to the most common headache in e-commerce: data discrepancy. You're not crazy—your numbers really don't match, and there’s a simple reason why. Every platform wants to take credit for the sale, and they all play by their own set of rules.
This conflict comes down to a few key issues:
- Different Attribution Models: Facebook might use a 7-day click model, giving itself credit if a user bought within a week of clicking an ad. Meanwhile, Google Analytics often defaults to a last-click model, giving all the credit to the very last touchpoint. They're not even measuring the same thing.
- Cross-Device Tracking Issues: Someone sees your ad on their phone during their commute but makes the purchase later on their desktop at home. Many platforms can't connect those two events, breaking the attribution chain.
- Privacy Updates: The crackdown on tracking, especially from Apple's iOS updates, has punched huge holes in the pixel-based tracking that ad platforms rely on. This creates massive data gaps.
The only way out of this mess is to use an independent attribution platform. By using its own reliable tracking and a single, unified data model, it becomes the ultimate source of truth, showing you which channels actually drove the sale, not just which one wants the credit.
Stop guessing which ads are working. Cometly provides a single source of truth for your ad attribution, unifying data from all your platforms to reveal your true ROAS and LTV. Get the clarity you need to scale profitably. Discover how Cometly can transform your marketing analytics.