A solid SaaS customer lifetime value calculation isn't just a number—it's a prediction of the total revenue you can realistically expect from an average customer throughout their entire journey with your company. This is a forward-looking metric that helps you see beyond this month's revenue and understand the long-term health and sustainability of your business.
What SaaS Customer Lifetime Value Actually Means
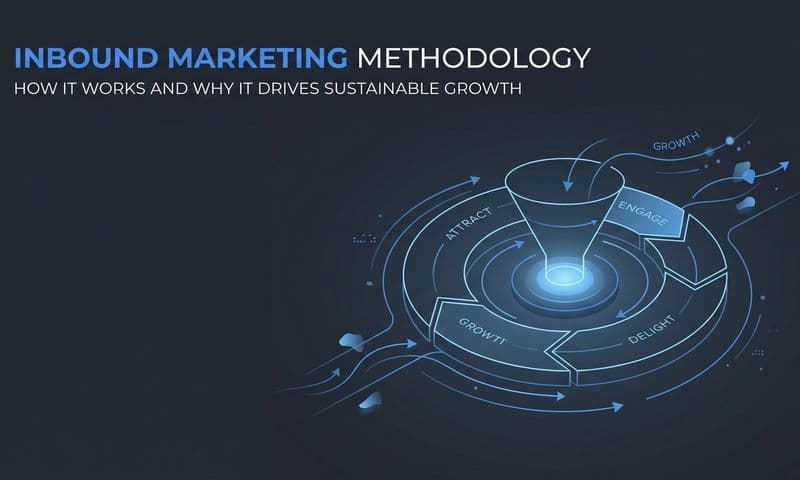
 SaaS Customer Lifetime Value Calculation Made Simple
Before we start crunching numbers, it’s important to get what Customer Lifetime Value (LTV) really represents for a SaaS business. I always tell founders to think of LTV less as just another KPI on a dashboard and more as a strategic compass. It should be guiding your biggest decisions, from how much you spend on marketing to which features you build next.
At its heart, LTV is the ultimate stress test of your business model's viability. A high LTV is a clear signal that you’ve built a sticky product that customers genuinely value. That’s the foundation of sustainable growth.
This single metric answers one of the most fundamental questions you can ask: "How much is one customer really worth to us over time?" Answering that shifts your entire company's focus from chasing short-term wins (like getting new sign-ups at any cost) to cultivating long-term, profitable relationships.
When you have a firm grasp of what a customer is worth, you can finally make smart, data-driven decisions about how much you can afford to spend to get them in the door. This brings us to the all-important LTV to CAC ratio, which is one of the first things investors look at to gauge the health of a SaaS company.
The Core Components of LTV
To really understand LTV, you have to know what goes into it. Think of them as the building blocks that, when combined, tell the complete story of your customer relationships. The calculation itself is pretty straightforward, but the power comes from understanding each piece.
Here's a quick look at the core metrics you'll be working with. Understanding these components is the first step to getting a clear, actionable LTV number.
Core Components of SaaS LTV Calculation
Metric | What It Measures | Why It's Important |
|---|---|---|
Average Revenue Per Account (ARPA) | The average revenue you bring in from each customer account, usually calculated monthly or annually. | It establishes the baseline value for a single customer during a specific period. |
Customer Churn Rate | The percentage of customers who cancel their subscriptions within a given timeframe (e.g., a month). | Churn directly erodes LTV. A lower churn rate means customers stay longer, dramatically increasing their lifetime value. |
Gross Margin Percentage | The portion of revenue left after subtracting the cost of goods sold (COGS), like hosting and support costs. | This ensures you're calculating profitable LTV, not just revenue. It reflects your operational efficiency. |
Putting these metrics together gives you a much more nuanced picture than just looking at revenue. It’s a single number that reflects customer loyalty, the effectiveness of your pricing, and your operational efficiency all at once.
Pro Tip: Don't stop at a single, company-wide LTV. True insight comes from segmentation.
For example, a deep dive into customer cohort analysis can show you how LTV differs for customers who signed up in January versus June, or those on your "Pro" plan versus your "Enterprise" plan. These granular insights are where the real strategic magic happens.
Gathering Your Essential LTV Metrics
A solid LTV calculation is only as good as the data you feed it. Before you can plug anything into a formula, you've got to wrangle three core metrics. The good news? You’re probably already tracking this stuff. It's just a matter of knowing where to look and pulling it all together.
To make this real, let's follow a hypothetical B2B SaaS company that sells project management software. We'll walk through finding their numbers to get their LTV journey started.
Finding Your Average Revenue Per Account (ARPA)
First up is your Average Revenue Per Account, or ARPA. This tells you what a single customer is worth to you in a typical month. It's not just the sticker price of their subscription; ARPA should include everything—base plans, add-ons, usage fees, you name it.
Your billing platform is your best friend here. If you're using something like Stripe or Chargebee, you can usually pull ARPA (or its close cousin, ARPU) right from your reporting dashboard.
But doing it manually is simple, too. Just take your Total Monthly Recurring Revenue (MRR) and divide it by your Total Number of Active Customers.
Let's say our project management SaaS has an MRR of $50,000 and 500 customers. Their monthly ARPA is $100. Easy.
Locating Your Customer Churn Rate
Next, you need to face the music: your Customer Churn Rate. This is the percentage of customers who say goodbye and cancel their subscriptions in a given month. I can't stress this enough—high churn is the silent killer of LTV. Getting a handle on this number is non-negotiable.
Your CRM or analytics platform is the place to look. Most will calculate this for you automatically. If you need to do it by hand, the formula is straightforward: divide the Number of Customers Who Canceled in a period by the Number of Customers you had at the Start of that period.
So, if our example company started the month with 500 customers but lost 15, their monthly churn rate is (15 / 500), which comes out to 3%.
Calculating Gross Margin Percentage
Finally, you need your Gross Margin Percentage. This is a critical step that many people skip, but it ensures your LTV calculation is grounded in profit, not just revenue. It strips out the direct costs of actually serving your customers, often called the Cost of Goods Sold (COGS).
Your SaaS COGS typically includes expenses like server hosting, third-party software licenses (e.g., for customer support chat), and salaries for your customer success or support teams.
To get this number, subtract your COGS from your total revenue, then divide that by your total revenue.
If our example company brings in $50,000 in MRR and spends $10,000 on COGS, their gross margin is a healthy 80%.
While these three metrics are the foundation for LTV, they're just a slice of the bigger pie. For a complete view of your company's health, they should be tracked alongside the other essential metrics every SaaS company should care about.
How to Perform Your First LTV Calculation
Alright, you've got your key metrics lined up. Now it's time to put them to work and actually calculate your SaaS customer lifetime value. It's not as intimidating as it sounds, but the formula you choose really depends on how precise you need to be.
Let's start with the basics and then layer in more detail for a truer picture.
The Back-of-the-Napkin LTV Calculation
The simplest LTV formula is perfect for a quick gut-check on your business's health. It gives you a high-level sense of customer value without getting bogged down in the nitty-gritty of profit margins.
The formula is:Average Revenue Per Account (ARPA) / Customer Churn Rate
Let's go back to our project management SaaS example:
- ARPA = $100
- Churn Rate = 3% (or 0.03)
So, the math is $100 / 0.03, which gives us $3,333.
This tells the company that, on average, they can expect to bring in about $3,333 in revenue from a customer before that customer leaves. It’s a useful starting point, but it has one major flaw: it treats every dollar of revenue as pure profit. We know that's never the case.
Adding Gross Margin for a Reality Check
To understand what a customer is really worth, you have to account for the costs of serving them. This is where Gross Margin enters the picture. Factoring it in gives you a far more realistic and actionable LTV that reflects actual profit, not just revenue.
The better formula is:(ARPA * Gross Margin %) / Customer Churn Rate
Using the numbers for our example company again, this time with their 80% Gross Margin:
- ARPA = $100
- Gross Margin = 80% (or 0.80)
- Churn Rate = 3% (or 0.03)
The new calculation is ($100 * 0.80) / 0.03, which works out to $2,667.
See the difference? By factoring in Gross Margin, the LTV drops from a lofty $3,333 to a more grounded $2,667. That $666 gap represents the direct cost of serving that customer over their lifetime. This is a critical detail for making smart financial decisions.
This is the number you should be using for real strategic planning, especially when you're figuring out your marketing budget and payback period. If you want to dive deeper, we have a whole guide on calculating payback period that shows how these metrics all tie together.
This infographic breaks down the essential metrics you'll need for this calculation.
 SaaS Customer Lifetime Value Calculation Made Simple
As you can see, all these metrics are interconnected—revenue, churn, and margin all flow together to give you the final LTV.
How to Handle Different Subscription Types
One question I get all the time is how to handle a mix of monthly and annual subscriptions. It’s a great question, because annual plans often have much lower churn and bring in more cash upfront, which can throw off a simple monthly LTV calculation.
You have a couple of options here:
- Segment Your LTV: Honestly, this is the best way to do it. Calculate LTV separately for your monthly customers and your annual customers. This gives you a crystal-clear view of the value each plan brings to the business.
- Normalize Your Data: A quicker, though less precise, method is to blend your data. You can convert annual contract values into their monthly equivalent (a $1,200 annual plan becomes $100 MRR) and then calculate a blended churn rate across all customers. This works for a high-level overview.
My advice? Always segment if you can. You might discover that your annual customers are 5x more valuable than your monthly ones. That's a powerful insight that could completely reshape your marketing and pricing strategy.
Making Sense of Your LTV with the LTV to CAC Ratio
Alright, you've calculated your SaaS customer lifetime value. That's a huge step. But seeing a number like $2,667—our figure from the previous example—doesn't tell you the whole story. Is that good? Bad? Honestly, on its own, it’s just a number floating in space.
To give that number real meaning, you have to compare it against what it costs you to land that customer in the first place. This is where the LTV to Customer Acquisition Cost (CAC) ratio becomes your best friend. I'd argue it's the single most important metric for gauging the health and scalability of any SaaS business. It’s the difference between just measuring value and actually understanding if your growth engine is sustainable.
What Is Customer Acquisition Cost, Anyway?
Before we get to the ratio, let's quickly break down the other half of the equation: Customer Acquisition Cost (CAC). In simple terms, your CAC is the total amount you spend on sales and marketing to bring in one new customer over a set period.
This isn't just about ad spend. It’s everything—the salaries for your sales and marketing teams, the cost of content creation, software subscriptions, you name it. For a really detailed breakdown, be sure to check out our complete guide on understanding customer acquisition cost for SaaS.
Let’s stick with our project management company example. Imagine they spent $10,000 on all sales and marketing activities last month and brought in 15 brand-new customers.
Their CAC calculation would be $10,000 / 15, which works out to $667 per customer.
Calculating and Reading the LTV to CAC Ratio
Now we have the two key pieces of the puzzle:
- LTV = $2,667
- CAC = $667
The formula is as straightforward as it gets: LTV divided by CAC.
For our example company, that’s $2,667 / $667, giving us an LTV:CAC ratio of 4:1. This tells them that for every dollar they invest to acquire a new customer, they can expect to see four dollars in gross profit back over that customer's lifetime.
This is the moment of truth. The LTV:CAC ratio tells you if your business model actually works. It answers the fundamental question: are you spending money to make more money, or are you just spinning your wheels?
So, what’s a good number to aim for? A healthy LTV:CAC ratio for a SaaS business is generally considered to be 3:1 or higher. This shows that the revenue you get from a customer is at least three times what you paid to get them.
Of course, benchmarks can shift depending on your industry. As some industry-specific SaaS ratio data from Eqvista shows, an Adtech company might hit a 7:1 ratio, while an industrial SaaS could be perfectly healthy at 3:1.
If your ratio dips below 3:1, it’s a red flag. You might be overspending on customer acquisition, putting your long-term profitability in jeopardy. On the flip side, an incredibly high ratio—say, 8:1 or more—might sound fantastic, but it could mean you're not investing aggressively enough in growth. You might be leaving a huge chunk of market share on the table for a competitor to snatch up.
For most SaaS companies, that 3:1 to 5:1 range is the sweet spot where sustainable, smart growth really happens.
Proven Strategies to Increase Your SaaS LTV
 SaaS Customer Lifetime Value Calculation Made Simple
Okay, you've done the math and you now have a solid handle on your SaaS customer lifetime value calculation. But knowing the number is just the starting point. The real magic happens when you start to actively improve it.
LTV isn't some fixed figure you just report on; it's a dynamic metric you can directly influence. Growing it is one of the most powerful levers you have for building a more profitable, sustainable business.
We're going to focus on three core areas that, in my experience, deliver the biggest impact: minimizing churn, generating more revenue from your existing customer base, and refining your pricing model.
Fortify Your Defenses by Reducing Churn
Customer churn is the arch-nemesis of a high LTV. Think of it as a leak in your revenue bucket. Every customer who cancels chips away at your company's long-term value.
So, the most direct way to boost LTV is simply to convince more customers to stick around for longer. This means shifting from a reactive "support" mindset to a proactive "customer success" culture. Don't wait for them to hit a wall.
- Nail your onboarding process: The first 90 days are absolutely critical. A well-designed, value-focused onboarding journey helps customers get that first "win" quickly. Once they see the value, they're far less likely to leave.
- Watch your product usage data: You need to identify accounts with dropping engagement levels. These are your at-risk customers. Often, a timely, helpful check-in from a customer success manager can make all the difference.
- Gather—and act on—feedback: Use surveys, calls, and in-app prompts to understand why customers are churning. Then, and this is the important part, close the loop. Show them you're listening by actually addressing their concerns.
Retention is the engine of sustainable SaaS growth. When a product becomes essential to a customer's daily work through seamless integrations and automation, you build incredible stickiness. That stickiness is what directly extends lifetime value.
Drive Growth with Expansion Revenue
I'll say it again: your existing customers are your most valuable asset. They're also your best and cheapest source of new revenue. Focusing on expansion revenue—any income generated after the initial sale—is far more cost-effective than grinding for new customers.
The goal here is to grow with your customers as their needs evolve.
A smart, tiered pricing structure is the classic way to do this. You want to design your plans so that as a customer's business grows (maybe they add more users, need more storage, or unlock advanced features), they naturally upgrade to a higher-tier plan. This creates a built-in escalator for your ARPA and, by extension, your LTV.
Another powerful tactic is offering valuable add-ons. This could be anything from premium support packages to API access or specialized feature modules that solve a specific, high-value problem for a segment of your users.
Optimize Your Pricing Strategy
Finally, don't be afraid to revisit your pricing. This is a big one. So many SaaS companies, especially in the early days, significantly underprice their products. Your pricing should reflect the true value you deliver, not just cover your costs.
Consider moving to a value-based pricing model. This just means tying your price directly to the metric that your customers care about most. If you're an email marketing platform, that might be the number of subscribers. For a video hosting service, it could be bandwidth.
This approach aligns your success with your customers' success. As they get more value from your product, you share in that upside.
By systematically addressing churn, expansion, and pricing, you can turn LTV from a passive health metric into an active growth driver. For a deeper look, check out our guide on maximizing LTV for SaaS growth for more actionable strategies.
Got Questions About Calculating SaaS LTV?
Alright, you’ve got the formulas, but putting them into practice often brings up a few head-scratchers. It's totally normal. Let's walk through some of the questions that almost always come up when teams start calculating customer lifetime value.
How Often Should I Be Running These Numbers?
For most SaaS companies, a monthly or quarterly rhythm is the way to go. Calculating LTV every month is fantastic for keeping a close pulse on your business. You can see how a price change or a new marketing push immediately affects your numbers.
Looking at it quarterly, however, gives you a more strategic, zoomed-out perspective. It smooths out any weird blips from a single bad (or unusually good) month, offering a truer picture of your company's health. Early-stage startups in heavy experimentation mode might even do it more often, but for established businesses, quarterly is usually solid.
So, What's a "Good" LTV, Really?
This is the classic "it depends" answer, but for a good reason. LTV is meaningless in a vacuum. The real question isn't "what's my LTV?" but "how does my LTV stack up against my Customer Acquisition Cost (CAC)?"
That’s where the LTV:CAC ratio comes in.
The gold standard for a healthy SaaS business is a ratio of 3:1 or better. In plain English, for every $1 you spend to get a new customer, you should expect to get at least $3 back from them over their lifetime.
An LTV of $500 is amazing if your CAC is $100 (a 5:1 ratio). But that same $500 LTV is a flashing red light if your CAC is $400 (a 1.25:1 ratio). It's all about the relationship between the two.
What If My Churn Rate Is All Over the Place?
Fluctuating churn can make your LTV calculation feel like you're trying to hit a moving target. If your churn rate jumps around from one month to the next, don't rely on a single month's data. You'll get a skewed result.
The fix is to use a rolling average of your churn rate. Look at the average over the last three, six, or even twelve months. This simple trick evens out the volatility and gives you a far more stable and reliable number to plug into your LTV formula.
For a more sophisticated analysis, you can also start calculating LTV for different customer cohorts to understand how churn and value differ between, say, customers who signed up in January versus those who joined in June.
Is LTV the Same as Company Valuation?
It’s an easy mistake to make, but they're fundamentally different concepts.
Customer LTV is a forward-looking metric that projects the gross profit you can expect from a single average customer. It's a powerful tool for gauging the profitability of your business model.
Company valuation, on the other hand, is an assessment of the total worth of your entire business right now. A strong LTV and a healthy LTV:CAC ratio absolutely contribute to a higher valuation—they're proof your business engine works. But they're just part of a much bigger picture that also includes total revenue, growth rate, market position, and more.
Juggling all the metrics needed for LTV and CAC can quickly turn into spreadsheet chaos. Cometly pulls all your marketing data into one place, so you can finally get a clear, unified view of attribution and profitability. Stop guessing and start knowing exactly what you're spending to acquire customers and what they're truly worth. Check out how it works at https://www.cometly.com.