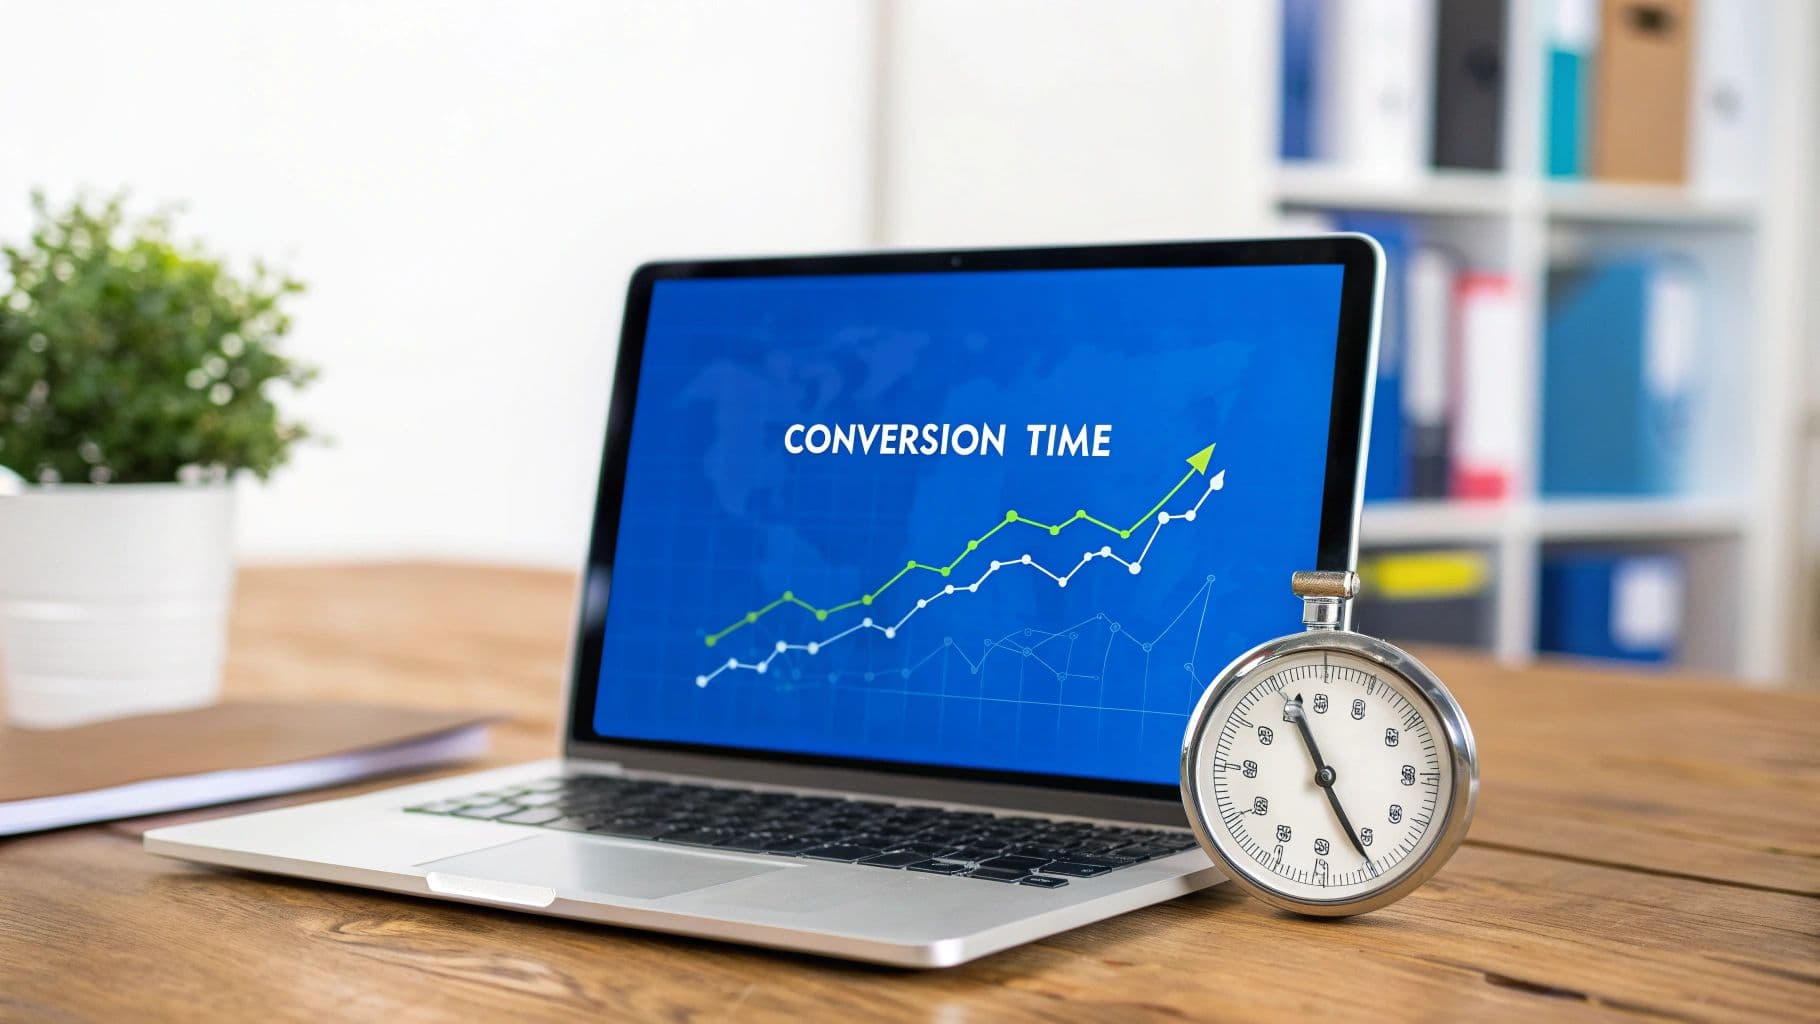
When you hear "conversion time," what do you think of?
Simply put, it’s the time that passes between a person's very first interaction with your brand and the moment they finally pull the trigger and buy. This metric, sometimes called time-to-convert or sales cycle length, is one of the most underrated tools for understanding how your customers think and for fine-tuning your entire marketing funnel.
Why Tracking Conversion Time Is a Game Changer
Before we get into the nuts and bolts of how to track it, we need to talk about why it’s so critical. Measuring the time it takes for a user to convert is so much more than an interesting data point—it's a diagnostic tool for your whole marketing strategy. It helps you look past raw conversion numbers and see the story behind each sale.
By analyzing this timeline, you get a much clearer picture of your customer journey. Are people buying on impulse within a few hours? Or are they taking weeks to mull it over? The answer completely changes how you should approach your budget, your messaging, and your follow-up.
Uncover Friction and Opportunity
A long conversion time can be a red flag, signaling friction somewhere in your funnel. Maybe your mid-funnel content isn't hitting the mark, or your checkout process is clunkier than you thought. On the flip side, a short conversion window often points to high-intent traffic sources you should be pouring more money into.
By understanding how long different customer segments take to convert, you can tailor your retargeting windows, personalize email sequences, and align your ad spend with the natural buying cycle of your audience. This prevents wasted ad dollars on audiences who aren't ready to buy and ensures you're present when they are.
This kind of detail is non-negotiable in a competitive market. The global average ecommerce conversion rate hovers between 2.5% and 3%. With margins that tight, you have to use every metric you can to get an edge. Understanding your conversion timeline gives you exactly that—a way to sharpen your approach when just driving more traffic isn't cutting it. You can see more on these trends over at RedStagFulfillment.com.
Strategic Benefits of Tracking Conversion Time
To truly appreciate the impact of this metric, it helps to see how it influences different parts of your business. Analyzing time-to-convert isn't just a reporting exercise; it leads to concrete, strategic actions that improve efficiency and profitability.
Area of Impact | Benefit of Analysis | Example Action |
|---|---|---|
Budget Allocation | Reveals which channels produce faster versus slower conversions | Shift spend from a long cycle channel to a shorter cycle channel to hit quarterly revenue targets |
Messaging and Content | Shows how long prospects typically need to be nurtured before converting | Create a fifteen day email sequence for leads from a channel that usually converts within two weeks |
Sales Funnel | Identifies friction points where prospects stall or drop off | A B test a simplified checkout flow when drop off occurs after twenty four hours |
Retargeting Strategy | Defines the most effective timing for follow up advertising | Use a seven day retargeting window for cart abandoners instead of a generic thirty day window |
Revenue Forecasting | Makes sales predictions more reliable using actual conversion timing | Forecast next month revenue using the average twenty one day conversion window from current leads |
Ultimately, having this data empowers you to build smarter, more predictable systems for acquiring customers.
Build Smarter Marketing Systems
The end goal is to build a repeatable, predictable engine for growth. Tracking conversion time is a cornerstone of that process. It lets you:
- Optimize Ad Spend: Allocate budget more effectively by knowing the typical sales cycle for different channels. A Facebook campaign might generate quick wins, while organic search builds a pipeline of leads that convert over several weeks.
- Improve Lead Nurturing: If you know a lead typically takes 15 days to convert, you can design an email and content sequence that perfectly matches that timeline, delivering value at each stage. Our guide on click-to-conversion time dives deeper into mapping this journey.
- Forecast Revenue Accurately: When you know your average conversion time, you can more reliably predict future sales based on current lead volume. It turns marketing from a guessing game into a more scientific process.
Building Your Data Collection Foundation
To get a real handle on conversion times, you need to build a data collection setup that actually works. This is about more than just slapping a script on your site. You need a connected system that grabs every important timestamp, from the very first ad click all the way to the final purchase. A shaky foundation here means you'll be working with fragmented data and insights you just can't trust.
It all starts with capturing what users do when they first land on your website. This is the world of client-side tracking, where tools like the Meta Pixel or Google Tag Manager are your go-to. These scripts run in the user's browser and are great for logging top-of-funnel actions like page views, content engagement, and add-to-cart clicks.
But here’s the catch: relying only on client-side tracking is a huge mistake in today's marketing world. With the rise of ad blockers and browser privacy updates from Apple, a ton of this data just disappears. In fact, studies show that over 42% of internet users worldwide now use ad blockers. That means a huge chunk of your most important user actions might never even get recorded.
This visual flow breaks down how tracking time helps you sharpen your marketing strategy, from pinpointing funnel stages to forecasting revenue.
 How to Track Conversion Times to Boost Your ROI
As you can see, a clear understanding of your conversion timeline directly feeds into smarter ad spend and more accurate financial planning.
Embracing Server-Side Tracking
This is exactly why server-side tracking has become non-negotiable for data accuracy. Instead of depending on the user's browser, events are sent from your website's server directly to the marketing platform's server. This approach is way more reliable because it completely bypasses ad blockers and isn't thrown off by browser privacy settings.
Tools like Meta's Conversions API (CAPI) are a perfect example. They forge a stable, direct connection that ensures your most critical conversion events—like lead submissions or purchases—are captured without fail. A good starting point is really understanding what the Conversion API is and how it works alongside traditional pixel tracking to give you a complete data picture.
By combining client-side and server-side tracking, you're essentially creating a fail-safe. The pixel grabs what it can from the browser, and the CAPI swoops in to fill in the gaps. The result? The most accurate dataset possible to build your analysis on.
Integrating Your CRM for a Complete View
For a lot of businesses, especially those with longer sales cycles or offline sales, the customer journey doesn't just stop on the website. A lead might finally become a customer weeks later over a phone call or after a few emails. If you can't connect that final sale back to the initial marketing touchpoint, your conversion time data is basically useless.
This is why CRM integration is an absolute must. By connecting your CRM (think Salesforce or HubSpot) to your analytics setup, you can finally stitch together the entire timeline.
Here’s a quick look at how it usually works:
- A unique identifier, like a click ID, is captured when a user submits a lead form on your site.
- This ID gets passed into your CRM and attached to the new lead's profile.
- When your sales team closes the deal, the CRM update can be fired back to your analytics platform, linking the final revenue to the original ad click that started it all.
This simple process lets you measure the true, end-to-end conversion time, not just the time it took to generate the initial lead online.
Unifying Data for a Single Source of Truth
Okay, so now you have data flowing in from pixels, servers, and your CRM. The final piece of the puzzle is bringing it all together. Trying to make sense of multiple dashboards is a recipe for confusion and bad decisions. This is where a platform like Cometly comes in, designed specifically to unify these different data streams into one clear view.
The end goal is to have a single source of truth where every timestamped event is recorded and attributed correctly. This unified dataset becomes the raw material for all the powerful analysis you'll do next. Of course, a foundational step in all of this is correctly setting up Google Analytics conversion tracking to gather the necessary data in the first place. When your event tracking is configured properly, you ensure you're capturing every timestamp you need to build your analysis on solid ground.
Choosing Your Attribution Models and Windows
To get an accurate read on your conversion times, you first have to decide how to give credit for a sale—and over what period. This is where attribution models and conversion windows come into play.
These aren't just technical settings you can "set and forget." They are the lens through which you see your entire customer journey. Pick the wrong ones, and your data can paint a completely distorted picture of what’s actually working.
An attribution model is simply the rule you use to assign credit to different touchpoints. A conversion window is the period of time after an ad interaction (like a click or a view) where a conversion can still be credited back to that ad. Getting both of these right is absolutely fundamental to understanding your sales cycle.
How Different Models Impact Time-to-Convert
Every attribution model tells a slightly different story about the path to purchase, which directly impacts how you measure your conversion timeline. There’s no single "best" model here—the right choice really depends on your business and what you’re trying to figure out.
- First-Touch Attribution: This model gives 100% of the credit to the very first interaction someone had with your brand. It’s perfect for figuring out which channels are driving initial awareness. When you measure conversion time with this model, you’re looking at the full, end-to-end journey from the moment of discovery to the final purchase.
- Last-Touch Attribution: On the flip side, this model gives all the credit to the final touchpoint before the sale. It’s great for highlighting what ultimately tipped the customer over the edge. Calculating your time-to-convert from the last touch tells you how quickly a final offer or a retargeting ad can trigger a purchase.
- Linear Attribution: This model spreads credit out equally across every single touchpoint. It’s built on the idea that every interaction played some role. While it gives you a balanced view, it can sometimes water down the impact of the most influential moments in the journey.
- Time-Decay Attribution: This model gives more credit to touchpoints that happened closer to the conversion. It’s a smart choice for businesses with shorter sales cycles because it places a higher value on the interactions that sealed the deal most recently.
Choosing a model isn't just a technical decision—it's a strategic one. A First-Touch model will likely show longer conversion times because it starts the clock at the very beginning, while a Last-Touch model will show much shorter times. Using both can give you a more complete picture of your funnel's velocity.
The image below gives you a great visual breakdown of how these models distribute credit differently.
As you can see, a simple last-click model ignores all the hard work your other channels did, while models like linear or time decay try to value the entire path. For a much deeper dive, check out our ultimate guide to attribution models to help you decide which is best for your business.
Setting Your Conversion Windows
Just as important as the model is the window you choose. A 7-day click, 1-day view window is a pretty common default on many platforms, but is it actually right for you?
For low-cost, impulse-buy products where decisions are made in minutes, a shorter window (like a 1-day click) makes the most sense. It ensures you’re only crediting ads that had an immediate impact.
But for a high-ticket item like a mattress or a B2B software subscription, a longer window of 30 or even 90 days is far more appropriate. You need to give enough time to capture the extended research and consideration that goes into those bigger purchases.
If you set a window that’s too short, you’ll miss out on attributing conversions that took longer to mature, making your marketing efforts look less effective than they really are. On the other hand, a window that’s too long risks giving credit to an ad that had very little real influence on a purchase made weeks later.
The key is to test and align the window with your average sales cycle. Dig into your current data, see how long it typically takes for a lead to become a customer, and set your initial window based on that benchmark.
How to Analyze Conversion Time Data
 How to Track Conversion Times to Boost Your ROI
Alright, you've got a solid stream of data flowing in. Now comes the fun part: translating those raw numbers into insights you can actually use. This is where the real value emerges. We're moving beyond just collecting timestamps to understanding the stories they tell about your customers.
The goal is to pinpoint exactly where your funnel is humming along and where it slows to a crawl.
This all starts by asking the right questions. Are certain marketing channels bringing in customers who decide to buy almost instantly? Do specific campaigns attract a more hesitant audience that needs more nurturing? Answering these requires diving into the data with a clear plan.
From Raw Data to Core Metrics
The foundation of any good analysis is calculating a few basic metrics for your conversion times. You'll want to look at the average, median, and the overall distribution. While the average gives you a general benchmark, it can be easily skewed by outliers—think of that one customer who converts after 180 days.
This is why the median conversion time is often a more reliable metric. It represents the midpoint of your data, telling you that 50% of your customers convert within this specific timeframe. It's a much truer reflection of a "typical" customer journey because it isn't thrown off by those unusually long or short sales cycles.
To calculate these, you'll probably be running some SQL queries against your data warehouse or analytics database. A common function here is DATEDIFF(), which simply calculates the difference between two timestamps.
For example, to find the average time in days between a user's first visit and their purchase, a query might look something like this:
SELECT
AVG(DATEDIFF(day, first_touch_timestamp, purchase_timestamp)) AS average_conversion_time_days
FROM
user_conversions;
This simple query is your starting point. From here, you can swap AVG() with MEDIAN() or other functions to get a much richer view of what's happening.
Segmenting Your Data for Deeper Insights
Calculating an overall average conversion time is a nice start, but the real magic happens when you start segmenting that data. A single, sitewide number hides critical variations between different channels, campaigns, and customer types. Breaking down your analysis is how you uncover these hidden patterns.
You should aim to segment your conversion time data by several key dimensions:
- Marketing Channel: Compare the time-to-convert for users from Organic Search vs. Paid Social vs. Email. You might find that search traffic converts in 7 days, while social traffic takes a full 14 days.
- Specific Campaign: Drill down into individual ad campaigns. Does your "Summer Sale" campaign convert faster than your evergreen "Brand Awareness" campaign? This is where budget decisions get made.
- User Demographics: If you have the data, segment by location, device, or other attributes to see if certain groups have distinct buying cycles.
This level of detail moves you from being a passive observer to an active strategist. Knowing that your Google Ads traffic converts twice as fast as your Facebook traffic is an immediately actionable insight. To explore more advanced segmentation techniques, our guide on conversion analytics offers a deeper look into slicing and dicing your data.
Visualizing the Story in Your Data
Numbers in a spreadsheet are hard to interpret. To truly understand and communicate your findings, you need to visualize them. Creating dashboards in tools like Looker Studio or Tableau turns complex datasets into intuitive charts that everyone on your team can grasp instantly.
One of the most powerful visualizations for conversion time is a histogram. Instead of just showing an average, a histogram shows the distribution, or "shape," of your conversion times. It might reveal that a huge cluster of your customers converts within the first 24 hours, with a long tail of users converting over the next 30 days.
This visual insight is far more powerful than a simple average. It tells you that you have two distinct user behaviors to optimize for: a group that responds to immediate, high-impact offers and another that requires a longer, more patient nurturing sequence.
Don't forget to add context from industry benchmarks. For example, the food and beverage sector often sees conversion rates around 6.11%, while luxury goods average a much lower 1.19%. This highlights that what constitutes a "good" conversion time is entirely relative. A long consideration period for a luxury watch is expected, but a long delay for a pizza delivery order signals a problem. Check out more of these ecommerce benchmarks on SpeedCommerce.com to see how you stack up. This context is vital when you track conversion times and interpret your findings.
Turning Insights into Optimization Strategies
 How to Track Conversion Times to Boost Your ROI
Analysis is only half the battle. Once you've tracked your conversion times and sliced up the data, the real work begins: turning those numbers into tangible strategies that actually impact your bottom line. Raw data is interesting, but actionable insights are what really drive growth.
This is where you close the loop, connecting what you’ve learned about your sales cycle directly back to your day-to-day marketing decisions. The patterns you uncovered are now a roadmap for refining ad spend, messaging, and overall funnel velocity. Each insight should point to a specific, concrete adjustment you can make.
Aligning Ad Spend with Sales Velocity
One of the quickest wins from conversion time data is aligning your ad budget with the natural buying rhythm of your customers. It’s simple: different channels produce leads with different levels of intent, which means they convert at different speeds. Recognizing this lets you allocate your resources much more intelligently.
Let's say your analysis reveals a specific Meta Ads campaign has a short 1-3 day average conversion time for a particular audience. That's a blaring signal of high-intent traffic. These people are ready to buy now.
The strategic response should be immediate and aggressive:
- Scale Ad Spend: Pour more budget into this campaign to capture as many of these quick-to-convert users as possible before the opportunity fades.
- Expand Lookalike Audiences: Build lookalikes based on this high-performing segment. You want to find more people who exhibit the exact same buying behaviors.
- Focus on Direct-Response Creative: Your ad copy and visuals should push for an immediate sale. Think clear, urgent calls-to-action like "Shop Now" or "Buy Today."
This approach capitalizes on momentum, maximizing your return from audiences who don't need a long, drawn-out nurturing period.
Crafting Nurture Sequences for Longer Cycles
But what if you discover that leads from your organic blog content or a top-of-funnel Google Ads campaign have a much longer 14-21 day conversion cycle? These users are in a research and consideration phase. Trying to force an immediate sale is not only ineffective but can also be a major turn-off.
For these slower-moving segments, the strategy shifts from aggression to patience.
The goal is to stay top-of-mind and build trust over time, guiding them through their decision-making process instead of rushing them. A longer conversion time isn’t a failure; it’s an invitation to engage differently.
Here, your focus should be on building a multi-touch retargeting and nurturing sequence that mirrors their timeline:
- Educational Content: Serve them case studies, buyer's guides, and webinars that address their pain points and perfectly position your product as the best solution.
- Email Nurturing: Get them into an automated email sequence that delivers value over two to three weeks, matching their typical consideration window.
- Social Proof: Retarget them with customer testimonials, user-generated content, and five-star reviews to build credibility and dissolve any lingering doubts.
This methodical approach ensures you're still present and helpful long after that initial click, making it far more likely they’ll choose you when they're finally ready to pull the trigger.
Optimizing Offers and Messaging
Your conversion time analysis also provides valuable clues about the offers and messaging that resonate at different stages of the funnel. If you notice a significant drop-off or delay at a certain point, it might be because your offer just doesn’t match the user's current level of commitment.
For example, if users from a cold traffic source are taking weeks to convert, hitting them with a "Buy Now" landing page is a total mismatch. A softer offer—like a free trial, a downloadable guide, or a webinar sign-up—is far more appropriate for where they are in their journey. It aligns the offer with their intent and keeps them engaged in your ecosystem. For a deeper look at aligning your on-site experience, our guide on conversion optimization strategy provides a framework for testing these changes effectively.
This principle of optimizing time-based metrics extends well beyond marketing. Take software development, where exploring strategies for optimizing development lead time can dramatically reduce costs. The core concept is identical: measure time, identify the bottlenecks, and implement smart strategies to improve velocity. By applying these data-driven actions, you transform your analysis from a simple report into a powerful engine for profitable growth.
Common Pitfalls in Conversion Time Tracking
Even with a perfect data setup, it's surprisingly easy to get your conversion time analysis wrong. A few common mistakes can send you down the wrong path, leading to flawed conclusions and wasted marketing spend. If you want to make decisions you can trust, you need to know what these pitfalls are and how to navigate them.
One of the biggest culprits is data fragmentation. This happens when your tracking tools don’t talk to each other—for instance, your ad platform, website analytics, and CRM are all operating in their own little silos. You can't see the full customer journey, which makes it impossible to connect an initial ad click to a final sale that happens weeks later. This completely skews your time-to-convert metrics from the get-go.
Relying on Averages Alone
Focusing only on the average conversion time is another major trap. Averages are notoriously sensitive to outliers, like a few sales that take an unusually long time to close, and can hide what's really going on.
For example, your dashboard might show an average conversion time of 10 days. But what if 80% of your customers actually buy within the first 48 hours, while a small group takes over a month to decide? That 10-day average is completely misleading. Acting on it, you might build a needlessly long and expensive retargeting sequence for an audience that was already ready to buy.
The median conversion time often paints a much more accurate picture of typical customer behavior because it isn't thrown off by extreme outliers. The key is to analyze the distribution of conversion times—not just a single number—to get the full story.
One-Size-Fits-All Attribution Windows
Applying a generic attribution window across all your channels and products is a critical mistake. A 7-day click window might be perfect for a low-cost, impulse buy you’re promoting on Meta. But that same window is totally wrong for a high-ticket B2B service you're advertising on LinkedIn, which might have a 90-day sales cycle.
Using a window that’s too short will make you under-report conversions, causing high-consideration channels to look far less effective than they actually are. You have to tailor your conversion windows to match the typical buying cycle for each specific product and channel.
Finally, don’t just ignore the outliers once you’ve identified them. They’re often a source of powerful insights.
- Unusually short times can point you to your most effective ad creative or highest-intent audience segments.
- Unusually long times might highlight friction points in your funnel or identify a customer segment that needs more nurturing before they’re ready to buy.
By sidestepping these common errors, your efforts to track conversion times will produce far more reliable and actionable insights, giving you a clearer path to optimization and growth.
Got Questions About Tracking Conversion Time? We've Got Answers.
Diving into a new metric always sparks a few questions. When it comes to conversion time, here are the most common ones we hear from marketers.
What’s a “Good” Average Conversion Time?
This is the million-dollar question, but the honest answer is: there’s no magic number.
A low-cost e-commerce product might convert in minutes, while a complex B2B software sale could take six months. The "right" timeframe depends entirely on your industry, product complexity, and price point.
Your real goal isn't to hit some universal benchmark. It's to establish your own baseline and then find ways to shorten it.
How Do I Track Conversion Time for Offline Sales?
This is where your tech stack needs to talk. The key is connecting your CRM to your marketing analytics platform, like Cometly.
It works by passing a unique identifier (like a click ID) from your ad click, through your lead form, and directly into your CRM. When your sales team marks that deal as "closed-won" weeks or months later, the system connects it back to the original ad click. Just like that, you have the full timeline from first touch to final sale.
Should I Use First-Touch or Last-Touch Timestamps?
Why choose? For a complete picture, you need to look at both.
- First-Touch to Conversion: This shows you the entire consideration journey, from the moment a prospect first discovered you to the day they bought. It's great for understanding the full sales cycle length.
- Last-Touch to Conversion: This tells you how quickly your final marketing touchpoint sealed the deal. It’s perfect for measuring the effectiveness of your bottom-of-funnel campaigns.
Analyzing both gives you a much richer, more nuanced view of your funnel's velocity. You see what starts the conversation and what closes it.
Get a crystal-clear view of your entire customer journey and conversion timeline. Cometly unifies your tracking data into a single, reliable source of truth so you can optimize every marketing dollar. See how Cometly eliminates attribution guesswork.