Your marketing team is spending six figures monthly across Meta, Google, LinkedIn, and other channels. Your CFO wants to know which campaigns actually drive revenue. Your ad platforms each claim credit for the same conversions. And you're stuck reconciling conflicting reports that don't match your actual sales data.
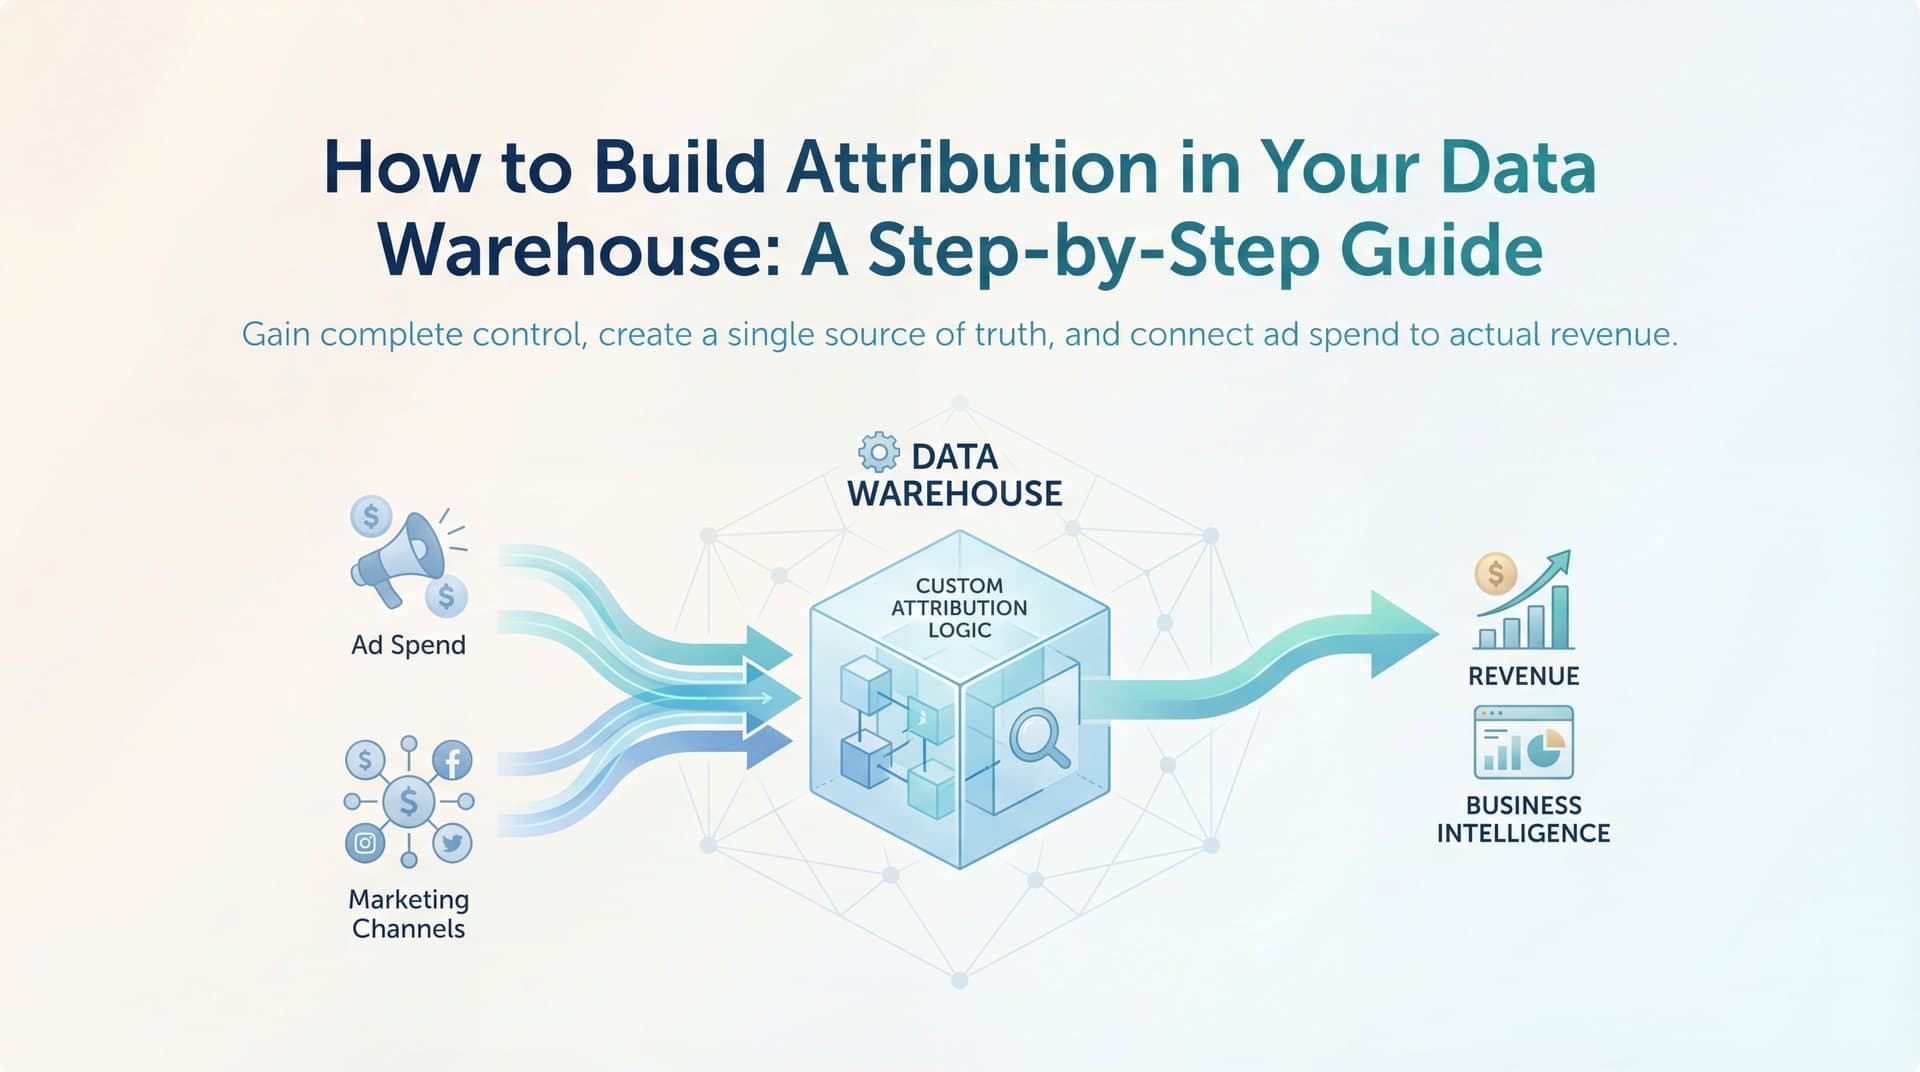
Building attribution directly in your data warehouse solves this problem by giving you complete control over how marketing credit gets assigned. Instead of trusting black-box algorithms or accepting platform-reported numbers at face value, you can customize attribution logic to match your actual customer journey, maintain full data ownership, and integrate marketing insights with your broader business intelligence.
This isn't about replacing every analytics tool you use. It's about creating a single source of truth for attribution that connects ad clicks to closed revenue using your own data and your own rules.
The benefits are tangible: you'll see exactly which channels contribute to conversions across the entire journey, compare how different attribution models value your marketing mix, and make budget decisions based on data you control rather than platform-reported metrics that inflate their own importance.
This guide walks through the practical steps to build a warehouse-native attribution system—from setting up your data infrastructure to implementing attribution models and activating insights. Whether you're using Snowflake, BigQuery, Redshift, or another modern data warehouse, you'll learn how to capture touchpoints, structure your data for attribution analysis, and calculate credit across your marketing channels.
Step 1: Set Up Your Data Foundation and Warehouse Infrastructure
Your attribution system lives or dies based on your data foundation. Before ingesting a single event, you need a warehouse environment structured for attribution workloads.
Start by choosing your data warehouse platform if you haven't already. Snowflake excels at handling semi-structured JSON data and scales compute independently from storage. BigQuery offers seamless integration with Google's ecosystem and columnar storage optimized for analytical queries. Redshift works well if you're already invested in AWS infrastructure. Databricks combines data warehousing with machine learning capabilities if you plan to build data-driven attribution models later.
The choice matters less than picking one that aligns with your existing tech stack and query patterns. Attribution queries involve lots of window functions and joins across large event tables, so any modern columnar warehouse handles the workload.
Create dedicated schemas that separate concerns and make your attribution pipeline maintainable. You'll need at least three: a raw schema for unprocessed event data exactly as it arrives from sources, a staging schema for cleaned and transformed touchpoint data, and an analytics schema for attribution output tables that stakeholders will query.
This separation prevents raw data chaos from polluting your production analytics. When an ad platform changes their API response format, you fix it in staging without touching downstream attribution logic.
Establish naming conventions before you start. Use consistent prefixes like "raw_", "stg_", and "fct_" for tables. Name event tables by source: "raw_facebook_ads_clicks", "raw_google_analytics_sessions", "raw_salesforce_opportunities". Future you will appreciate the clarity when debugging attribution discrepancies at 10pm.
Set up user permissions and access controls now. Marketing teams need read access to attribution output tables but shouldn't query raw event data directly. Analytics engineers need write access to staging and analytics schemas. Finance needs read access for revenue reconciliation. Your warehouse's role-based access control makes this straightforward.
Create placeholder tables with proper schema definitions even before data flows. Define your events table structure: user_id, timestamp, event_type, channel, campaign, ad_set, creative, utm_parameters, device_type, and any custom properties your business tracks. This forces you to think through data requirements before building pipelines.
Verify success by running a simple query against your empty schemas. If you can SELECT from properly structured but empty tables, you've built a solid foundation. If you're getting permission errors or can't find your schemas, fix access issues now before they block your entire pipeline later.
Step 2: Ingest and Unify Marketing Touchpoint Data
Now comes the challenging part: getting marketing data from dozens of sources into your warehouse with consistent structure. This step determines attribution accuracy more than any modeling choice you'll make later.
Connect your data sources using ETL tools rather than building custom pipelines from scratch. Fivetran offers pre-built connectors for major ad platforms and automatically handles schema changes. Airbyte provides open-source flexibility with a growing connector library. Stitch works well for straightforward data replication needs. These tools save weeks of engineering time compared to maintaining custom API integrations.
For each source, you're capturing different types of touchpoint data. From Meta and Google Ads, you need click and impression events with campaign hierarchy details. From your website analytics, you need session data with UTM parameters and page views. From your CRM, you need form submissions and conversion events. From email platforms, you need opens and clicks with campaign identifiers.
The real challenge isn't ingestion—it's unification. Each platform uses different identifiers and naming conventions. Meta calls it "campaign_id" while Google uses "campaignId". Your website captures "utm_source" but your CRM stores "lead_source". Attribution only works when you can connect these disparate touchpoints to the same user journey.
Map common identifiers across sources before you start transforming data. User IDs are your primary key when available—someone logged into your product or submitted a form with an email. Cookie IDs or device IDs work for anonymous traffic but break across devices. UTM parameters bridge the gap between ad clicks and website sessions when users don't log in immediately.
Create a unified events table that standardizes this chaos. Write transformation logic that maps each source's fields into a consistent schema: standardized channel names (paid_social, paid_search, organic_social, email, direct), normalized campaign identifiers, unified user identifiers with a hierarchy (user_id preferred, then email, then cookie_id), consistent timestamp formats in UTC, and standardized event types (impression, click, page_view, form_submit, purchase).
Handle identity resolution challenges explicitly. Cookie limitations mean you'll lose tracking when users switch devices or browsers. Cross-device tracking requires probabilistic matching based on behavioral patterns—same IP address, similar browsing times, matching form data. Anonymous-to-known user stitching happens when someone browses anonymously then logs in, requiring you to backfill their cookie_id events with their actual user_id.
Build identity graphs that connect multiple identifiers to a single person. When user "12345" has email "john@company.com" and cookie "abc123xyz", all three identifiers should resolve to the same attribution record. This prevents undercounting conversions because you couldn't connect a logged-in purchase to earlier anonymous ad clicks. Proper customer attribution tracking depends on getting this identity resolution right.
Verify success by querying your unified events table for a known conversion. Pick a recent customer and search for their email or user ID. You should see their complete touchpoint sequence: ad impressions from awareness campaigns, clicks from retargeting ads, website sessions with UTM parameters, form submissions, and the final conversion event. If you see gaps or can't connect touchpoints to conversions, your identity resolution needs work before moving forward.
Step 3: Build Your Customer Journey Model
Attribution assigns credit based on customer journeys, so you need tables that represent how users move from first awareness to conversion. This step transforms your flat events table into structured journey data.
Define what constitutes a conversion in your business context. For e-commerce, it's a completed purchase. For SaaS, it might be a demo request, free trial signup, or paid subscription. For lead-gen businesses, it could be a qualified form submission or a sales-accepted opportunity. Your conversion definition determines which journeys get analyzed and which touchpoints receive credit.
Create a conversions table that captures these key events with the user identifier, conversion timestamp, conversion value (revenue or deal size), and conversion type if you track multiple goals. This becomes your anchor table—every attribution calculation starts with conversions and works backward through touchpoints.
Build journey tables that sequence touchpoints chronologically for each user leading to conversion. Use SQL window functions to order events by timestamp within each user_id, then filter to only include touchpoints that occurred before the conversion timestamp. This creates a complete path from first touch to conversion.
Set attribution windows based on your typical sales cycle length. If most customers convert within 7 days of first touch, a 7-day window captures relevant touchpoints without including noise. If you're selling enterprise software with 90-day sales cycles, you need a 90-day window to credit early awareness touchpoints that initiated the journey months before conversion.
Different channels often require different windows. Paid search might get credit within 7 days since users click with high intent. Display advertising might need 30 days since it builds awareness that leads to later conversions. Content marketing could warrant 90 days since blog readers often convert much later. Implement separate windows per channel or use a single conservative window that captures your longest typical journey.
Handle edge cases that complicate clean attribution logic. Multiple conversions per user require deciding whether to attribute each conversion independently or treat repeat purchases differently. Touchpoints after conversion should be excluded from attribution for that conversion but included for future conversions. Incomplete journeys—users who clicked ads but haven't converted yet—get excluded from attribution analysis until they convert.
Build a journey summary table that aggregates touchpoint counts and key metrics per conversion: total touchpoints in the journey, number of unique channels involved, time from first touch to conversion, number of paid touchpoints versus organic, and the specific sequence of channels (paid_social → organic_search → email → direct).
This summary table becomes invaluable for understanding journey complexity. If most conversions happen after 8+ touchpoints across 4+ channels, your attribution model needs to credit the full journey rather than focusing only on first or last touch. Understanding cross channel attribution becomes essential when customers interact with your brand through multiple touchpoints.
Verify success by querying a complete touchpoint sequence for any converted user. Pick a recent conversion from your conversions table, find their user_id, and query your journey table filtered to that user and conversion. You should see every relevant touchpoint ordered chronologically from first awareness to final conversion, all within your attribution window. If touchpoints are missing or ordered incorrectly, your journey logic needs debugging before you build attribution models on top.
Step 4: Implement Attribution Models in SQL
With customer journeys structured properly, you can now calculate how credit gets distributed across touchpoints. This is where attribution logic turns journey data into actionable channel performance insights.
Start with rule-based models because they're straightforward to implement and easy to explain to stakeholders. First-touch attribution assigns 100% credit to the first touchpoint in each journey. Last-touch assigns 100% credit to the final touchpoint before conversion. Linear attribution divides credit equally across all touchpoints. Understanding the difference between single source attribution and multi-touch attribution models helps you choose the right approach for your business.
Implement first-touch using SQL window functions. For each conversion, use ROW_NUMBER() to identify the first touchpoint, then assign that touchpoint the full conversion value. The query looks for the earliest timestamp within each user's journey and credits that channel, campaign, and creative with the entire conversion.
Last-touch works similarly but identifies the final touchpoint before conversion. This often credits direct traffic or branded search since users frequently navigate directly to your site right before converting—even though earlier touchpoints introduced them to your brand.
Linear attribution requires dividing conversion value by the number of touchpoints in the journey. If a conversion worth $1,000 involved 5 touchpoints, each receives $200 credit. Use COUNT() window functions to calculate touchpoint counts, then divide conversion value accordingly.
Build time-decay attribution that weights recent touchpoints more heavily using exponential decay formulas. The logic: touchpoints closer to conversion influenced the decision more than touchpoints from weeks earlier. Implement this by calculating days between each touchpoint and conversion, then applying an exponential decay function where credit decreases by a set percentage for each day earlier.
A common time-decay formula uses a 7-day half-life: touchpoints from 7 days before conversion get half the weight of touchpoints from the day before conversion. Touchpoints from 14 days before get one-quarter weight. This rewards recency while still crediting earlier awareness touchpoints.
Create position-based attribution (U-shaped) that credits first and last touches while distributing remaining credit across middle touchpoints. The standard U-shaped model assigns 40% credit to first touch, 40% to last touch, and splits the remaining 20% equally among middle touchpoints. This acknowledges that awareness and conversion touchpoints matter most while recognizing the nurturing that happens in between. For a deeper dive into these approaches, explore our multi-touch attribution models guide.
Write modular SQL that allows switching between models without rebuilding entire pipelines. Create separate views or functions for each attribution model that all query the same underlying journey tables. This lets you compare how different models value your channels without duplicating data transformation logic.
Structure your attribution output tables consistently regardless of model: conversion_id, user_id, touchpoint_id, channel, campaign, ad_set, creative, attributed_revenue, attribution_model, and attribution_timestamp. This standardized schema makes it easy to union results from multiple models or switch between them in dashboards.
Implement at least two contrasting models initially—typically last-touch and linear or time-decay. This reveals how different approaches value your marketing mix and helps you understand which channels drive awareness versus conversion.
Verify success by running the same conversion set through multiple models and comparing how credit distribution changes. Pick 100 recent conversions and calculate attributed revenue by channel using first-touch, last-touch, and linear models. If paid social shows high first-touch revenue but low last-touch revenue, it's driving awareness but not closing conversions. If branded search shows high last-touch but low first-touch revenue, it's capturing existing demand rather than creating it. These insights only emerge when comparing attribution models.
Step 5: Calculate Channel and Campaign Performance Metrics
Attribution models tell you how to distribute credit, but stakeholders care about performance metrics: which channels drive the most revenue, which campaigns deliver the best ROAS, and where to increase or decrease budget. This step transforms attributed credit into actionable performance data.
Aggregate attributed conversions and revenue by channel, campaign, ad set, and creative level. Create summary tables that roll up attribution data at each level of granularity. Channel-level summaries show that paid social drove $50,000 attributed revenue across all campaigns. Campaign-level summaries show that your Q1 retargeting campaign drove $12,000 of that total. Ad set summaries reveal which audiences perform best. Creative summaries identify top-performing ad variations.
Join attribution data with ad spend data to calculate attributed ROAS and CPA for each model. Import spend data from your ad platforms into your warehouse—daily spend by campaign and ad set. Join this spend data with your attributed revenue tables using campaign identifiers and date ranges. Calculate ROAS as attributed revenue divided by spend. Calculate CPA as spend divided by attributed conversions. This approach to marketing attribution platforms revenue tracking gives you accurate performance visibility.
These metrics reveal profitability at every level. A campaign showing $10,000 spend and $30,000 attributed revenue delivers 3x ROAS—clearly profitable. A campaign showing $5,000 spend and $2,000 attributed revenue loses money and needs optimization or pausing.
Build comparison views that show how different attribution models value the same channels. Create a table with columns for channel, first_touch_revenue, last_touch_revenue, linear_revenue, and time_decay_revenue. This side-by-side comparison reveals which channels benefit from which models and helps you understand their role in your marketing mix.
If organic social shows high first-touch attribution but low last-touch attribution, it's driving awareness and starting customer journeys but not closing deals. If email shows low first-touch but high last-touch attribution, it's converting users who were already aware rather than generating new demand. Neither insight is wrong—they reveal different aspects of channel performance.
Create cohort analysis tables to track attributed revenue over time as conversions mature. Not all revenue gets captured immediately. A user who clicks an ad today might convert next week or next month. Cohort analysis shows how attributed revenue for each campaign grows as more conversions get credited back to it over time.
Structure cohorts by the date of first touchpoint, then track attributed conversions that occur 1 day later, 7 days later, 30 days later, and 90 days later. This reveals your true conversion lag and helps you avoid prematurely judging campaign performance before conversions have time to materialize.
Build a master performance dashboard table that combines all these metrics: channel, campaign, ad_set, spend, impressions, clicks, attributed_conversions, attributed_revenue, attributed_roas, attributed_cpa, attribution_model, and date_range. This becomes your single source of truth for marketing performance that stakeholders query for reporting and analysis.
Verify success by generating a report showing attributed revenue and ROAS by channel that reconciles with total conversions. Sum attributed revenue across all channels for each attribution model. This total should match your actual conversion revenue (within rounding). If linear attribution shows $100,000 total attributed revenue but you only generated $80,000 in actual revenue, your attribution logic is double-counting conversions or including touchpoints outside your attribution window. Learning how to fix attribution discrepancies in data becomes critical when these issues arise.
Step 6: Automate and Operationalize Your Attribution Pipeline
You've built a functioning attribution system, but manual updates don't scale. This final step transforms your attribution logic into a production pipeline that runs automatically and surfaces insights to stakeholders without engineering intervention.
Schedule incremental data refreshes using dbt, Airflow, or your warehouse's native scheduling. Attribution data needs daily updates as new conversions occur and new touchpoints get captured. Set up jobs that run every morning: ingest new event data from sources, transform raw events into unified touchpoint tables, rebuild customer journeys for recent conversions, recalculate attribution models for the trailing 90 days, and refresh performance summary tables with updated metrics.
Incremental processing is critical for performance. Don't reprocess your entire historical dataset daily. Use incremental logic that only processes events and conversions from the past week, then merges results with historical attribution data. This keeps query costs reasonable and refresh times under 30 minutes instead of hours.
Implement data quality checks that alert you to missing touchpoints, broken identity joins, or unusual patterns. Build monitoring queries that run after each refresh: check for days with zero events from major sources (indicates broken connectors), verify conversion counts match your CRM or transaction system (catches attribution logic bugs), alert when attributed revenue diverges significantly from actual revenue (signals double-counting or missing touchpoints), and flag sudden drops in touchpoint volume by channel (indicates tracking issues).
These checks catch problems before stakeholders notice discrepancies in dashboards. When your Meta connector breaks and stops sending click data, you want an alert at 6am—not a confused Slack message from your CMO at 10am asking why paid social shows zero attributed revenue.
Create dashboards in your BI tool that surface attribution insights to stakeholders without requiring SQL knowledge. Looker, Tableau, Metabase, and other tools connect directly to your warehouse and query your attribution tables. Build dashboards that show: attributed revenue by channel over time with model comparison, campaign performance ranked by ROAS with spend and conversion metrics, customer journey analysis showing most common paths to conversion, and cohort performance tracking how attributed revenue matures over time. Solid marketing attribution analytics depends on making these insights accessible to decision-makers.
Design dashboards for your audience. Marketing teams need campaign-level detail with filters for date ranges and attribution models. Executives need high-level channel performance with clear ROAS metrics. Finance needs revenue reconciliation views that match attribution data to actual bookings.
Document your attribution logic so team members understand how credit is assigned and can troubleshoot issues. Write internal documentation that explains: which attribution models you've implemented and when to use each, how your attribution window works and why you chose that length, how identity resolution connects anonymous and known users, which touchpoints get included or excluded from attribution, and how to interpret attribution metrics compared to platform-reported numbers.
This documentation prevents confusion when attribution metrics differ from what ad platforms report. Google Ads might claim 500 conversions while your last-touch attribution shows 300 conversions from paid search. Your documentation explains that Google uses last-click attribution with a 30-day window while your system uses last-touch with a 7-day window and only counts conversions that match your CRM data.
Set up access permissions so stakeholders can explore data independently without breaking production tables. Grant read-only access to attribution output tables and performance dashboards. Restrict write access to analytics engineers who maintain the pipeline. This prevents accidental data modifications while enabling self-service analytics.
Verify success when attribution data refreshes daily without manual intervention and stakeholders access insights independently. Check your scheduled jobs for three consecutive days—they should complete successfully without errors. Ask a marketing team member to pull a campaign performance report using your dashboard without your help. If they can answer "Which campaign drove the most revenue last week?" in under two minutes, you've successfully operationalized attribution.
Putting It All Together
You've now built a warehouse-native attribution system that tracks touchpoints across channels, calculates credit using multiple models, and surfaces actionable insights. Your checklist for success includes a data warehouse with proper schemas configured for raw, staging, and analytics data; unified touchpoint data from all marketing sources with consistent identifiers; customer journey tables linking touchpoints to conversions within attribution windows; at least two attribution models implemented and comparable side-by-side; automated daily refreshes with quality monitoring and alerts; and dashboards accessible to your marketing team for self-service analysis.
This foundation gives you control over attribution logic and eliminates dependence on platform-reported metrics that inflate their own importance. You can now answer critical questions: which channels actually drive revenue versus just claiming last-click credit, how much awareness value do top-of-funnel channels provide, which campaigns deliver profitable ROAS when you account for the full customer journey, and where should you increase budget based on attributed performance rather than vanity metrics.
The system you've built is flexible and customizable. You can add new attribution models as your understanding evolves, adjust attribution windows as your sales cycle changes, incorporate offline conversions from your CRM, and experiment with custom logic that matches your unique business model.
But maintaining this system requires ongoing engineering resources and constant adaptation to tracking changes. When iOS releases new privacy restrictions, you'll need to update identity resolution logic. When ad platforms change their APIs, you'll need to fix broken connectors. When stakeholders request new metrics, you'll need to extend your attribution models. The build-versus-buy question ultimately comes down to whether attribution is a core competency worth significant engineering investment.
Platforms like Cometly handle this complexity automatically—capturing every touchpoint across ad platforms and your website, applying sophisticated attribution models that compare first-touch, last-touch, linear, time-decay, and position-based approaches, resolving identity across devices and sessions without manual configuration, and syncing enriched conversion data back to ad platforms to improve their targeting algorithms. The platform's AI analyzes your attribution data to identify high-performing campaigns and provides recommendations for scaling what actually drives revenue.
Whether you maintain your warehouse solution or explore purpose-built attribution tools, the goal remains the same: understanding which marketing efforts actually drive revenue so you can scale what works and cut what doesn't. Your attribution system should answer questions, not create more confusion. It should save time, not consume endless engineering hours. And it should improve marketing performance, not just produce reports that sit unused.
Ready to elevate your marketing game with precision and confidence? Discover how Cometly's AI-driven recommendations can transform your ad strategy—Get your free demo today and start capturing every touchpoint to maximize your conversions.