You're running paid ads across Meta, Google, TikTok, and maybe LinkedIn. Your dashboards show clicks, impressions, and conversions. But here's what they don't show: the actual path your customers take before they buy.
Most marketers see fragments. They know someone clicked a Facebook ad. They know someone later converted. What they miss is everything in between—the Google search that happened three days later, the email they opened, the pricing page they visited twice, the retargeting ad that finally pushed them over the edge.
This fragmented view leads to terrible decisions. You cut budgets on campaigns that actually drive conversions because they don't get last-click credit. You double down on channels that look good in isolation but contribute little to actual revenue. You optimize for metrics that don't reflect how customers really behave.
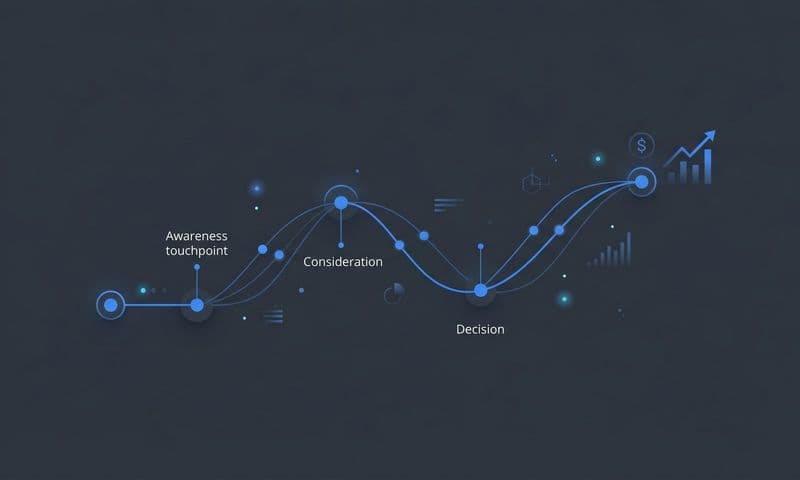
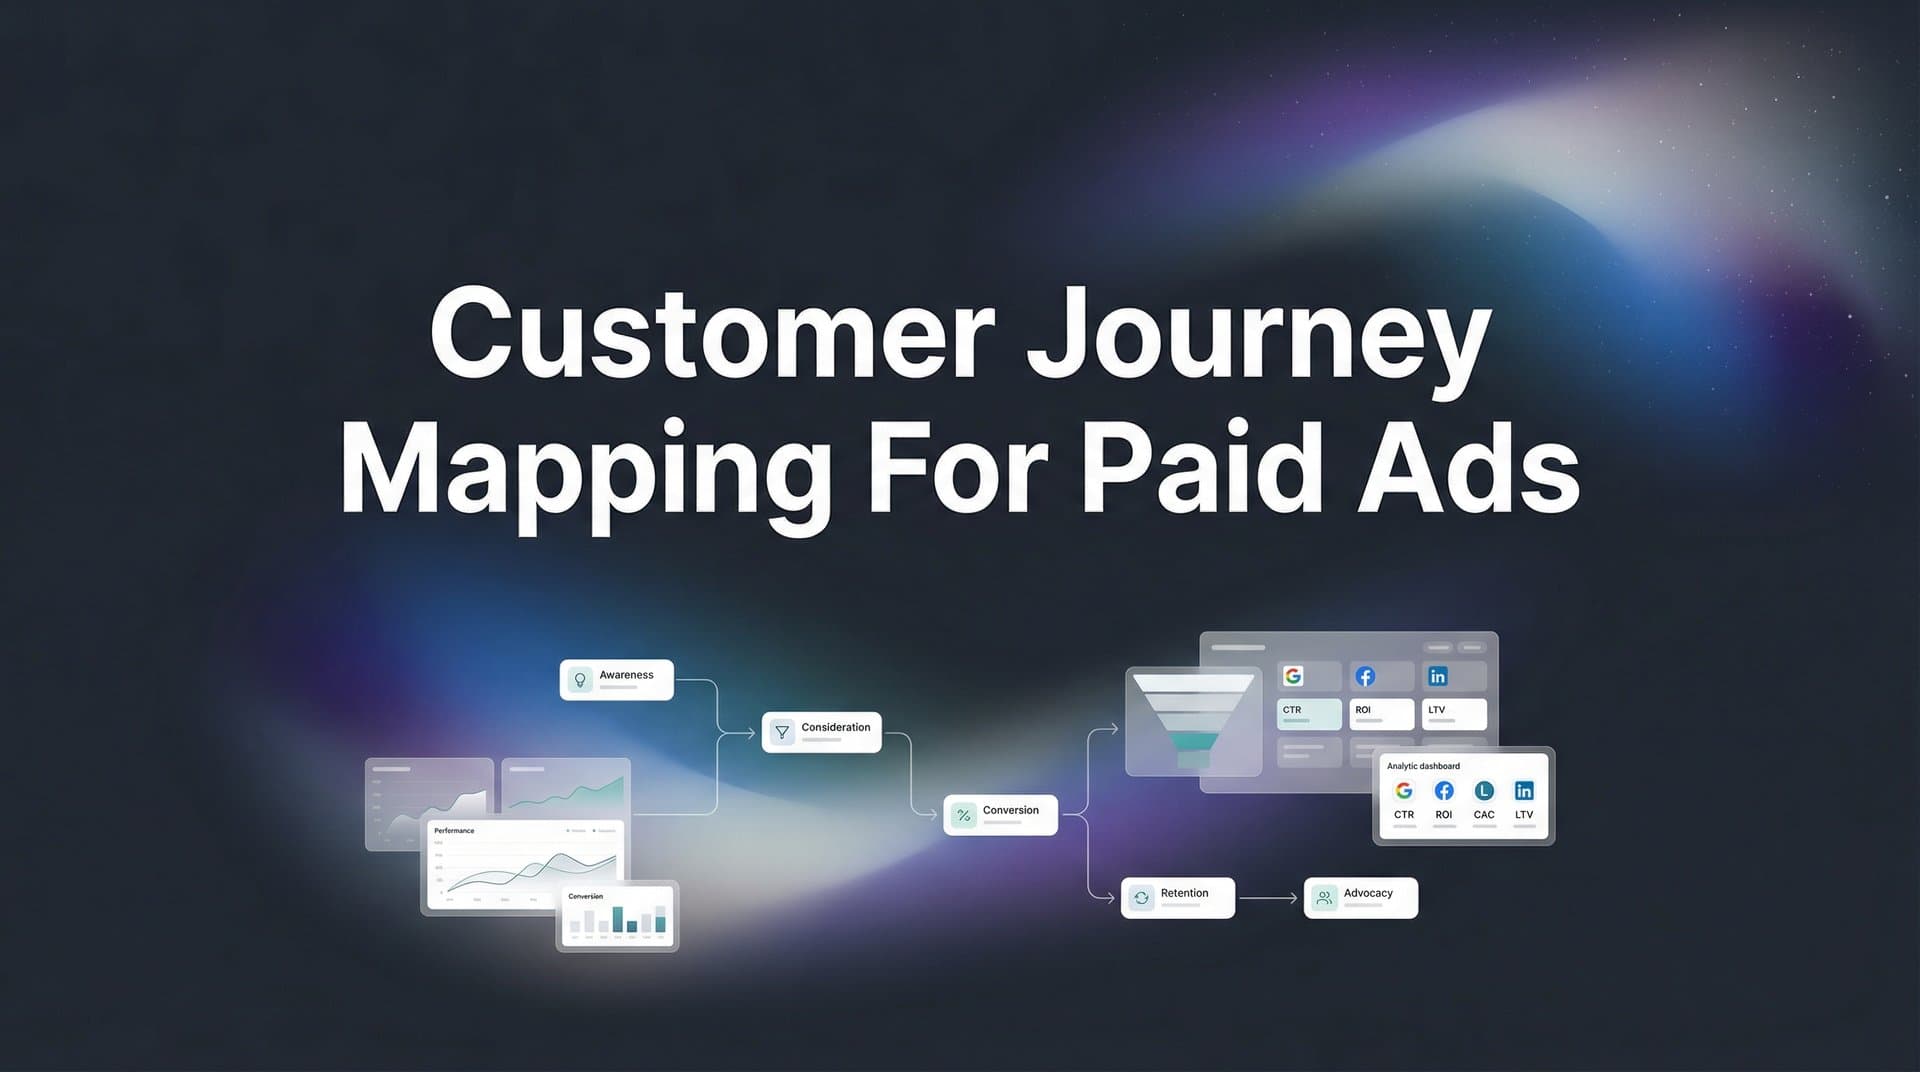
Customer journey mapping for paid ads solves this problem. It connects every touchpoint—from first ad impression to final purchase—into a complete view of how your marketing actually works. You see which ads start relationships, which ones nurture interest, and which ones close deals. You identify where prospects drop off and why. You understand the real value of each channel, not just the one that happened to be last.
This guide walks you through building that complete view. You'll learn to audit your current data sources, define the events that matter, connect everything into a unified tracking system, visualize the actual paths customers take, apply attribution models that reflect reality, and optimize spend based on what truly drives conversions.
The result? You'll stop guessing which ads work and start knowing. You'll allocate budget to the touchpoints that actually influence purchases. You'll feed better data back to ad platforms so their algorithms can find more customers like your best ones. And you'll finally understand the full story of how your paid ads turn strangers into customers.
Step 1: Audit Your Current Touchpoint Data Sources
Before you can map customer journeys, you need to know what data you're actually capturing. Most marketing teams have data scattered across multiple platforms with no clear picture of what they can and can't see.
Start by listing every paid ad platform you're currently running. Meta Ads, Google Ads, TikTok Ads, LinkedIn Campaign Manager, Twitter Ads—write them all down. For each platform, document what tracking you have in place. Do you have pixels installed? Are you using UTM parameters consistently? Can you see post-click behavior or just ad interactions?
Next, examine your CRM setup. How does lead and customer data flow into your system? When someone fills out a form, does that data connect back to the ad that drove them there? When a lead becomes a customer, can you trace that revenue back to specific campaigns? Many teams discover their CRM is a black hole—data goes in, but there's no way to connect it back to marketing touchpoints.
Now map your website tracking. If you're using Google Analytics, check what events you're capturing. If you have pixels from Meta or other platforms, verify they're firing correctly. Look at your UTM parameter strategy—are you tagging campaigns consistently so you can track traffic sources?
Here's where it gets critical: identify your data gaps. Where do you lose visibility of the customer? Common blind spots include cross-device journeys (someone clicks an ad on mobile but converts on desktop), iOS users (Apple's privacy changes block many pixels), offline conversions (phone calls, in-store purchases), and the period between lead capture and closed deal.
Document everything in a simple spreadsheet. Create columns for data source, what it tracks, how it connects to other systems, and known limitations. This audit reveals the foundation you're building on—and the cracks you need to fix.
The reality for most teams? They're capturing maybe 60-70% of the actual customer journey. The rest is invisible, which means their attribution is built on incomplete data. You can't map what you can't see, so this audit is the essential first step. If you're struggling with visibility gaps, explore why many teams can't track customer journey accurately and how to fix it.
Step 2: Define Your Conversion Events and Micro-Conversions
Not all customer actions are created equal. Some signal serious intent. Others are just browsing behavior. To map journeys effectively, you need to define which events actually matter and how much they matter.
Start with your primary conversion events—the actions that directly generate business value. For ecommerce, that's purchases. For SaaS, it might be demo bookings, free trial signups, or paid subscriptions. For lead generation businesses, it's qualified leads or closed deals. List every conversion event that represents real business outcomes.
Now identify your micro-conversions. These are actions that don't immediately generate revenue but indicate a prospect is moving toward conversion. Someone viewing your pricing page is more valuable than someone just reading a blog post. Someone adding items to cart shows more intent than someone browsing category pages. Someone watching 75% of your product demo video is more engaged than someone who watched 10 seconds.
Common micro-conversions worth tracking include pricing page views, product page visits, cart additions, video watch percentages, PDF downloads, calculator tool usage, comparison page visits, and time spent on high-intent pages. The specific events depend on your business model and typical customer journey. Understanding customer journey touchpoints helps you identify which micro-conversions matter most.
Here's the part most teams skip: assign relative value or weight to each event. If a purchase is worth 100 points, maybe a demo booking is worth 80, a pricing page view is worth 30, and a blog post read is worth 5. These values help you understand which touchpoints contribute most to conversions, even if they don't directly cause them.
Document the typical sequence. What usually happens before a conversion? In B2B SaaS, you might see a pattern like: blog post read → product page visit → pricing page view → demo booking → closed deal. In ecommerce, it might be: social ad click → product page → cart add → abandon → retargeting ad → purchase. Understanding these sequences helps you identify the critical path to conversion.
Think about your own customer behavior. Do people typically convert on first visit, or does it take multiple exposures? How long is the consideration period? What content do they consume before buying? These insights shape how you'll interpret your journey map later.
The goal isn't to track everything—it's to track what matters. Focus on events that genuinely indicate progression toward conversion, not vanity metrics that look good but don't predict outcomes.
Step 3: Connect Your Data Sources Into a Unified Tracking System
This is where theory meets reality. You've identified your data sources and defined your events. Now you need to actually connect everything so data flows between systems and you can see complete customer journeys.
Start with server-side tracking. Browser-based pixels are increasingly unreliable thanks to iOS privacy features, ad blockers, and cookie restrictions. Server-side tracking captures events on your server before they reach the browser, which means you catch data that pixels miss. If you're using Meta, implement the Conversions API. For Google, set up enhanced conversions. These server-side connections dramatically improve data accuracy.
Next, integrate your ad platforms with your CRM. This creates closed-loop reporting—you can trace a customer's entire journey from first ad click through to revenue generated. Most modern CRMs offer native integrations with major ad platforms, or you can use middleware tools to connect them. The goal is automatic data sync so when a lead converts to a customer in your CRM, that information flows back to your ad platforms.
Cross-device and cross-domain tracking requires special attention. If your checkout is on a different domain than your main site, you need cross-domain tracking configured. If customers interact with your brand on multiple devices (clicking an ad on mobile, converting on desktop), you need user identification strategies. Email addresses are the most reliable identifier—when someone logs in or fills out a form, you can connect their previous anonymous behavior to their known identity.
Now comes the critical part: testing. Don't assume your tracking works. Manually test every conversion path. Click an ad, go through your funnel, and verify that events fire correctly at each step. Check that data appears in all your systems—ad platform, analytics, CRM. Test on different devices and browsers. Test with ad blockers enabled. Test iOS devices specifically since they have the most restrictions.
Use tools like Google Tag Assistant, Meta Pixel Helper, or your browser's developer console to verify events are firing. Look for errors, missing parameters, or events that should fire but don't. Common issues include pixels blocked by privacy settings, UTM parameters getting stripped during redirects, and events firing multiple times instead of once. Many marketers find that their paid ads underreporting conversions stems from these technical gaps.
This step takes time and technical effort. Many teams need developer help to implement server-side tracking correctly or fix cross-domain issues. But it's the foundation of accurate journey mapping. If your tracking is broken, everything you build on top of it will be wrong.
Step 4: Build Your Visual Journey Map With Attribution Paths
With your data flowing correctly, you can finally see what's actually happening. Now you'll visualize the paths customers take from first touch to conversion.
Start by pulling your data into a format where you can analyze sequences. Most attribution platforms and advanced analytics tools let you view "path to conversion" reports. These show the series of touchpoints each customer encountered before converting. If you're using Google Analytics 4, the "conversion paths" report shows this. If you're using a dedicated attribution platform like Cometly, you can see detailed multi-touch paths with all your marketing data connected.
Create a visual representation of the most common paths. You might discover that 40% of conversions follow a pattern like: Facebook ad → website visit → exit → Google search → return visit → conversion. Another 25% might follow: LinkedIn ad → pricing page → exit → retargeting ad → demo booking → conversion. Document the top 5-10 journey patterns that account for the majority of your conversions.
Identify where customers typically enter your ecosystem. What's the most common first touchpoint? For many B2B companies, it's organic search or LinkedIn ads. For ecommerce brands, it might be Meta ads or influencer content. Understanding first-touch patterns helps you know which channels are best at starting relationships versus closing them.
Now look at assist touchpoints—the interactions that happen between first touch and conversion. These are often undervalued because they don't get credit in last-click attribution. You might find that email nurture sequences, retargeting ads, or organic content visits frequently appear in successful conversion paths even though they rarely get the final click. Learn how to analyze customer journeys effectively to extract maximum insight from these patterns.
Pay special attention to drop-off points. Where do customers exit the journey without converting? If many people visit your pricing page but then disappear, that's a friction point. If people add items to cart but don't complete checkout, something's breaking down. These drop-offs reveal optimization opportunities—maybe your pricing is confusing, maybe your checkout process is too complex, maybe you're not retargeting effectively.
Use simple visual tools to map this out. A flowchart works well—show the common entry points, the typical sequence of touchpoints, the decision points where customers either progress or exit, and the final conversion. Color-code touchpoints by channel so you can quickly see which platforms appear most frequently in successful journeys.
The map should tell a story. Not just "people click ads and then convert," but the actual narrative of how awareness becomes consideration becomes decision. This visualization becomes your reference point for all optimization decisions.
Step 5: Analyze and Compare Attribution Models
Here's where most marketers discover their assumptions were wrong. The same customer journey looks completely different depending on which attribution model you apply.
Start with last-click attribution—the model most ad platforms use by default. This gives 100% credit to the final touchpoint before conversion. It's simple, but it systematically undervalues every touchpoint except the last one. In last-click, your retargeting campaigns look amazing because they often get the final click, while your prospecting campaigns that started the relationship get zero credit.
Now apply first-click attribution. This gives 100% credit to the first touchpoint. Suddenly your prospecting campaigns look valuable and your retargeting looks worthless. Neither view is complete—both are partially true but miss the bigger picture.
Linear attribution splits credit equally across all touchpoints. If someone had five interactions before converting, each gets 20% credit. This is more fair but treats a quick blog post visit the same as a demo booking, which doesn't reflect reality.
Time-decay attribution gives more credit to touchpoints closer to conversion. The logic is that recent interactions influenced the decision more than older ones. This often makes sense for longer sales cycles where early touchpoints started awareness but recent ones drove the final decision. Understanding attribution window best practices helps you configure these models correctly.
Position-based (U-shaped) attribution gives 40% credit to first touch, 40% to last touch, and splits the remaining 20% among middle touchpoints. This acknowledges that starting and closing the relationship are both critical.
Data-driven attribution uses machine learning to assign credit based on which touchpoints actually correlate with higher conversion rates. This is the most sophisticated approach but requires significant data volume to work accurately.
Compare how credit shifts between channels under each model. You'll likely find that some channels look great in last-click but terrible in first-click, or vice versa. Channels that frequently assist conversions but rarely get the last click will finally get recognition in multi-touch models. This concept of marketing attribution valuing the customer journey is essential for accurate budget decisions.
The right model depends on your business. Ecommerce with short consideration periods might use last-click or time-decay. B2B SaaS with long sales cycles might prefer position-based or data-driven. The key is choosing a model that reflects how your customers actually behave, not just defaulting to what's easiest.
With Cometly, you can view multiple attribution models side-by-side and switch between them instantly. This helps you understand which campaigns drive awareness, which ones nurture interest, and which ones close deals—giving you a complete picture instead of a single distorted view.
Step 6: Optimize Ad Spend Based on Journey Insights
Now comes the payoff. You have a complete view of customer journeys and accurate attribution. Time to make smarter budget decisions.
Start by reallocating budget to high-impact touchpoints your journey map revealed. If your analysis shows that LinkedIn ads frequently start relationships that eventually convert through other channels, those LinkedIn campaigns deserve more budget even if their last-click ROAS looks mediocre. If your retargeting campaigns get lots of last-click credit but rarely appear in journeys without prospecting campaigns first, you need both working together.
Feed enriched conversion data back to your ad platforms. When you connect your CRM to your ad accounts through server-side tracking, you can send back information about which leads became customers and how much revenue they generated. Meta's algorithm can then optimize for customers, not just leads. Google can target people similar to your highest-value converters, not just anyone who clicked. This conversion sync for Facebook Ads dramatically improves campaign performance.
This feedback loop dramatically improves targeting quality. Instead of ad platforms optimizing for clicks or basic conversions, they optimize for the outcomes that actually matter to your business. The algorithms get smarter because they're learning from complete data, not just the fragments that pixels capture.
Create audiences based on journey stage. Someone who visited your pricing page twice but hasn't converted is in a different mindset than someone who just discovered you. Build separate audiences for awareness stage, consideration stage, and decision stage. Then show each group messaging that matches where they are in the journey.
Set up ongoing monitoring. Customer journeys aren't static—they evolve as your market changes, new channels emerge, and competitor activity shifts. Schedule monthly reviews of your journey map. Look for changes in common paths, new drop-off points, or shifts in which touchpoints drive conversions. When iOS releases privacy updates or ad platforms change their algorithms, your journey map will show you the real impact. Using customer journey analytics tools makes this ongoing monitoring much easier.
Test new touchpoint sequences. If your map shows most customers need five interactions before converting, experiment with campaigns designed to accelerate that journey. Maybe a strong retargeting sequence can reduce it to three. Maybe adding email nurture at a specific point improves conversion rates. Your journey map becomes a testing roadmap.
The goal isn't perfection—it's continuous improvement. Every optimization cycle should make your journey map more accurate and your spending more efficient. You're building a system that gets smarter over time, not just making one-time improvements.
Your Journey Mapping Action Plan
You now have the complete framework for mapping customer journeys in paid advertising. Let's recap the essential steps you need to take.
First, audit your current data sources. Document every ad platform, your CRM setup, website tracking, and most importantly, identify where you're losing visibility. You can't map what you can't see, so fixing data gaps is priority one.
Second, define your conversion events and micro-conversions. Know which actions matter and how much they matter. This clarity helps you understand which touchpoints genuinely move customers toward conversion versus vanity metrics that look good but don't predict outcomes.
Third, connect everything into a unified tracking system. Implement server-side tracking, integrate your CRM with ad platforms, and test thoroughly. This technical foundation ensures you're capturing complete customer journeys, not just fragments. The right customer journey tracking software makes this integration seamless.
Fourth, build your visual journey map. Identify the most common paths to conversion, where customers enter, what assists conversions, and where they drop off. This visualization reveals the story of how your marketing actually works.
Fifth, analyze and compare attribution models. See how credit shifts between channels under different models. Choose an approach that reflects your actual customer behavior, not just the default last-click view that systematically undervalues most of your marketing.
Sixth, optimize based on insights. Reallocate budget to high-impact touchpoints, feed better data back to ad platforms, create journey-stage audiences, and set up ongoing monitoring. Turn your map into action.
Remember that journey mapping is ongoing work, not a one-time project. Customer behavior evolves. New channels emerge. Privacy regulations change. Your map needs to evolve with them. Schedule regular reviews and updates to keep your view accurate.
The marketers who master journey mapping gain a massive competitive advantage. While others are flying blind, optimizing for last-click metrics that don't reflect reality, you'll understand the complete picture. You'll know which campaigns start relationships, which ones nurture interest, and which ones close deals. You'll allocate budget based on actual impact, not distorted attribution.
Ready to elevate your marketing game with precision and confidence? Discover how Cometly's AI-driven recommendations can transform your ad strategy—Get your free demo today and start capturing every touchpoint to maximize your conversions.