You're spending thousands on ads across Meta, Google, TikTok, and LinkedIn. Leads are coming in. Some convert. But when you look at your revenue report at the end of the month, you have no idea which channel actually drove those sales. Was it the Facebook campaign that got the first click? The Google ad they clicked three days later? The email that finally pushed them over the edge?
This guessing game costs marketers millions in wasted budget every year. Without clear revenue attribution by source, you're flying blind—scaling campaigns that might be losing money while starving the channels that actually drive profit.
Revenue tracking by marketing source solves this problem by connecting every dollar of revenue back to the specific touchpoint that generated it. Instead of optimizing for clicks, impressions, or even leads, you optimize for what actually matters: revenue.
This guide walks you through the complete setup process, from mapping your customer journey to building automated revenue reports that show exactly which marketing investments pay off. By the end, you'll have a system that tracks revenue at the source level, letting you make budget decisions with confidence instead of guesswork.
Whether you're running a multi-channel paid strategy, investing heavily in content, or mixing organic and paid efforts, accurate source-level attribution changes everything about how you allocate budget and scale campaigns.
Step 1: Map Your Customer Journey and Revenue Events
Before connecting any tools or platforms, you need to understand exactly how customers move through your marketing ecosystem and what counts as revenue in your business.
Start by listing every touchpoint where prospects interact with your marketing. This includes paid ads on Meta, Google, TikTok, and LinkedIn. It includes organic search traffic, direct visits, email campaigns, referral sources, and retargeting ads. Don't forget offline touchpoints if you run events, direct mail, or phone outreach that eventually leads to online conversions.
The goal is to create a comprehensive map of every possible entry point and interaction point in your funnel. Most B2B buyers touch 7-12 marketing interactions before converting. E-commerce and lower-consideration purchases might convert in 2-4 touches. Understanding your typical journey length helps you choose the right attribution model later. A solid marketing funnel tracking system makes this mapping process significantly easier.
Next, define what revenue means for your business. For e-commerce, it's straightforward: completed purchases with clear dollar values. For SaaS companies, revenue might be the first month's subscription value, annual contract value, or lifetime value depending on how you measure success. For service businesses, it could be signed contracts or project deposits.
Document these revenue events clearly. If you have multiple product tiers or service packages, list each one with its corresponding value. If customers can upgrade or expand over time, decide whether you'll track only initial revenue or total customer value.
Create a simple spreadsheet with three columns: touchpoint type, typical position in journey, and revenue event it leads to. This becomes your reference document as you configure tracking in the following steps.
The clearer you are about your customer journey and revenue definition now, the more accurate your attribution will be later. Skipping this step leads to messy data and reports that don't match your actual business model.
Step 2: Connect Your Ad Platforms and Traffic Sources
Now that you understand your customer journey, it's time to connect the platforms where that journey begins. Every ad platform and traffic source needs to feed data into your attribution system for complete visibility.
Start with your paid advertising platforms. If you run Meta ads, connect your Facebook Ads Manager account to your attribution platform. Do the same for Google Ads, TikTok Ads, LinkedIn Campaign Manager, and any other paid channels you use. Most modern attribution platforms offer native integrations that pull spend data, impressions, clicks, and conversions automatically.
The connection process typically requires granting API access. In Meta, this means adding your attribution platform as a partner in Business Settings. In Google Ads, you'll link accounts through the Google Ads API. Follow your attribution platform's specific instructions for each integration. Learning how to connect marketing data sources properly is essential for accurate attribution.
Once connected, verify that data is flowing correctly. Check that yesterday's spend appears in your attribution dashboard. Confirm that click and impression data matches what you see in the native ad platform. Any discrepancies now will compound into major attribution errors later.
Next, implement consistent UTM parameters across every campaign. UTM parameters are the tags you add to URLs that identify traffic source, medium, campaign name, and other details. Without consistent UTMs, your attribution system can't differentiate between campaigns from the same platform.
Create a UTM naming convention document and stick to it religiously. Use lowercase consistently. Avoid spaces (use underscores or hyphens). Be specific enough to identify individual campaigns but not so granular that you create hundreds of unique source combinations. Understanding what UTM tracking is and how it helps your marketing will make this process much smoother.
For example: utm_source=facebook, utm_medium=paid_social, utm_campaign=q2_lead_gen, utm_content=carousel_ad_v2. Every team member running ads needs to follow this exact format.
Here's where server-side tracking becomes critical. Browser-based tracking alone misses up to 30-40% of conversions due to iOS App Tracking Transparency restrictions, ad blockers, and third-party cookie deprecation. Server-side tracking captures conversion data on your server before sending it to your attribution platform, bypassing browser limitations.
Configure server-side tracking for marketing through your attribution platform's documentation. This typically involves adding server-side API calls that fire when revenue events occur. For example, when someone completes a purchase, your server sends that conversion data directly to your attribution platform along with the user's click ID or session identifier.
Test each connection thoroughly before moving forward. Run a small test campaign, click through it yourself, and verify that the click appears in your attribution dashboard with the correct source and UTM parameters. This validation step catches configuration issues early when they're easy to fix.
Step 3: Link Your CRM and Revenue Data
Your CRM holds the revenue data that makes attribution meaningful. Without connecting it to your attribution platform, you can track clicks and leads all day but never know which campaigns actually drove revenue.
Start by connecting your CRM to your attribution platform. If you use HubSpot, Salesforce, Pipedrive, or another major CRM, your attribution platform likely offers a native integration. Navigate to your attribution platform's integrations page and follow the connection process for your specific CRM.
The integration typically requires admin-level access to your CRM and permission to read deal and contact data. You'll authenticate through OAuth, granting your attribution platform access to sync records in real time or on a scheduled basis. Understanding how to connect marketing data to revenue is the foundation of effective attribution.
Once connected, the critical step is field mapping. Your CRM stores revenue data in specific fields—deal amount, closed amount, annual contract value, or similar. Your attribution platform needs to know exactly which field contains the revenue number to attribute back to marketing sources.
Open your attribution platform's CRM settings and map the revenue field correctly. If you have multiple revenue fields (like deal amount vs. annual recurring revenue), choose the one that represents actual closed revenue, not projected or pipeline value.
Also map the deal stage or status field. This tells your attribution platform which deals count as closed-won revenue versus still-in-progress opportunities. Only closed-won deals should contribute to revenue attribution reports. Mapping this correctly prevents your reports from counting pipeline as actual revenue.
If your sales cycle involves multiple stages (lead, qualified, proposal, negotiation, closed), configure your attribution platform to track progression through these stages. This gives you visibility into which marketing sources generate leads that actually advance through your pipeline, not just those that enter at the top.
Set up contact and company-level tracking if your CRM supports it. This allows your attribution platform to connect multiple touchpoints to the same person or account over time, building a complete picture of the journey from first click to closed deal.
Test the integration by creating a test opportunity in your CRM with a known dollar amount and marking it as closed-won. Within a few minutes (or after the next sync cycle), that test deal should appear in your attribution platform with the correct revenue value. If it doesn't, double-check your field mapping and sync settings.
This connection between marketing touchpoints and CRM revenue is what transforms your attribution from a vanity metric dashboard into a genuine revenue intelligence system.
Step 4: Install Website Tracking for Full Journey Visibility
Your website is where most customer journeys happen. Someone clicks an ad, lands on your site, browses multiple pages, maybe leaves and comes back later, and eventually converts. Without website tracking, you miss all the behavior between the first click and final conversion.
Install your attribution platform's tracking script on every page of your website. This is typically a JavaScript snippet you add to your site's header or through a tag manager like Google Tag Manager. The script tracks visitor sessions, page views, and identifies returning visitors across multiple sessions.
If you use Google Tag Manager, create a new tag for your attribution platform's tracking code. Set it to fire on all pages. Publish the container and verify the tag fires correctly using GTM's preview mode. A comprehensive digital marketing tracking guide can help you navigate this setup process.
First-party data collection is essential for accurate tracking in today's privacy-focused environment. Third-party cookies are being phased out across browsers, but first-party tracking—where your own domain sets the cookie—remains reliable and privacy-compliant.
Configure your attribution platform to use first-party cookies. This often involves setting up a custom subdomain (like track.yourdomain.com) that your attribution platform uses for cookie setting and data collection. Your attribution platform's documentation will walk through the DNS configuration needed.
Next, set up conversion tracking on key pages. These are the pages visitors see only after completing a revenue event—thank you pages after checkout, confirmation pages after booking a demo, success pages after signing up for a trial.
Add conversion tracking code to these pages. This code tells your attribution platform that a revenue event just occurred and passes the transaction details (revenue amount, product purchased, customer ID) back to the platform for attribution.
For e-commerce sites, your conversion tracking should capture order ID, total revenue, and ideally product-level details. For lead generation businesses, track form submissions on demo request or contact pages, passing through any information collected in the form.
Use your browser's developer tools to verify tracking fires correctly. Open your site, open the browser console (F12 in most browsers), and navigate through a test conversion. You should see network requests firing to your attribution platform's tracking endpoint. Check that the data payload includes the correct conversion information.
Most attribution platforms also offer a debug mode or testing extension that shows you in real time what's being tracked. Install this tool and run through your conversion flow to catch any tracking gaps before real customer data starts flowing.
Website tracking is the connective tissue that links ad clicks to revenue events. Get this right and your attribution becomes dramatically more accurate.
Step 5: Choose and Configure Your Attribution Model
An attribution model is the rule set that decides how credit for a conversion gets distributed across the multiple touchpoints in a customer journey. The model you choose significantly impacts which channels appear to drive revenue.
First-touch attribution gives 100% credit to the first marketing interaction. If someone clicked a Facebook ad, then came back three times through Google and email before buying, Facebook gets all the credit. This model favors top-of-funnel awareness channels but ignores everything that happened after the first touch.
Last-touch attribution does the opposite—100% credit goes to the final touchpoint before conversion. In the same scenario, email would get all the credit. This model favors bottom-of-funnel channels but ignores the awareness and consideration work that happened earlier. Our attribution marketing tracking complete guide breaks down each model in detail.
Linear attribution distributes credit equally across all touchpoints. If there were five interactions before conversion, each gets 20% credit. This model is more balanced but treats all touchpoints as equally important, which isn't always realistic.
Time-decay attribution gives more credit to touchpoints closer to conversion, assuming recent interactions matter more. The first touch might get 10% credit, middle touches get 20%, and the final touch gets 40%.
Data-driven or algorithmic attribution uses machine learning to analyze conversion patterns across your entire dataset and assigns credit based on which touchpoints statistically correlate with conversion. This is the most sophisticated approach but requires substantial data volume to work effectively.
For most businesses, the right model depends on your sales cycle length. If you have a short sales cycle (hours or days from first touch to purchase), last-touch or time-decay models often work well. If you have a long sales cycle (weeks or months), multi-touch models like linear or data-driven better reflect the multiple influences on a purchase decision.
Configure your chosen model in your attribution platform's settings. Most platforms let you select from standard models or customize your own weighting. Start with a standard model that matches your sales cycle, then refine based on what you learn from the data.
Here's a critical insight: don't rely on just one model. Configure your platform to show multiple attribution models side by side. Compare how first-touch, last-touch, and linear attribution distribute credit differently across your channels. The patterns you see reveal which channels drive awareness versus which close deals.
If a channel gets high credit in first-touch but low credit in last-touch, it's an awareness driver. If it gets low first-touch credit but high last-touch credit, it's a closer. Understanding these roles helps you optimize each channel for its actual function in your funnel.
Step 6: Build Revenue Reports by Source and Campaign
With all your data sources connected and your attribution model configured, it's time to build the reports that show which marketing sources actually drive revenue.
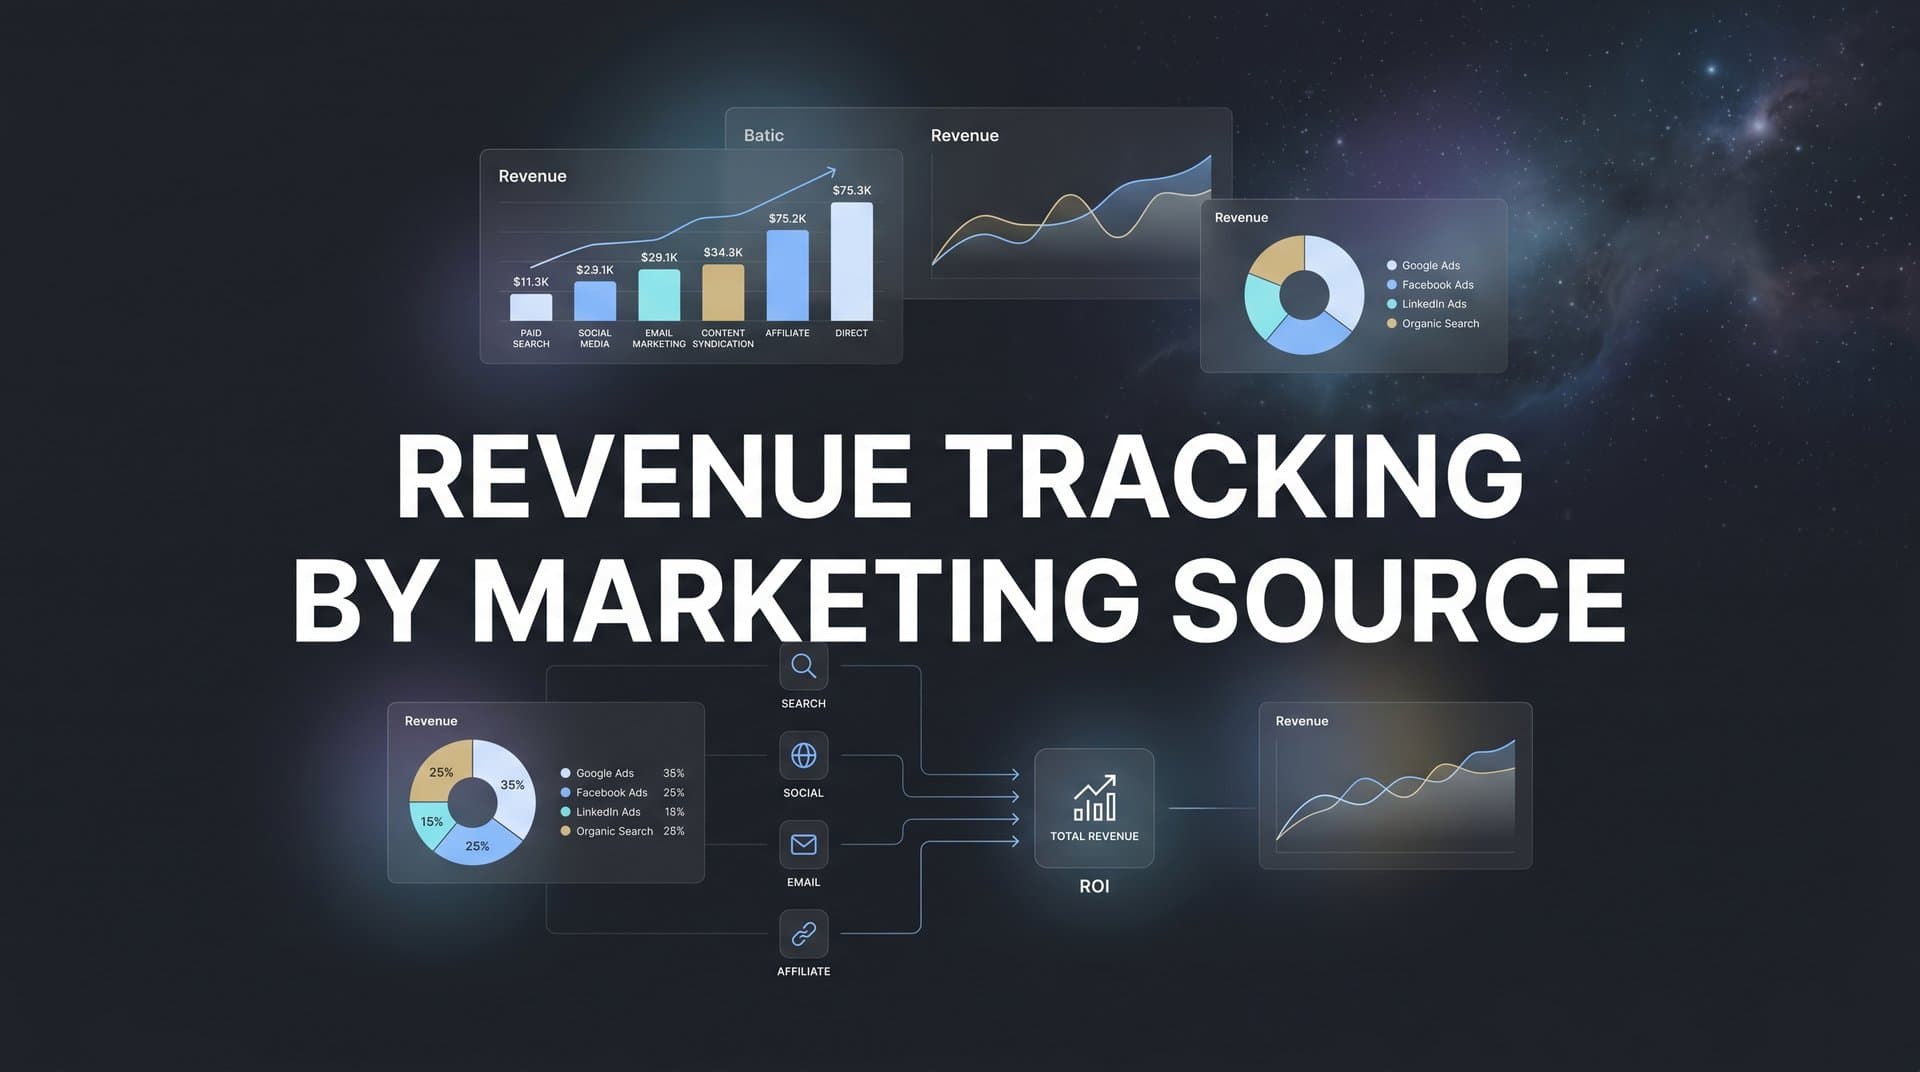
Start with a source-level revenue report. This shows total attributed revenue broken down by marketing source: paid social, paid search, organic search, email, direct traffic, referral, and any other sources in your mix. This high-level view immediately reveals which channels contribute most to your bottom line. Effective revenue tracking across marketing channels requires this foundational report.
Create this report in your attribution platform's dashboard builder. Add a table or chart showing each source with its attributed revenue over your chosen time period. Include the number of conversions from each source alongside revenue so you can see both volume and value.
Next, drill down to campaign-level detail. Within paid social, which specific campaigns drive the most revenue? Within paid search, which keyword groups or ad groups perform best? This granular view is where optimization opportunities become obvious.
Build a campaign performance report that shows each campaign's attributed revenue, spend, and ROAS (return on ad spend). ROAS is calculated as attributed revenue divided by ad spend. A campaign with 100,000 dollars in attributed revenue and 20,000 dollars in spend has a 5x ROAS.
Sort this report by ROAS to instantly identify your best and worst performers. Campaigns with ROAS above your target threshold are winners to scale. Campaigns below threshold need optimization or should be paused. The right marketing performance tracking software makes building these reports straightforward.
Go even deeper with ad-level revenue attribution. Which specific ad creatives, headlines, or audience segments drive the most revenue per dollar spent? This level of detail lets you double down on winning creative concepts and audience targeting strategies.
Include time-based analysis in your reports. How does revenue attribution by source change week over week or month over month? Spotting trends early lets you capitalize on improving channels and fix declining ones before they waste significant budget.
Set up automated reports that deliver these insights to your inbox weekly or monthly. Most attribution platforms let you schedule report emails to your team. Configure a weekly revenue summary that shows top sources, campaigns, and any significant changes from the previous week.
Build separate reports for different stakeholders. Your CEO wants to see total revenue by source. Your paid social manager needs campaign-level detail for Meta ads. Your CFO wants ROAS by channel with month-over-month trends. Create tailored views for each audience.
The power of these reports isn't just seeing the data—it's making them accessible and actionable for everyone who makes marketing decisions. When your entire team can see which sources drive revenue, budget allocation becomes a data-driven conversation instead of guesswork and politics.
Step 7: Optimize Budget Allocation Based on Revenue Data
Revenue attribution data is only valuable if you act on it. The final step is using your reports to continuously optimize where you spend your marketing budget.
Start by identifying your highest-performing channels and campaigns. Sort your revenue reports by ROAS and look for campaigns consistently delivering above your target return. These are your proven revenue drivers that deserve more budget.
Calculate how much you can scale these winners before hitting diminishing returns. Not every campaign can scale infinitely—audience size, market demand, and competition all impose limits. Increase budgets gradually (10-20% at a time) while monitoring ROAS to find the optimal spend level. Implementing accurate revenue attribution tracking ensures your scaling decisions are based on reliable data.
Next, identify underperformers. Campaigns with ROAS below your minimum threshold are burning budget without adequate return. Pause these campaigns or reduce their budgets significantly while you investigate why they're underperforming.
Sometimes low ROAS indicates poor targeting or creative. Other times it means the channel itself isn't a good fit for your offer. Use your attribution data to diagnose the issue. If a channel performs well in first-touch attribution but poorly in last-touch, it might be a valuable awareness driver even if it doesn't directly close deals.
Implement conversion sync to feed your revenue data back to ad platforms. Conversion sync sends enriched conversion events from your attribution platform back to Meta, Google, and other ad platforms. This gives their algorithms better data to optimize toward actual revenue instead of proxy metrics like link clicks or landing page views.
Platforms like Cometly automatically sync conversion data back to ad platforms, improving their machine learning models' ability to find customers who actually buy, not just those who click. This creates a feedback loop where your attribution data makes your ads perform better over time.
Establish a regular review cadence for budget optimization. Weekly reviews catch performance shifts quickly. Monthly reviews provide enough data to spot meaningful trends. Quarterly reviews are good for strategic channel decisions like entering or exiting platforms.
During each review, ask three questions: Which campaigns should get more budget? Which should get less or be paused? What new tests should we run based on what's working? This systematic approach to optimization compounds over time, gradually shifting your entire budget toward proven revenue drivers.
Turning Data Into Growth
You've now built a complete revenue tracking system that connects every marketing touchpoint to actual revenue. Your ad platforms feed click and spend data into your attribution platform. Your website tracks the full customer journey. Your CRM syncs closed deals with their dollar values. Your attribution model distributes credit appropriately. And your reports show exactly which sources, campaigns, and ads drive real revenue.
This visibility transforms marketing from an art into a science. You no longer guess which channels work—you know. You don't wonder if that new campaign is profitable—you see the ROAS in real time. Budget allocation becomes a data-driven process instead of a political negotiation.
The marketers who win in the coming years are those who master revenue attribution. Ad platforms are getting more expensive. Privacy regulations are making tracking harder. The only sustainable advantage is knowing precisely where your revenue comes from and optimizing relentlessly toward those sources.
Review your attribution reports weekly. Look for campaigns that suddenly improve or decline. Test new channels with clear success metrics based on attributed revenue. As your data accumulates over months, you'll develop increasingly accurate insights into what actually drives growth for your specific business.
The system you've built isn't static—it's a living intelligence layer that gets smarter as more data flows through it. Keep your integrations healthy. Audit your tracking quarterly to catch any gaps. Update your attribution model as your business evolves. The compound effect of continuous optimization based on accurate revenue data is what separates scaling businesses from stagnant ones.
Ready to elevate your marketing game with precision and confidence? Discover how Cometly's AI-driven recommendations can transform your ad strategy—Get your free demo today and start capturing every touchpoint to maximize your conversions.