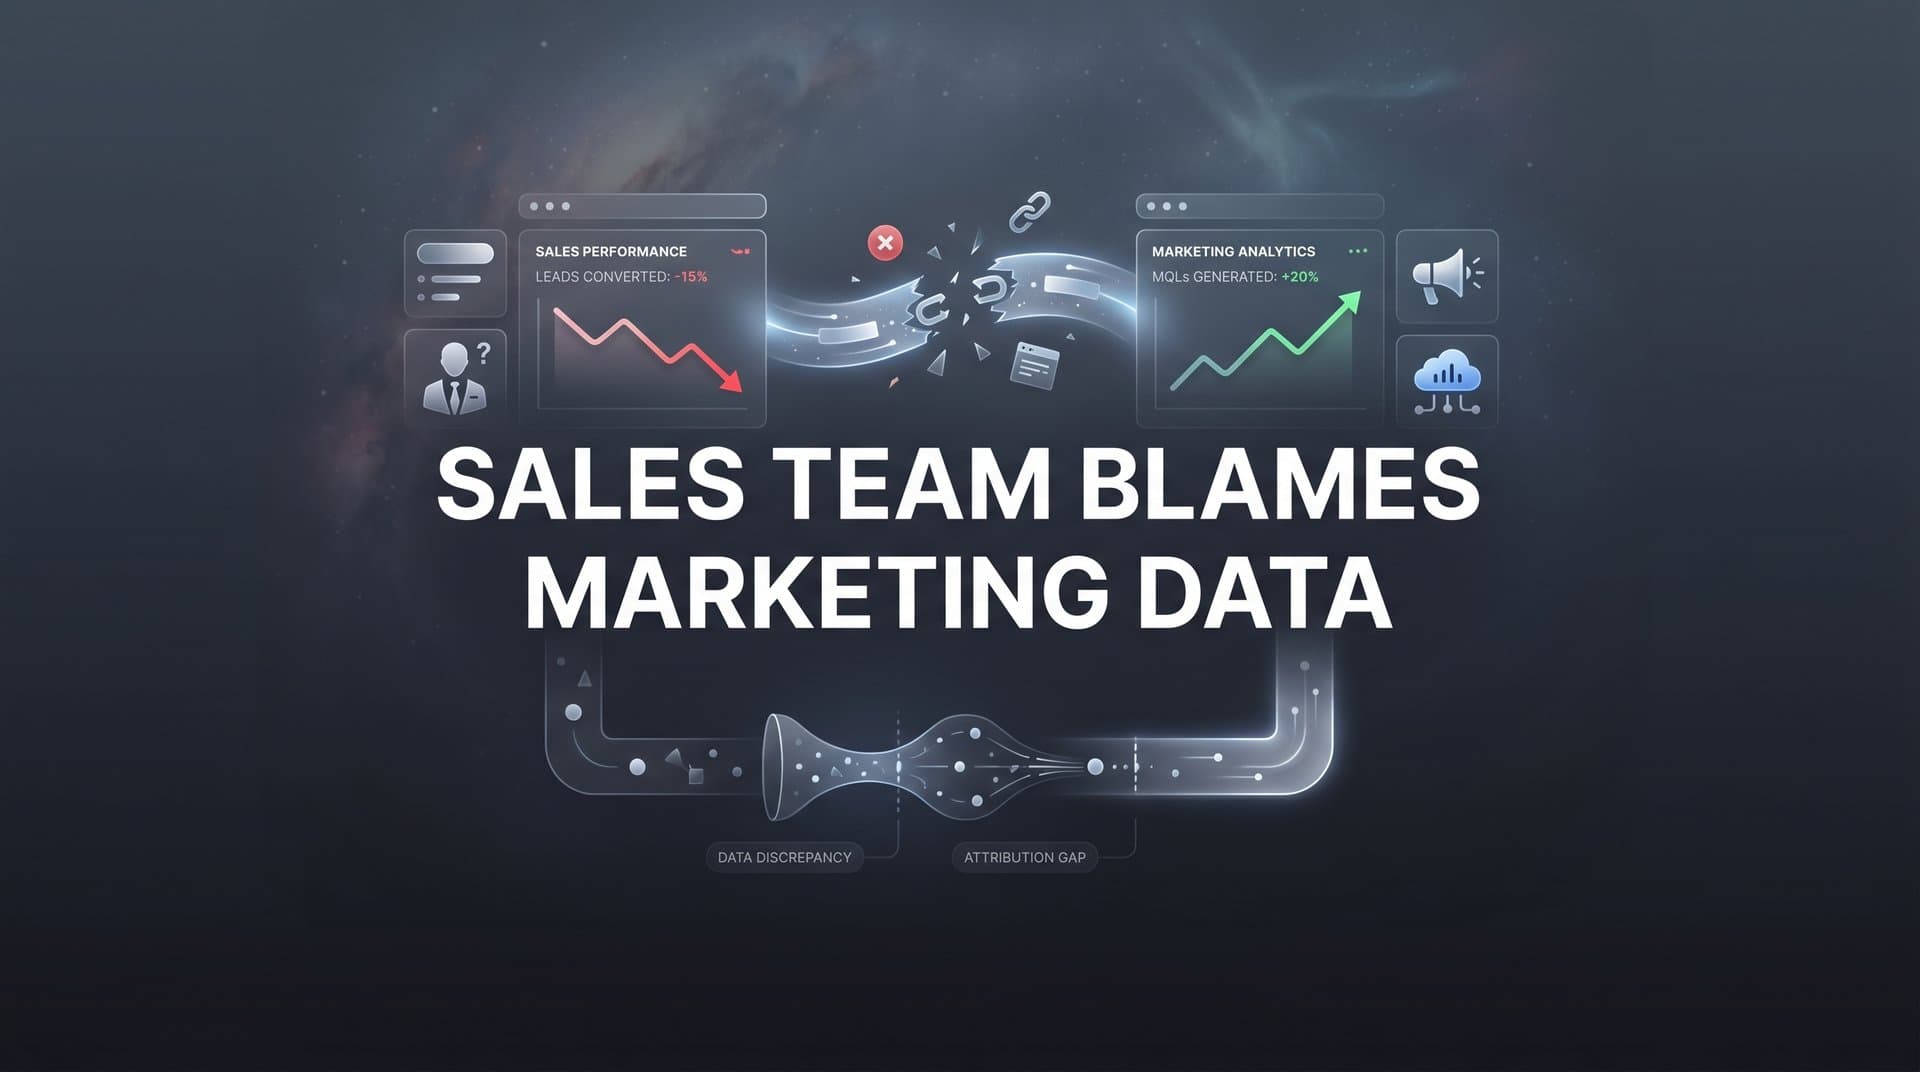
The friction is familiar: sales says the leads are junk, marketing says the leads are qualified, and both teams point at the data to prove their case. When your sales team blames marketing data for missed quotas or poor pipeline quality, it is rarely just a data problem. It is an alignment problem, a tracking problem, and often a trust problem all rolled into one.
The root cause usually comes down to disconnected systems, inconsistent definitions, and a lack of shared visibility into what is actually driving revenue. Marketing looks at click-through rates and cost per lead. Sales looks at close rates and deal size. Without a single source of truth connecting ad clicks to closed deals, both teams end up working from incomplete pictures and blaming each other for the gaps.
The privacy landscape has made this worse. Browser-based tracking has become less reliable due to iOS changes and cookie deprecation, which means marketing data often looks incomplete or inconsistent to sales teams who are already skeptical. When the numbers do not add up, the blame cycle accelerates.
The good news is that this is a solvable problem. The following seven strategies will help you bridge the gap between marketing and sales data, eliminate the finger-pointing, and build a reporting framework both teams actually trust. Start with the foundation and build from there.
1. Create a Shared Revenue Dictionary Before Touching Any Dashboards
The Challenge It Solves
Marketing and sales often use the same words to mean completely different things. When marketing calls a lead "qualified" and sales calls that same lead "garbage," you do not necessarily have a lead quality problem. You might just have a definition problem. Without shared language around what constitutes a Marketing Qualified Lead, a Sales Qualified Lead, a conversion, or a win, every data conversation becomes a debate about semantics rather than strategy.
The Strategy Explained
Before you build any new dashboards or implement any new tools, get both teams in a room and agree on definitions. What exactly makes a lead qualified? What actions move someone from MQL to SQL? What counts as a conversion in your CRM versus your ad platform? These definitions need to be documented, shared, and enforced across every system your teams use.
This is not a one-time exercise. As your business evolves, your definitions need to evolve with it. A shared revenue dictionary becomes the foundation every other strategy in this list is built on. Without it, even the most sophisticated attribution model will produce numbers that each team interprets differently. Addressing marketing analytics data inconsistencies starts with getting everyone on the same page about what the data actually means.
Implementation Steps
1. Schedule a joint workshop with sales leadership, marketing leadership, and any revenue operations stakeholders to define every stage of your funnel from first touch to closed deal.
2. Document agreed definitions in a shared location, such as a Notion page, Google Doc, or your CRM's internal wiki, and make it accessible to every team member who touches pipeline data.
3. Audit your CRM and marketing automation platform to ensure stage names, field values, and conversion events reflect the agreed definitions. Rename anything that creates ambiguity.
4. Schedule a quarterly review to revisit definitions as your product, market, or sales motion changes.
Pro Tips
Assign ownership of the revenue dictionary to a revenue operations or data function rather than marketing or sales individually. When one team owns the definitions, the other team will always question the objectivity. Neutral ownership reduces political friction and keeps the document credible to both sides.
2. Connect Ad Platform Data to CRM Outcomes with Full-Funnel Tracking
The Challenge It Solves
One of the most common reasons sales teams distrust marketing data is that marketing reports on metrics that stop at the lead stage. Impressions, clicks, and form fills look great in a marketing dashboard but say nothing about whether those leads ever became customers. When sales cannot trace a closed deal back to a specific campaign or ad, they have no reason to trust that marketing is spending budget wisely.
The Strategy Explained
Full-funnel tracking means following every prospect from their first interaction with an ad through every touchpoint in your CRM until a deal is won or lost. This requires server-side tracking to capture data that browser-based pixels increasingly miss, and it requires your ad platform data and CRM data to be connected in a way that preserves the original source attribution throughout the entire journey. Learning how to connect marketing data to revenue is the critical first step in closing this visibility gap.
Server-side tracking has become a best practice precisely because browser limitations, ad blockers, and privacy changes have eroded the reliability of client-side pixels. When your tracking infrastructure is solid, marketing can show sales exactly which campaigns are generating the leads that actually close. That changes the conversation entirely.
Cometly's server-side tracking is built to handle this connection, capturing every ad click and tying it to downstream CRM events so nothing falls through the gaps between your ad platforms and your pipeline data.
Implementation Steps
1. Audit your current tracking setup to identify where data loss occurs. Common gaps include form submissions that fire only client-side, CRM stages that are never passed back to your analytics layer, and ad platform pixels that are blocked by browsers or privacy settings.
2. Implement server-side event tracking so that key conversion events, including form fills, demo requests, and CRM stage changes, are captured reliably regardless of browser behavior.
3. Pass a consistent lead identifier, such as an email hash or CRM contact ID, through every system so you can join ad platform data to CRM outcomes without losing attribution along the way.
4. Validate your tracking by running a sample of recent closed deals backward through your data to confirm that each deal has a traceable first-touch source.
Pro Tips
Do not wait until your tracking is perfect to start this process. Capture what you can now, document the gaps you find, and improve incrementally. Partial full-funnel data is still far more valuable than marketing metrics that stop at the lead stage.
3. Replace Last-Click Attribution with Multi-Touch Models Both Teams Trust
The Challenge It Solves
Last-click attribution is one of the most common sources of sales-marketing conflict. When marketing reports that a campaign drove conversions based on last-click, sales often pushes back because they know the actual deal involved multiple touchpoints over weeks or months. Last-click models make some channels look like heroes and others look useless, which creates distorted budget decisions and undermines credibility with anyone who has seen a deal up close.
The Strategy Explained
Multi-touch attribution models distribute credit across every touchpoint that influenced a conversion. Depending on your sales cycle and business model, you might use a linear model that gives equal credit to every touchpoint, a time-decay model that weights recent interactions more heavily, or a custom model built around the specific touchpoints that matter most in your funnel. A solid understanding of data science marketing attribution helps teams select the right model for their business.
The goal is not to find the one perfect attribution model. The goal is to use a model that both teams agree is a fair representation of how your buyers actually make decisions. When sales and marketing are looking at the same attribution logic and both agree it is reasonable, the data becomes a tool for collaboration rather than a weapon for blame.
Cometly's multi-touch attribution capabilities let you compare models side by side so you can see how credit shifts depending on the model you apply. That transparency makes it easier to have honest conversations about which channels are genuinely contributing to revenue.
Implementation Steps
1. Map your typical buyer journey by reviewing a sample of recently closed deals and identifying every touchpoint recorded in your CRM and ad platforms from first contact to close.
2. Select two or three attribution models to evaluate, such as first-touch, linear, and time-decay, and run your last quarter's closed revenue through each model to see how credit distribution changes.
3. Present the comparison to both sales and marketing leadership and facilitate a discussion about which model most accurately reflects how your buyers behave.
4. Adopt the agreed model as your default for shared reporting while keeping the ability to switch models for specific analyses.
Pro Tips
Avoid letting either team pick the attribution model in isolation. When marketing chooses the model, sales will assume it is designed to make marketing look good. When sales chooses it, marketing will feel unfairly penalized. Make the selection a joint decision with documented rationale.
4. Build a Single Dashboard Sales and Marketing Both Report From
The Challenge It Solves
Competing dashboards are a structural cause of blame. When marketing pulls their numbers from one tool and sales pulls theirs from another, discrepancies are inevitable. Each team selectively highlights the metrics that support their narrative, and the resulting debates are about whose data is right rather than what the business should do next. Two dashboards means two versions of reality, and that is a recipe for ongoing conflict.
The Strategy Explained
A single shared dashboard does not mean one team gives up their reporting tools. It means both teams agree on a primary source of truth for the metrics that connect their work: lead volume, lead quality by source, pipeline created, pipeline converted, and revenue by channel. Every other report either team uses should be supplementary to this shared view, not a replacement for it. Building unified dashboards for marketing and sales attribution is one of the most effective ways to end the competing-reports problem.
The shared dashboard should be built on data that neither team controls unilaterally. It should pull from your CRM, your ad platforms, and your tracking infrastructure simultaneously, and it should display metrics that are meaningful to both functions. When both teams walk into a review meeting looking at the same numbers, the conversation shifts from "your data is wrong" to "what do we do about this."
Cometly's analytics dashboard is designed for exactly this use case, connecting ad spend data to pipeline and revenue outcomes in a single view that both marketing and sales can reference without needing to reconcile competing reports.
Implementation Steps
1. Identify the five to eight metrics that both teams care about and that span the full funnel from ad spend to closed revenue. These become the core of your shared dashboard.
2. Agree on the data sources for each metric. Document which system is the authoritative source for each number so there is no ambiguity about where the data comes from.
3. Build the dashboard in a tool that both teams have access to and that updates automatically. Manual dashboards that require someone to refresh them introduce human error and erode trust over time.
4. Retire or clearly label any competing dashboards as supplementary so teams know which view is the official shared source of truth.
Pro Tips
Put the shared dashboard on a screen in your office or as the default view in your weekly revenue meetings. Visibility creates accountability. When both teams see the same numbers regularly, they stop building alternative narratives and start solving problems together.
5. Feed Better Conversion Data Back to Ad Platforms to Improve Lead Quality
The Challenge It Solves
One of the most frustrating complaints from sales is that the leads coming from paid ads are simply not the right people. They are not in the right industry, the right company size, or the right buying stage. This is often a signal that your ad platforms are optimizing for the wrong conversion events. If you are feeding Meta or Google only form-fill data, their algorithms learn to find people who fill out forms, not people who become customers. The result is volume without quality.
The Strategy Explained
Major ad platforms including Meta and Google support the ability to send downstream conversion events back to their algorithms through tools like the Conversions API and offline conversion imports. When you send events like "SQL created," "demo completed," or "deal closed" back to the platform, you are telling the algorithm what a good outcome actually looks like. Over time, the algorithm adjusts its targeting to find more people who resemble your actual customers rather than just your form fillers.
This practice is sometimes called conversion sync or offline conversion tracking, and it is one of the most direct ways marketing can address the lead quality complaints that sales teams raise. Understanding why marketing data accuracy matters for ROI helps both teams appreciate the importance of feeding clean signals back to ad platforms. When sales sees that the leads coming through paid channels are better aligned with their ideal customer profile, the blame cycle starts to break down.
Cometly's Conversion Sync feature is built specifically for this purpose, sending enriched conversion data back to Meta, Google, and other ad platforms so their algorithms optimize for the outcomes that actually matter to your business.
Implementation Steps
1. Identify the downstream conversion events that best represent lead quality from sales' perspective. SQLs and closed-won deals are typically the most valuable signals to send back to ad platforms.
2. Set up your Conversions API or offline conversion import for each ad platform you run. Most major platforms have documentation for this process, and tools like Cometly can automate the data sync.
3. Give the algorithm time to learn. Most platforms need a meaningful volume of conversion events before the targeting improvements become visible. Set expectations with sales that this is a gradual improvement, not an overnight fix.
4. Track lead quality metrics over time by comparing SQL rates and close rates for leads generated before and after the conversion sync was implemented.
Pro Tips
Include sales in the conversation about which conversion events to send back to the platforms. When sales has input into what signals are being used to train the algorithm, they feel ownership over the lead quality improvement process rather than waiting passively for marketing to fix a problem.
6. Run Bi-Weekly Data Alignment Meetings with a Structured Agenda
The Challenge It Solves
Even the best data infrastructure breaks down without regular human alignment. Definitions drift. New campaigns launch without being communicated to sales. Sales changes their qualification criteria without telling marketing. Over time, small misalignments compound into major disconnects, and the next data review becomes a confrontation rather than a collaboration. The absence of structured communication is often what turns a data discrepancy into a blame cycle.
The Strategy Explained
A bi-weekly data alignment meeting is not a status update or a performance review. It is a structured forum where sales and marketing review shared data together, flag discrepancies early, and make joint decisions about how to respond. The key word is structured. Focusing on improving marketing team collaboration with analytics ensures these meetings produce actionable outcomes rather than devolving into finger-pointing sessions. Without a consistent agenda, these meetings drift into venting sessions or get canceled when things get busy.
The meeting should be short, focused, and owned by a neutral facilitator, ideally someone in revenue operations or a senior leader who is accountable to both functions. The agenda should be the same every time so both teams know what to expect and can come prepared.
Implementation Steps
1. Schedule a recurring 45-minute meeting every two weeks with required attendance from at least one senior representative from both sales and marketing.
2. Use a fixed agenda with four sections: review shared dashboard metrics from the past two weeks, flag any data discrepancies or tracking issues, discuss lead quality observations from sales, and confirm any upcoming campaigns or changes that need cross-team coordination.
3. Assign a note-taker to document decisions and action items. Shared meeting notes prevent the "that's not what we agreed to" conversations that erode trust over time.
4. Track recurring themes across meetings. If the same data discrepancy or lead quality issue comes up more than twice, it needs to become a project, not just a talking point.
Pro Tips
Rotate the meeting facilitation between sales and marketing leadership rather than having one team always run it. Shared ownership of the meeting signals that both teams are equally responsible for the alignment, and it reduces the perception that one function is policing the other.
7. Use AI-Powered Insights to Remove Subjective Bias from Performance Debates
The Challenge It Solves
Performance debates between sales and marketing often come down to selective interpretation of data. Marketing highlights the campaigns that performed well. Sales highlights the leads that did not close. Both teams are technically looking at real data, but each is using it to build a case rather than to find the truth. When human bias drives the analysis, the team with the better storyteller wins the argument, not the team with the better strategy.
The Strategy Explained
AI-powered analytics tools can serve as a neutral third party in performance conversations. Rather than waiting for a team member to pull a report that supports their position, an AI layer continuously surfaces patterns, anomalies, and recommendations based on the full dataset. Neither team chose which insights to highlight. The system did, based on what the data actually shows.
This shifts the conversation from "here is why my team is right" to "here is what the data is telling us to do next." It reduces the emotional charge of performance reviews and makes it easier for both teams to accept findings that might reflect poorly on their own work, because the insight came from a system rather than from the opposing team. Tools like AI chat for marketing data analysis allow both teams to query the data directly and get unbiased answers in real time.
Cometly's AI-powered features, including the AI Ads Manager and AI Chat for data analysis, are designed to surface these kinds of objective insights. Instead of manually digging through campaign data to build a case, both teams can ask questions of the data directly and get answers grounded in the full picture of performance across every channel.
Implementation Steps
1. Identify the specific performance questions that most frequently cause conflict between sales and marketing, such as which campaigns are generating the highest quality leads or which channels have the best cost per closed deal.
2. Configure your AI analytics tool to monitor those specific metrics and surface alerts or recommendations when meaningful patterns emerge.
3. Introduce AI-generated insights as a standing agenda item in your bi-weekly alignment meeting. Present the AI recommendations first before either team shares their own analysis, so the objective view sets the frame for the discussion.
4. Document when AI recommendations are acted on and track the outcomes. Over time, this builds a track record that reinforces trust in the AI layer as a reliable guide for joint decision-making.
Pro Tips
Avoid letting one team control the AI tool configuration. If marketing sets up all the alerts and defines all the queries, sales will assume the system is tuned to favor marketing outcomes. Joint configuration, or configuration by a neutral revenue operations function, keeps the AI layer credible to both sides.
Putting It All Together: Your Sales-Marketing Data Trust Roadmap
The seven strategies in this article are not independent fixes. They build on each other in a deliberate sequence, and the order matters.
Start with strategies one and two. Without a shared revenue dictionary and reliable full-funnel tracking, everything else is built on a shaky foundation. You cannot have a meaningful attribution conversation if your teams define "qualified lead" differently. You cannot trust a shared dashboard if your tracking has gaps that make the numbers unreliable.
Once that foundation is in place, layer in strategies three and four. Multi-touch attribution and a shared dashboard transform the data you are now capturing into a narrative both teams can see and agree on. This is where the blame cycle starts to break down, because both teams are finally looking at the same complete picture.
Strategy five amplifies the work by feeding better signals back to your ad platforms, gradually improving the quality of the leads entering the funnel. Strategies six and seven sustain the alignment over time through structured communication and AI-driven objectivity that keeps bias out of the performance conversation.
The common thread running through all seven strategies is trust. Trust in the data, trust in the process, and trust between the two teams that are ultimately working toward the same goal: revenue growth.
If you are ready to eliminate the data blame cycle and give both sales and marketing a single source of truth they can actually rely on, Cometly is built for exactly that. From server-side tracking to multi-touch attribution to AI-powered insights and conversion sync, everything you need to connect ad spend to closed revenue is in one place. Get your free demo today and start building the kind of marketing data your sales team will stop blaming and start trusting.