Your marketing team just celebrated another successful campaign. Ad engagement is up, cost per lead is down, and the dashboard looks great. Then sales weighs in: "These leads aren't converting." Marketing fires back with click data and impression metrics. Sales counters with pipeline reports and close rates. Both teams have data. Neither has the full story.
This disconnect isn't just frustrating—it's expensive. When marketing optimizes for metrics that don't align with revenue and sales can't see which touchpoints actually influenced their deals, you're flying blind with a seven-figure ad budget.
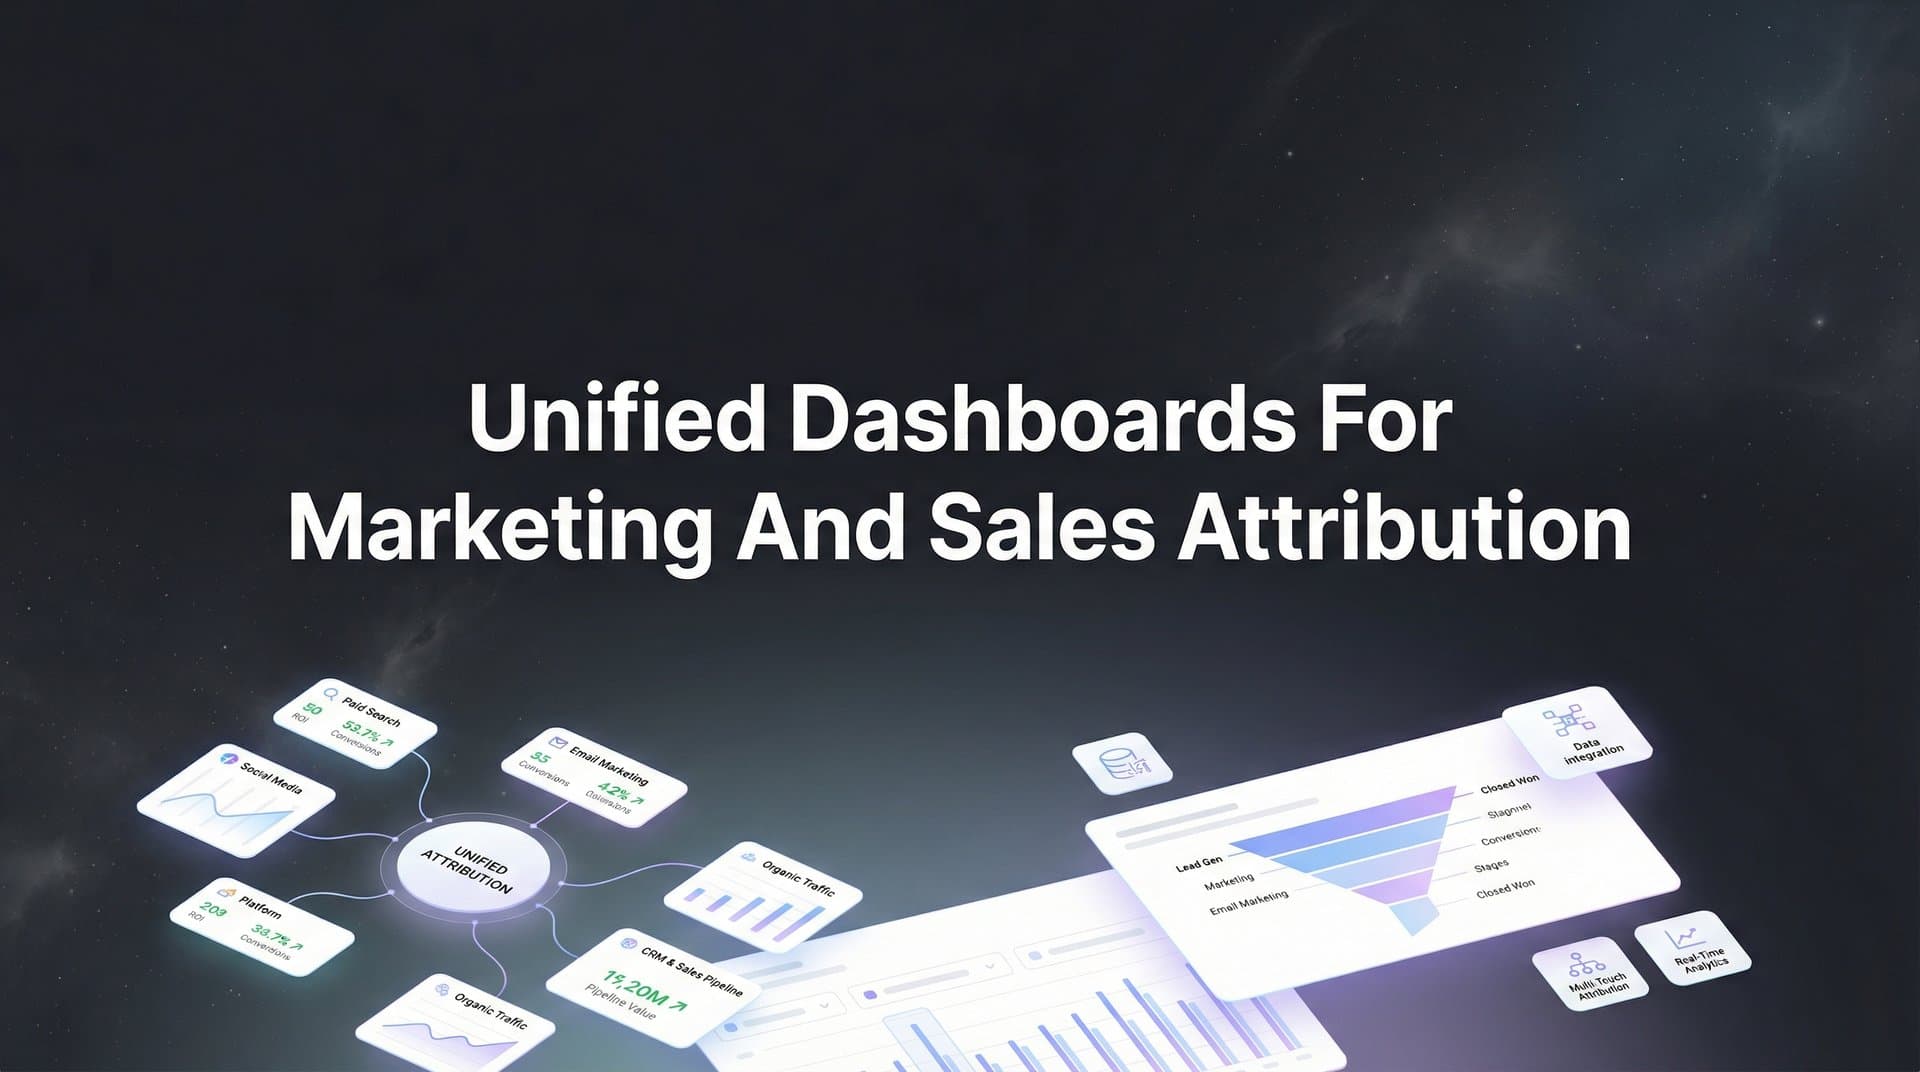
Unified dashboards for marketing and sales attribution solve this by connecting every piece of the puzzle: ad clicks, website visits, form fills, CRM events, and closed revenue—all in one view. Instead of two teams arguing over different data sets, you get a single source of truth that shows exactly how prospects become customers and which marketing efforts actually drive sales.
The Data Disconnect Costing You Revenue
Picture this: Marketing runs a multi-channel campaign across Meta, Google, and LinkedIn. They track clicks, impressions, and form submissions in their ad dashboards. Meanwhile, sales logs every call, demo, and deal stage in the CRM. When it's time to evaluate performance, marketing points to lead volume and sales questions lead quality. Nobody can definitively say which campaigns drove actual revenue.
This siloed approach creates massive blind spots. Marketing might pour budget into channels that generate clicks but never convert to customers. Sales might dismiss certain lead sources as "low quality" without realizing those leads took a longer path to close but delivered higher lifetime value. The result? Misallocated budgets, missed opportunities, and team friction that slows growth.
The real cost goes beyond wasted ad spend. When you can't connect marketing touchpoints to sales outcomes, you're making decisions based on incomplete information. You might kill a profitable campaign because it doesn't generate immediate conversions, not realizing it plays a crucial role in the consideration stage. Or you might scale a channel that looks great on paper but actually cannibalizes revenue from other sources.
Traditional reporting tools amplify this problem. Your ad platforms show you campaign performance in isolation. Your CRM tracks deals but doesn't connect them back to the specific ads or content that influenced them. Your analytics platform shows website behavior but can't tell you which visitors became customers or how much revenue they generated.
Even when teams try to manually reconcile data across platforms, they're working with delayed, incomplete information. By the time someone exports reports from three different tools and builds a spreadsheet to connect the dots, the data is already outdated. Marketing can't optimize in real time, and sales can't provide timely feedback on lead quality. These are common attribution challenges in marketing analytics that plague growing organizations.
This fragmentation doesn't just hurt decision-making—it erodes trust between teams. Marketing feels undervalued when sales dismisses their efforts based on gut feel rather than data. Sales feels frustrated when marketing celebrates metrics that don't translate to pipeline. Without shared visibility into the full customer journey, alignment becomes impossible.
Anatomy of a Unified Attribution Dashboard
A unified attribution dashboard brings together data that usually lives in separate silos. At its core, it connects four essential layers: ad platform data, website interactions, CRM events, and revenue outcomes. Instead of jumping between tools to piece together the story, you see the complete customer journey in one place.
The ad platform layer captures every marketing touchpoint—clicks, impressions, ad creative performance, and campaign spend across Meta, Google, LinkedIn, TikTok, and any other channels you run. This isn't just aggregated metrics; it's granular data tied to specific users and their journey through your funnel.
Website tracking adds the next dimension. Every page view, form submission, content download, and on-site behavior gets captured and connected to the visitor's identity. This layer reveals how prospects engage with your brand after clicking an ad, which content resonates, and what actions signal buying intent.
The CRM layer brings in sales data—lead creation, qualification status, demo bookings, proposal stages, and ultimately closed deals. This is where marketing activity meets sales reality. When a lead becomes an opportunity or closes as a customer, that event gets connected back to every marketing touchpoint that influenced the journey. Effective sales and marketing analytics depend on this seamless connection between systems.
The revenue layer ties everything together. It doesn't just track that a deal closed—it attributes that revenue back to the specific ads, campaigns, and channels that played a role. This is where you move from "we generated 500 leads" to "this campaign drove $150K in closed revenue."
What makes a dashboard truly unified isn't just displaying all this data—it's connecting it at the individual journey level. Instead of seeing aggregated reports that show total ad spend and total revenue separately, you see how specific touchpoints influenced specific deals. You can trace a customer's path from their first ad click through multiple website visits, content interactions, and sales conversations, all the way to the closed deal.
This journey-level attribution is fundamentally different from traditional reporting. Most tools aggregate data: "Google Ads generated 200 leads this month" or "50 deals closed from marketing sources." A unified dashboard shows you that Customer A clicked a Google ad, visited three blog posts, downloaded a whitepaper, attended a webinar, and then converted to a $50K deal—and it shows you every touchpoint that contributed.
The technical foundation that makes this possible is event tracking and identity resolution. Every interaction generates an event that gets tagged with a unique identifier. As visitors move from anonymous traffic to known leads to customers, the system maintains their identity across platforms. This means the person who clicked your ad last week, filled out a form yesterday, and had a sales call today is recognized as the same individual throughout their journey. Comprehensive attribution marketing tracking relies on this identity resolution working flawlessly.
Server-side tracking plays a crucial role here. With browser-based tracking increasingly limited by privacy restrictions and iOS updates, server-side implementation ensures you capture accurate data even when cookies fail. This technical approach sends conversion data directly from your server to ad platforms and your attribution system, bypassing browser limitations that cause data loss.
Bridging Marketing Metrics and Sales Outcomes
The most powerful shift unified dashboards enable is moving from lead-based metrics to revenue-based optimization. Instead of asking "how many leads did this campaign generate?" you ask "how much revenue did this campaign drive?" That single change in perspective transforms how marketing teams allocate budget and measure success.
Traditional marketing dashboards stop at the lead. You see cost per lead, lead volume, and maybe lead quality scores based on demographic data. But none of that tells you what you actually need to know: which campaigns drive customers who close deals and generate revenue. Platforms focused on marketing attribution revenue tracking solve this by connecting the entire customer journey to actual business outcomes.
This is where multi-touch attribution becomes essential. The reality of modern B2B buying journeys is that customers interact with multiple touchpoints before converting. They might click a LinkedIn ad, visit your pricing page, read three blog posts, attend a webinar, and then finally book a demo. Which touchpoint deserves credit for that conversion?
Different attribution models answer this question differently. Last-click attribution gives all credit to the final touchpoint—easy to implement but often misleading. First-click attribution credits the initial interaction—useful for understanding awareness channels but ignores everything that happened afterward. Linear attribution distributes credit equally across all touchpoints—fair but potentially overvalues minor interactions. Understanding the difference between single source and multi-touch attribution models is critical for choosing the right approach.
A unified dashboard lets you compare multiple attribution models side by side. You might discover that a channel looks mediocre in last-click attribution but plays a crucial role in first-touch or assists. This multi-model view reveals the true value of each channel and prevents you from making optimization decisions based on a single, potentially misleading perspective.
The real power comes when you connect this attribution data to actual revenue numbers. Instead of optimizing for the lowest cost per lead, you optimize for the highest return on ad spend based on closed deals. You might find that a channel with a higher cost per lead actually delivers customers with larger deal sizes or faster sales cycles, making it more profitable overall.
This revenue-focused approach also enables more sophisticated budget allocation. When you know which campaigns drive the most revenue—not just the most leads—you can confidently shift budget toward high-performing channels. If your LinkedIn campaigns cost more per lead but those leads close at 3x the rate with 2x the deal size, the math becomes clear even if traditional lead-based metrics suggested otherwise.
Marketing teams using unified dashboards often discover that their intuition about channel performance was wrong. The channel they thought was their best performer based on lead volume might actually deliver low-quality prospects that rarely close. Meanwhile, a smaller channel they considered supplementary might drive a disproportionate share of high-value customers.
Key Capabilities That Drive Real Results
Real-time data synchronization is the foundation that makes unified dashboards actionable. When your attribution data updates continuously as new touchpoints and conversions happen, you can spot trends and adjust campaigns while they're still running. Delayed data means delayed decisions—by the time you realize a campaign isn't converting, you've already spent another week's budget.
Modern unified dashboards pull data from ad platforms, CRM systems, and website tracking in near real-time. When a lead converts to an opportunity or closes as a customer, that event flows back through the attribution system immediately. Marketing teams can see which campaigns are driving pipeline this week, not last month. This immediacy enables agile optimization and prevents wasted spend on underperforming campaigns.
Model comparison capabilities let you view the same data through different attribution lenses simultaneously. You might look at your channel performance in last-click, first-click, linear, and time-decay attribution models all at once. This multi-perspective approach reveals insights that single-model reporting misses. A channel that looks weak in last-click might be your strongest awareness driver in first-click, suggesting it plays a valuable role early in the journey even if it doesn't close deals directly. Choosing what attribution model is best for optimizing ad campaigns depends on your specific business goals and sales cycle.
The ability to drill down from aggregate metrics to individual journeys separates powerful unified dashboards from basic reporting tools. You can start with a high-level view of campaign performance, then click into specific campaigns to see the actual customer journeys they influenced. This granular visibility helps you understand not just which campaigns work, but why they work and what patterns successful conversions follow.
AI-powered recommendations take unified dashboards from passive reporting to active optimization. By analyzing patterns across thousands of customer journeys, AI can identify which campaigns, audiences, and creative elements correlate with high-value conversions. Instead of manually analyzing data to find optimization opportunities, you get specific recommendations: scale this campaign, adjust this audience, test this creative approach. The integration of AI for sales and marketing is transforming how teams optimize their campaigns.
These recommendations work because they're based on actual conversion data, not just engagement metrics. The AI isn't suggesting you scale a campaign because it has high click-through rates—it's recommending scale because that campaign's clicks convert to revenue at above-average rates. This connection to business outcomes makes AI recommendations far more valuable than generic optimization suggestions.
Conversion sync capabilities feed your attribution insights back to ad platforms. When your unified dashboard knows which conversions drove revenue and which didn't, it can send that enriched data back to Meta, Google, and other platforms. This helps their algorithms optimize for valuable conversions instead of just volume. Your ad platforms get smarter because they're learning from actual business outcomes, not just form submissions.
Customizable views ensure that different team members see the data most relevant to their role. Marketing managers need campaign-level performance data. Sales leaders want to see which sources deliver the best leads. Executives need high-level revenue attribution across channels. A unified dashboard adapts to these different needs without requiring multiple tools or manual report building.
Building Your Unified Dashboard Strategy
The foundation of any unified dashboard strategy is comprehensive integration. You need to connect every system where customer journey data lives: your ad platforms, CRM, website analytics, and any other tools that capture touchpoints. The more complete your data connections, the more accurate your attribution becomes.
Start with your ad platform integrations. Connect Meta Ads, Google Ads, LinkedIn Ads, and any other paid channels you run. These integrations should pull in not just spend and clicks, but also ad-level details like creative, audience, and placement. The more granular your ad data, the more specific your optimization insights become. Effective cross-channel marketing attribution software makes these integrations seamless.
Your CRM integration is equally critical. This connection brings in the sales reality that marketing data lacks: lead status, opportunity creation, deal stages, and closed revenue. The integration needs to be bidirectional—pulling CRM data into your attribution platform and potentially pushing enriched conversion data back to the CRM so sales teams can see the marketing journey that influenced each lead.
Website tracking requires careful implementation. You need to capture page views, form submissions, content interactions, and any other on-site behaviors that signal intent or progression through the funnel. Server-side tracking implementation is particularly important here, ensuring you maintain data accuracy even as browser-based tracking becomes less reliable.
Conversion event setup determines what your dashboard can actually attribute. Define clear conversion events that matter to your business: form submissions, demo bookings, trial signups, purchases, or any other actions that signal progression toward revenue. Each event should include relevant context—lead source, campaign details, and user identity—so it can be connected to the broader journey.
Team alignment around shared metrics prevents the dashboard from becoming another source of confusion. Marketing and sales need to agree on definitions: what qualifies as a marketing-sourced lead? How do you attribute deals that involve multiple touchpoints from different channels? What attribution model will you use for budget allocation decisions? Without this alignment, you'll end up with another tool that different teams interpret differently.
This alignment process often reveals gaps in how teams think about attribution. Marketing might assume that any lead who clicked an ad before converting should count as a marketing-sourced deal. Sales might only consider it marketing-sourced if the ad was the first touchpoint. A unified dashboard forces these conversations to happen and helps teams agree on consistent attribution logic.
Data enrichment strategies improve both attribution accuracy and ad platform optimization. When you capture additional context about conversions—deal size, customer lifetime value, product category, or any other business-relevant data—you can analyze performance at a deeper level. This enriched data also feeds back to ad platforms, helping their algorithms optimize for high-value conversions instead of just conversion volume. The intersection of data science for marketing attribution enables these sophisticated enrichment strategies.
Regular review cadences ensure your unified dashboard drives actual decisions, not just prettier reports. Establish weekly or bi-weekly sessions where marketing and sales review performance together. Look at which channels are driving pipeline, which campaigns need optimization, and where attribution insights suggest budget reallocation. These regular reviews turn data into action.
The technical implementation matters, but the human side matters more. A unified dashboard succeeds when it becomes the single source of truth that both teams trust and reference in every performance conversation. That trust comes from accurate data, clear definitions, and consistent usage—not just from having the right integrations.
Putting Unified Attribution Into Action
The first week with a unified dashboard typically delivers immediate insights that change how you think about channel performance. Many teams discover that their assumptions about which campaigns drive revenue were significantly wrong. The channel they thought was their top performer based on lead volume might actually have a poor conversion rate to closed deals. Meanwhile, a smaller channel they nearly cut might be delivering the highest-value customers.
Start by identifying your highest-revenue channels. Look beyond lead volume and cost per lead to see which sources actually drive closed deals and revenue. You might find that organic search delivers fewer leads than paid social but those leads convert at much higher rates. Or that a specific campaign you considered supplementary is actually responsible for a disproportionate share of high-value deals.
These early insights often justify immediate budget shifts. If you discover that LinkedIn campaigns drive 40% of your revenue despite receiving only 20% of your budget, the optimization path becomes clear. Unified attribution gives you the confidence to make these moves because you're basing decisions on actual revenue data, not assumptions or engagement metrics. Effective marketing attribution and optimization go hand in hand.
Over time, unified dashboards enable more sophisticated optimization strategies. You can analyze which combination of touchpoints leads to the highest conversion rates. You might discover that prospects who interact with both paid ads and organic content convert at twice the rate of those who only see ads. This insight suggests investing in content that complements your paid campaigns rather than viewing them as separate channels.
The long-term benefit is scaling with confidence. When you know which campaigns drive revenue and why, you can increase spend without the fear that you're just buying more low-quality leads. You're not guessing which channels to scale—you're following clear data that shows which investments deliver returns.
Conversion sync amplifies these benefits by feeding your attribution insights back to ad platforms. When Meta and Google know which conversions led to revenue and which didn't, their algorithms can optimize for valuable outcomes. This creates a virtuous cycle: better attribution data improves ad targeting, which delivers better results, which generates more attribution data to further refine optimization.
Teams using unified attribution consistently report reduced friction between marketing and sales. When both teams reference the same data and see the complete customer journey, conversations shift from blame to collaboration. Instead of arguing about lead quality, they discuss which touchpoints work best and how to optimize the full funnel together.
The New Standard for Revenue Intelligence
Unified dashboards for marketing and sales attribution represent more than just better reporting—they're the foundation for how modern revenue teams operate. The days of marketing and sales working from different data sets and arguing over which metrics matter are ending. Teams that embrace connected attribution gain a decisive advantage: they know what drives revenue, not just what drives clicks.
This shift from siloed metrics to connected intelligence changes everything. Marketing can optimize for actual business outcomes instead of vanity metrics. Sales can see which sources deliver the best leads instead of relying on gut feel. Leadership can allocate budget based on revenue data instead of guessing which channels work.
The technical capabilities continue to evolve—AI recommendations get smarter, integrations become more seamless, and attribution models grow more sophisticated. But the core value remains constant: giving teams a single source of truth that connects every marketing touchpoint to sales outcomes and revenue.
Teams that implement unified attribution don't just see better data—they make better decisions. They scale winning campaigns with confidence, cut underperforming spend without second-guessing, and align around shared goals instead of competing metrics. This isn't incremental improvement; it's a fundamental shift in how revenue teams operate.
Ready to elevate your marketing game with precision and confidence? Discover how Cometly's AI-driven recommendations can transform your ad strategy—Get your free demo today and start capturing every touchpoint to maximize your conversions.