Website conversion optimization is really just the process of getting more of your website visitors to do what you want them to do, whether that's buying a product or signing up for a newsletter. It's about using data, analytics, and actual user feedback to make your site perform better and turn the traffic you already have into real revenue.
Your Foundation for High-Impact CRO
Let's get out of the guessing game and into data-driven growth. Real conversion optimization isn't about random tweaks or jumping on the latest design trend. It’s a methodical practice focused on understanding how people behave on your site and systematically removing anything that gets in their way.
Every single element—from your headline to your checkout button—is an opportunity to either help or hinder a potential customer.
 A Modern Guide to Website Conversion Optimization
The core principle is simple: make it easier for people to say "yes." This means connecting your user experience (UX) directly to your bottom line. A confusing navigation menu isn't just a design flaw; it's a leaky bucket draining potential sales. A slow-loading page doesn't just annoy visitors; it actively sends them packing to your competitors.
Why Small Lifts Create Major Wins
The financial impact of CRO is easy to underestimate. A small lift in your conversion rate can create a massive boost in revenue without you having to spend a single extra dollar on ads. If you want a closer look at the big-picture goals that drive CRO, these proven ecommerce growth strategies are a great place to start.
Think about the numbers for a second. The average website conversion rate across most industries hovers around 2–3%. That means for every 100 people who visit, a whopping 97 of them leave without doing anything.
But if you can boost that rate from 2% to just 3%, you've just achieved a 50% increase in conversions. That’s where the real power of CRO lies—it's about squeezing more value out of the traffic you already have.
"Your website is your most powerful salesperson, working 24/7. Conversion optimization is simply training that salesperson to be more effective at closing deals by listening to what customers actually want."
The Role of Accurate Data and Attribution
Here’s the thing: you can't optimize what you can't accurately measure. This is where so many CRO programs fall flat. They rely on incomplete or just plain wrong data from browser-based pixels, which can miss a huge chunk of conversions. Without a clear picture of what’s actually driving results, your optimization efforts are just educated guesses.
This is why having a solid data foundation from a platform like Cometly is so crucial. By ensuring every conversion is captured with server-side accuracy, you get trustworthy data that points you directly to your biggest growth opportunities. When you understand the complete customer journey, you can finally see which channels and campaigns are bringing in your most valuable customers. You can learn more about this by reading our guide on conversion analytics.
This reliable attribution data is the starting point for any CRO strategy that's built to deliver measurable, predictable results.
A solid CRO strategy isn't just about A/B testing button colors; it's a comprehensive approach that ties together user behavior, data integrity, and business goals. Below is a breakdown of the key components that form the backbone of any successful optimization program.
Key Pillars of a Modern CRO Strategy
Data integrity is the foundation of CRO because it ensures every conversion is tracked accurately using server-side tracking and multi-touch attribution. This matters for growth because if your data isn’t trustworthy, every decision you make is based on guesses, which leads to wasted spend, wasted time, and false conclusions about what’s actually driving results.
UX and funnel analysis focuses on identifying friction points, drop-offs, and confusion in the user journey using tools like heatmaps, session recordings, and behavioral analytics. This matters because fixing leaks in your funnel often delivers the fastest revenue gains, since you’re improving how efficiently your existing traffic turns into customers.
Hypothesis development is the process of forming clear, testable ideas based on both qualitative and quantitative insights. A strong hypothesis follows a simple structure like, “If we change X, then Y will happen because…” and it matters because it turns random design changes into strategic experiments that produce learnings you can build on.
A/B and multivariate testing is how you systematically test variations of pages, elements, or flows to see which version performs better. This matters because it’s the engine of CRO and it replaces opinions with evidence, helping you confidently make changes that increase conversions instead of relying on assumptions.
Performance measurement is where you analyze test results against your primary and secondary KPIs to identify winners and extract real insights. This matters because CRO isn’t just about finding a winning version, it’s about understanding why it won so you can apply the same principles across other pages and funnels.
Iteration and scaling is the compounding phase where you apply what you’ve learned, develop new hypotheses, and roll out successful changes across your website. This matters because CRO is not a one-time project, it’s a continuous cycle of improvement that builds momentum over time and steadily increases revenue from the same traffic.
These pillars work together to create a continuous loop of improvement. By mastering each one, you move from simply running tests to building a true optimization engine that fuels sustainable growth.
Uncovering Hidden Conversion Blockers in Your Funnel
Before you can fix your conversion rates, you have to play detective. The best website conversion optimization starts with a clear diagnosis—hunting down the exact friction points, dead ends, and confusing moments that are costing you customers. This isn't about guesswork; it's about seeing your website through your visitors' eyes.
 A Modern Guide to Website Conversion Optimization
Standard analytics tell you what is happening, like a high bounce rate on a product page, but they almost never explain why. To get that crucial context, you have to dig into user behavior. This is where qualitative data becomes your most valuable asset.
Moving Beyond Basic Analytics
To really get what’s going on, you need tools that show you the interactions. Session recordings are fantastic for this—you can watch anonymized user sessions as if you're looking right over their shoulder. You'll see where they hesitate, where they rage-click in frustration, and the exact moment they ditch their cart.
Heatmaps give you the big-picture view by aggregating all that behavior. They show you which buttons get all the love and which critical elements are being completely ignored. When you put these insights together, you can turn a vague problem like "low engagement" into a specific, fixable issue like, "nobody is clicking our main CTA because it's below the fold on mobile."
Mapping the Entire Customer Journey
Your audit has to cover the entire journey, not just a few isolated pages. Start from the very first touchpoint—a social media ad, an email, a Google search—and follow the path all the way to the final thank you page. For a deeper dive on this, check out our complete guide to conversion funnel analytics.
This end-to-end perspective helps you spot jarring disconnects. Does your ad promise a 20% discount, but the landing page barely mentions it? Is your mobile checkout process a clunky mess compared to the desktop version? These are the kinds of gaps that absolutely kill conversions.
One of the most critical parts of your audit is segmenting data by device. The performance gap between desktop and mobile is often huge, and understanding it is key to smart budget allocation and optimization.
Recent data shows desktop conversion rates average around 4.8–5%. Mobile? Often less than half that, hovering somewhere between 1.6–2.9%. A campaign that looks weak overall might actually be crushing it on desktop but failing miserably on mobile. You can find more conversion benchmarks and insights on VWO.com. Without that detailed view, you might cut the budget on a channel that just needs a better mobile experience.
A Practical Checklist of Common Conversion Killers
As you go through your funnel, keep an eye out for these usual suspects. They're often the source of hidden friction and can be easy wins for your first round of A/B tests.
- Confusing Value Proposition: Can a first-time visitor understand what you do and for whom within five seconds? If they can't immediately grasp the value, they're gone.
- Slow Page Load Speed: Every second counts. A page that takes more than three seconds to load will cause a huge drop-off, especially on mobile.
- Complicated Navigation: Can people find what they're looking for without thinking too hard? Confusing menus, unclear labels, and no search bar are recipes for frustration.
- Weak or Hidden Calls-to-Action (CTAs): Your main CTAs should be impossible to miss. Use contrasting colors, action-focused language, and place them where the eye naturally goes.
- Unexpected Costs or Steps: Are you surprising users with shipping costs, taxes, or a mandatory account creation at the very end? Last-minute surprises are a top reason for cart abandonment.
- Lack of Trust Signals: Do you have customer reviews, security badges, and clear return policies front and center? People won't hand over their payment info if they don't feel safe.
By methodically checking for these blockers, you stop making assumptions and start building hypotheses grounded in real user behavior. That evidence-based approach is the foundation of any successful optimization program and ensures you're focused on changes that will actually move the needle.
Crafting Hypotheses That Actually Drive Results
After you've audited your funnel, you’re sitting on a goldmine of data—heatmaps showing where users get lost, session recordings revealing their frustration, and analytics pointing to the exact spots where they drop off. The next move is turning those raw observations into focused, testable ideas that can actually move the needle. A strong hypothesis is the bridge between a problem you’ve found and a solution worth testing.
Without a solid hypothesis, you’re just throwing changes at the wall to see what sticks. A great hypothesis, on the other hand, gives you structure, clarity, and a measurable goal. It turns random guesswork into a scientific experiment where every outcome—win or lose—teaches you something valuable about your customers.
Building Your Hypothesis Framework
A simple but incredibly powerful way to structure your thinking is the "Problem, Proposed Solution, Predicted Outcome" framework. This forces you to connect a specific user issue directly to a business goal, making sure every test you run is purposeful.
- Problem: Start with the "why." What specific friction point did your audit uncover? (e.g., "Users on mobile are abandoning the checkout process when they see the mandatory account creation screen.")
- Proposed Solution: This is your "what if." What change are you proposing to fix the problem? (e.g., "If we replace mandatory account creation with a guest checkout option...")
- Predicted Outcome: This is your measurable goal. What metric do you expect to improve, and by how much? (e.g., "...we predict mobile checkout completions will increase by 15%.")
This structure makes every test strategic. You aren't just "testing a guest checkout"; you're testing a specific solution to a documented problem with a clear success metric. Building a comprehensive conversion optimization strategy depends on having this level of clarity for every single experiment.
Prioritizing Your Tests with the PIE Model
You’ll probably come up with dozens of potential hypotheses, but you can't test them all at once. Prioritization is everything. It focuses your resources on the ideas with the highest potential return, and a popular framework for this is the PIE model.
The PIE model asks you to score each hypothesis on a scale of 1 to 10 across three criteria:
- Potential: How much room for improvement is there on this page? Optimizing a high-traffic, low-converting page has way more potential than tweaking a page that already performs well.
- Importance: How valuable is the traffic to this page? A change to your main pricing page is inherently more important than a change to an old blog post.
- Ease: How difficult will this test be to implement, both technically and operationally? A simple headline change is much easier than a complete checkout redesign.
Once you’ve scored each hypothesis, just add up the numbers. The ideas with the highest total scores should jump to the top of your testing roadmap.
A common mistake is getting stuck on the "Easy" tests. While quick wins are great for momentum, the highest-impact opportunities often come from tackling the important, high-potential ideas, even if they're a bit harder to execute.
Strong vs. Weak Hypotheses in Action
Let’s see how this all comes together with a few real-world examples. A huge part of crafting hypotheses that work involves getting specific about what you're changing and why, like when you're designing effective calls to action.
Scenario 1: E-commerce Checkout
- Weak Hypothesis: "Changing the button color will improve conversions." (This is vague and has no 'why' behind it.)
- Strong Hypothesis: "Problem: Analytics show a 40% drop-off on the shipping page. Proposed Solution: If we add trust seals and a clear 'money-back guarantee' message near the payment button, Predicted Outcome: we believe it will reduce user anxiety and increase checkout completions by 10%."
Scenario 2: SaaS Pricing Page
- Weak Hypothesis: "A new layout might work better." (This isn't specific or testable.)
- Strong Hypothesis: "Problem: User recordings show visitors repeatedly scrolling up and down, which suggests they can't easily compare plan features. Proposed Solution: If we change the layout to a feature-comparison table, Predicted Outcome: we predict that 'Request a Demo' clicks will increase by 20% because the value of each tier will be clearer."
By using a structured framework and a solid prioritization model, you ensure your CRO program is built on a foundation of strategic, data-informed decisions. This sets you up to run tests that actually generate meaningful results.
Running Tests You Can Actually Trust
Okay, you’ve done the hard work of digging through the data and now you have a prioritized list of smart hypotheses. It’s time to move from planning to action. This is where the rubber really meets the road in website conversion optimization—launching controlled experiments to see what actually moves the needle.
Running a test is about more than just flipping a switch on a new design; it’s about setting up a fair, measurable, and trustworthy experiment.
The most common approach here is the classic A/B testing. You pit your current page (the "control") against a new version (the "variation"). It’s simple, direct, and perfect for testing focused changes like a new headline or call-to-action button.
For bigger, more complex redesigns, you might use a split URL test. This sends traffic to two entirely different pages, which is ideal when the changes are too significant for a simple A/B test. Then there's multivariate testing, which lets you test multiple changes at once—like a new headline and a new button color—to see which combination performs best. It's powerful, but be warned: you need a ton of traffic to get reliable results.
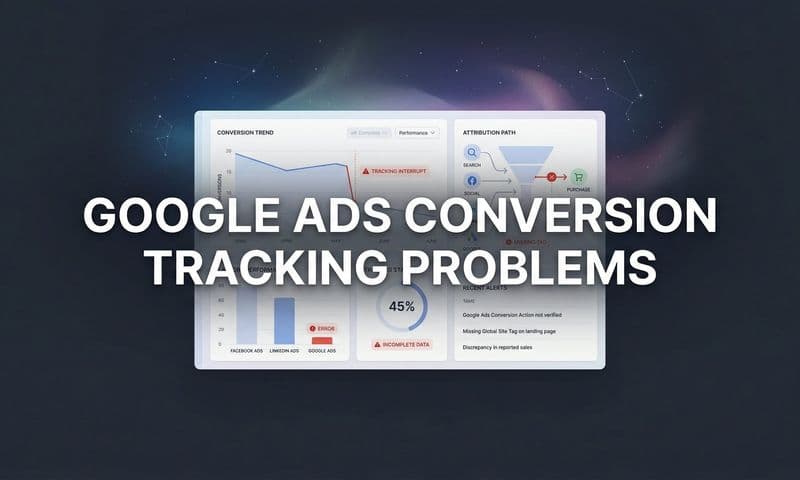
Instrumentation Is Non-Negotiable
Here’s a hard truth many marketers learn the painful way: a test is only as good as its data. If your tracking is broken, your results are completely meaningless. Meticulous instrumentation isn't just a "nice-to-have"; it's the most important part of the entire process. You need to be absolutely certain you're capturing every single conversion with precision.
Relying on traditional browser-based pixels from ad platforms is a recipe for disaster. They’re notoriously unreliable, getting blocked by ad blockers, privacy settings, and browser updates like iOS 14. This leads to a massive underreporting of conversions. When your test data is incomplete, you might kill a winning variation or, even worse, roll out a change that tanks your business.
This is exactly why server-side tracking is essential for any serious CRO program. Instead of depending on the user’s browser, server-side tracking sends conversion data directly from your website's server to your analytics and ad platforms. This method bypasses the blockers and gives you a much more complete and accurate picture.
A test run on flawed data isn't just a waste of time—it's actively misleading. Investing in accurate, server-side tracking is the single best way to ensure the decisions you make from your tests are based on reality, not guesswork.
Platforms like Cometly are built around this principle. By implementing robust server-side tracking, you ensure the data feeding your test analysis is as close to 100% accurate as possible. This also allows you to sync conversion data back to your ad platforms, giving them the feedback they need to optimize your campaigns based on what's actually driving results.
Understanding Statistical Significance
Once your test is live and the data starts rolling in, you’ll see one version start to pull ahead. It’s tempting to declare a winner after just a day or two, but this is a classic mistake. Early results can be incredibly misleading due to random chance. This is where the concept of statistical significance comes in.
In simple terms, statistical significance is a measure of confidence. A test that reaches 95% statistical significance means you can be 95% confident that the result is not a random fluke. It validates that the observed difference in performance between your control and variation is real and repeatable.
For those who want a deeper dive, we have a complete guide that breaks down what is statistical significance and why it's so critical for testing.
The flowchart below shows how a well-structured hypothesis moves from identifying a problem to predicting a measurable outcome—the foundation for any trustworthy test.
 A Modern Guide to Website Conversion Optimization
This process ensures that every test you run is purposeful, connecting a real user issue to a specific business metric you aim to improve.
Most testing tools will calculate statistical significance for you, but it’s your job to be patient. Don't stop a test early just because you see an initial lift. Wait until you have enough data—both in terms of visitors and conversions—to reach that high level of confidence. This discipline is what separates professional optimizers from amateurs and ensures your CRO efforts lead to genuine, sustainable growth.
Turning Test Results into Smarter Decisions
Launching an A/B test feels like the main event, but honestly, it’s just the kickoff. The real work—and where the actual value of conversion optimization lies—starts the moment data begins rolling in.
Knowing how to read the results, dodge the common traps, and turn raw numbers into confident business decisions is what separates the high-growth players from everyone else spinning their wheels.
The most common mistake I see is calling a test too early. You see one variation pull ahead by 10% after two days, and the excitement builds. But hold on. Those early results are often just statistical noise. Ending a test prematurely based on a tiny sample size is a surefire way to implement a false positive—a change that looks like a win but does absolutely nothing for your business long-term.
And what about an inconclusive result? That's not a failure; it’s a free lesson. If your test shows no clear winner, it might mean the change you made wasn't significant enough to actually influence user behavior. This is valuable intel, telling you to aim for bigger, bolder hypotheses next time instead of just tweaking button colors.
Digging Deeper with Segmentation
The aggregate result of a test—the big, flashy number at the top—often hides the most interesting stories. A new headline might show a tiny 2% lift overall, which seems pretty unremarkable. But when you start slicing up that data, you might just uncover a game-changing insight.
This is where segmentation comes in. It’s all about breaking down your test results by different user groups to find pockets of massive success or failure that are getting averaged out in the main view.
- By Device: Did your new, more visual product page crush it on desktop but actually tank on mobile because it slowed down the page load time?
- By Traffic Source: Is your new, benefit-driven copy resonating with visitors from organic search but falling completely flat with cold traffic from your paid social ads?
- By User Type: Does your simplified navigation help new visitors find what they need faster but totally confuse returning customers who were used to the old layout?
These segmented insights are where the gold is. A change that bombs on mobile but wins big on desktop doesn't have to be scrapped. Instead, you can implement the winning version for desktop users while you go back to the drawing board for a mobile-specific solution. This level of analysis turns a simple test into a much deeper understanding of your audience.
An A/B test isn't just a competition between two page versions. It's a lens through which you can understand how different types of customers react to change. The goal isn't just to find a winner, but to understand why it won and for whom.
The Critical Role of Attribution in Test Analysis
Your analysis gets even more powerful when you can connect your test results to the full customer journey. This is where a sophisticated attribution platform becomes absolutely essential. A change you make on your website doesn’t exist in a vacuum; it directly influences how users who clicked your ads ultimately behave and convert.
Using a tool like Cometly lets you see how your website optimizations impact customer journeys from start to finish. You can finally measure whether a tweak to a landing page not only increased initial sign-ups but also led to higher lifetime value from customers who originated from a specific Facebook campaign.
This connection is crucial. Without it, you’re only seeing a tiny piece of the puzzle. Accurate, multi-touch attribution helps you understand the downstream effects of your tests, ensuring your website conversion optimization efforts are truly driving revenue growth. To see how to put this into practice, check out our guide on transforming numbers into actionable data.
Building a Framework for Continuous Learning
Every single test you run—whether it’s a huge success, a clear loser, or totally inconclusive—adds to your company's institutional knowledge. The trick is to document everything systematically so you can build on what you've learned. A simple, shared repository of your tests is one of the most valuable assets a marketing team can have.
To make sure you capture the right information every time, it helps to use a consistent template. Here’s a simple table you can use to track the most important KPIs for any CRO test, ensuring you get a complete picture of the impact.
KPI Template for CRO Test Analysis
Your primary metric should be conversion rate, such as purchases or demo requests. This is measured by taking total conversions divided by total unique visitors, then multiplying by 100 inside your testing tool. This tells you whether the variation actually increased the percentage of users completing the action you care about.
Your secondary metrics should include things like Average Order Value (AOV), which is calculated by dividing total revenue by the number of orders. This helps you understand whether the change impacted how much people spend, not just whether they converted.
Your guiderail metrics include performance indicators like page load time, which you measure using analytics or speed tools. These metrics exist to make sure the test variation didn’t accidentally hurt site performance or create friction that could damage conversions long-term.
Your behavioral metrics include things like bounce rate or the click-through rate on a specific element, tracked through analytics tools. These metrics help you understand how user behavior changed, which can explain why conversion rate went up or down.
This process of analyzing, segmenting, and documenting creates a powerful feedback loop. The insights from one test directly inform the hypotheses for the next, creating a cycle of compounding growth where your decisions just keep getting smarter.
Answering Your Biggest CRO Questions
Getting started with conversion rate optimization always kicks up a few core questions. Whether you’re a veteran marketer or a founder juggling a dozen different roles, getting straight answers is the key to building a solid strategy you can actually feel confident about.
Let's dig into some of the most common questions I hear.
What Is a Good Website Conversion Rate?
This is the million-dollar question, and the only honest answer is: it depends. There’s no magic number that applies to every business. Industry benchmarks might throw around an average of 2-3%, but that figure is almost useless without context.
Your industry, business model, traffic source, and what you’re even counting as a "conversion" will completely change the game.
For example:
- E-commerce: A high-volume store selling affordable t-shirts would be thrilled with a 4% conversion rate on purchases.
- B2B SaaS: A company selling six-figure enterprise software might consider a 2% conversion rate on demo requests a massive win because each lead is worth a fortune.
- Content: A popular blog might see a 7% conversion rate on its newsletter signup, which is fantastic for audience building.
The only benchmark that truly matters is your own. Stop chasing some vague industry average and focus on beating your own historical performance. A consistent 10-20% lift from your baseline is a huge win and the sign of a healthy, effective CRO program.
How Long Should I Run an A/B Test?
Patience is everything in CRO. The right test duration really boils down to two things: how much traffic you get and how confident you need to be in the results. The goal is to collect enough data to hit at least 95% statistical significance, which is the gold standard for confirming your results aren't just a random fluke.
For a high-traffic e-commerce store, you might hit that number in a week. For a lower-traffic B2B site, you might need a month—or even longer—to get enough data points.
A non-negotiable best practice is to run your tests in full-week cycles. Think 7, 14, or 21 days.
Running a test for a full week (or multiple full weeks) helps smooth out the natural fluctuations in user behavior between weekdays and weekends. Stopping a test on a Wednesday might give you a skewed picture compared to letting it run through a full cycle.
Whatever you do, don't stop a test early just because one variation shoots ahead after two days. This is easily one of the most common—and costly—mistakes in CRO. Early leads are often misleading, and calling a winner too soon can send you optimizing in the completely wrong direction.
What Is the Difference Between CRO and SEO?
It’s easy to mix these two up, but they’re two sides of the same growth coin. They’re partners, not rivals, and you absolutely need both to win.
Think of it like a brick-and-mortar store.
SEO (Search Engine Optimization) is everything you do to get qualified shoppers to walk through your front door. It’s your prime location, your eye-catching signage, and the word-of-mouth reputation that draws people in. SEO is all about the quantity and quality of your traffic.
CRO (Conversion Rate Optimization) is what happens after they step inside. It’s the clean layout, the helpful staff, the clear pricing, and the easy checkout process that turns a window shopper into a paying customer. CRO is about maximizing the value from the traffic you already have.
You can learn more about turning visitors into customers in our guide on how to optimize landing pages.
Why Is Accurate Attribution So Important for CRO?
Without accurate attribution, you're flying blind. It's the bedrock of any meaningful CRO program. You might run a test and see a lift in direct sign-ups, but you’re only seeing a tiny piece of the puzzle.
Imagine you're trying to optimize a landing page that gets most of its traffic from a top-of-funnel ad campaign. Standard browser-based pixels might tell you this campaign is a total dud with a terrible conversion rate. Armed with that flawed data, you might kill the campaign or waste weeks trying to "fix" a page that isn't actually broken.
With accurate, multi-touch attribution, you might discover that this "poorly performing" campaign is actually the critical first touchpoint for your most valuable customers, who convert a week later after seeing two other ads.
This is where true attribution platforms like Cometly connect the dots. They show you the entire customer journey, revealing how your CRO efforts on one page influence conversions that happen days or even weeks later. This clarity leads to much smarter test hypotheses, more effective optimizations, and a budget you can allocate with total confidence.
Ready to get a crystal-clear view of your entire customer journey? Cometly provides the accurate, server-side attribution you need to make smarter marketing decisions and fuel your CRO efforts with data you can trust. Get started with Cometly today.