Your attribution window settings could be silently sabotaging your marketing data. Set them too short, and you miss conversions that take time to mature. Set them too long, and you dilute the connection between your ads and actual results. The result? Misallocated budgets, undervalued campaigns, and scaling decisions based on incomplete pictures.
Attribution window optimization isn't just a technical setting—it's the foundation of accurate marketing measurement. When your windows align with how your customers actually buy, you finally see which touchpoints genuinely drive revenue versus which ones just happen to be nearby.
Think of it like this: if your average customer takes 14 days to convert, but your attribution window only captures 7 days, you're essentially flying blind for half of your customer journey. You're crediting the wrong campaigns, undervaluing the channels that actually started the conversation, and potentially cutting budgets from your best performers.
This guide walks you through the exact process of auditing, configuring, and refining your attribution windows across platforms. You'll learn how to analyze your customer journey data, match window settings to your sales cycle, and continuously optimize based on real performance patterns. By the end, you'll have a framework for attribution window optimization that evolves with your business.
Step 1: Audit Your Current Attribution Window Settings Across All Platforms
Before you can optimize anything, you need to know where you stand. Most marketers have never documented their attribution window settings across platforms—they're running on whatever defaults were set during initial setup.
Start with Meta Ads Manager. Navigate to Events Manager, select your pixel or conversion API, and review your attribution settings. Meta defaults to a 7-day click and 1-day view attribution window, but many accounts have been adjusted over time without documentation. Record both the click and view windows currently in use.
Move to Google Ads next. Open your conversion actions settings and check the conversion window for each action you're tracking. Google defaults to 30 days for clicks, but you may find different settings across various conversion types. Note whether you're using data-driven attribution or another model—this impacts how your windows function.
For LinkedIn Campaign Manager, check your conversion tracking settings. B2B platforms often need longer windows due to extended sales cycles, but the default settings may not reflect your actual customer journey. Document both click and view attribution windows.
If you're running campaigns on TikTok, Pinterest, or other platforms, audit those as well. Create a simple spreadsheet with columns for: Platform, Conversion Type, Click Window, View Window, and Attribution Model. This becomes your baseline.
Here's where it gets interesting: look for discrepancies. If Meta credits conversions within 7 days while Google credits them within 30 days, you're measuring the same customer journey with completely different rulers. These conflicts create reporting chaos and make cross-platform analysis nearly impossible.
Pay special attention to view-through attribution settings. Some marketers disable view-through entirely, arguing it inflates results. Others use it to capture brand awareness impact. There's no universal right answer, but you need to know what you're currently measuring.
Document which attribution models each platform uses alongside window settings. First-click, last-click, linear, time decay, and data-driven models all interact differently with attribution windows. Understanding the difference between single source attribution and multi-touch attribution models is essential for interpreting your data correctly.
This audit typically reveals surprising inconsistencies. Many marketing teams discover they've been comparing apples to oranges across platforms for months or years. That's exactly why this step matters—you can't optimize what you haven't measured.
Step 2: Analyze Your Actual Customer Journey Timeline
Now comes the detective work: figuring out how your customers actually behave. Platform defaults are educated guesses, but your specific audience has unique patterns that should drive your attribution window settings.
Start by pulling conversion path data from your analytics platform. You need to see the time elapsed between first touch and conversion for your actual customers. If you're using Google Analytics 4, navigate to the conversion paths report and export data showing the customer journey duration.
The key metric you're looking for: how long does it typically take from first interaction to purchase? Calculate the average, but more importantly, calculate the 80th percentile. This tells you the timeframe that captures 80% of your conversions—a more useful benchmark than the average, which can be skewed by outliers.
Segment this data by product type and price point. Impulse purchases behave completely differently than considered purchases. A $30 product might convert within hours, while a $3,000 product might take weeks. If you're selling both, you need different attribution strategies for each.
Break down the data by acquisition channel as well. Customers who arrive via paid search often convert faster than those who come through social media. Email subscribers might have shorter consideration periods than cold traffic. These patterns should influence your channel-specific attribution settings.
For B2B businesses, this analysis becomes even more critical. Your sales cycle might span 30, 60, or even 90 days. Look at your CRM data to understand the full timeline from marketing qualified lead to closed deal. Effective lead generation attribution tracking helps you connect these longer journeys to their original marketing touchpoints.
Here's a practical example: imagine you discover that 80% of your conversions happen within 21 days of first touch, but your current Meta attribution window only captures 7 days. You're missing two-thirds of your conversion timeline. That means campaigns that started the customer journey are getting zero credit, while campaigns that happened to show up late are getting all the glory.
Create a visualization showing conversion rate by days since first touch. You'll often see a curve that climbs steeply in the first few days, then gradually levels off. The point where the curve flattens is where extended attribution windows start delivering diminishing returns.
Look for patterns in repeat purchase behavior if applicable to your business. Customers who buy multiple times often have different journey patterns than first-time buyers. Your attribution windows might need to account for both.
Document everything in a format your team can reference. This analysis becomes the foundation for every attribution decision you make going forward. When someone questions why you set a 21-day window instead of 7 days, you have data to back it up.
Step 3: Configure Platform-Specific Attribution Windows
Armed with your actual customer journey data, you can now set attribution windows that reflect reality instead of platform defaults. Each platform has unique considerations that affect how you configure these settings.
Start with Meta because it offers the most granular control. In Events Manager, you can set separate windows for click-through and view-through attribution. Based on your analysis from Step 2, adjust the click window to match your 80th percentile conversion timeline. If that's 21 days, set a 21-day click window.
The view-through window requires more nuanced thinking. View-through attribution credits conversions to ads people saw but didn't click. Some marketers find this inflates performance metrics, while others argue it captures legitimate brand awareness impact. If your analysis shows strong brand-driven conversions, a 1-day or 7-day view window makes sense. If you're running direct response campaigns with clear intent signals, you might disable view-through entirely.
Move to Google Ads next. Navigate to Tools & Settings, then Conversions, and adjust the conversion window for each action. Google's data-driven attribution model works best with longer windows—typically 30 to 90 days depending on your sales cycle. If your analysis shows conversions clustering within 14 days, a 14-day window prevents over-attribution to distant touchpoints.
For LinkedIn and other B2B platforms, longer windows are usually necessary. B2B buyers research extensively before converting, often interacting with multiple touchpoints over weeks or months. A 30 to 90-day attribution window better captures the full consideration cycle. Set your LinkedIn conversion tracking accordingly.
Document the reasoning behind each setting. Create a simple reference guide: "Meta click window set to 21 days because 80% of conversions occur within this timeframe per Q1 2026 analysis. View-through disabled because our direct response campaigns show minimal brand-driven conversion patterns."
This documentation serves two purposes: it helps future team members understand your decisions, and it creates a baseline for testing adjustments. When you revisit these settings in three months, you'll know exactly why you made each choice.
Consider campaign-specific windows if your platform supports them. Google Ads allows different conversion windows for different conversion actions. If you're tracking both newsletter signups (short consideration) and enterprise demos (long consideration), use different windows for each.
One critical point: align your attribution windows across platforms where possible. If Meta uses 21 days and Google uses 7 days, your cross-platform reporting will never make sense. Standardization creates consistency, making it easier to compare channel attribution in digital marketing and make budget allocation decisions.
After configuring each platform, run a comparison report showing before and after attribution. You'll likely see shifts in which campaigns get credit for conversions. This is expected—you're now measuring reality instead of arbitrary defaults.
Step 4: Implement Cross-Platform Attribution Tracking
Individual platform settings only tell part of the story. Your customers don't experience your marketing in platform silos—they interact with Meta ads, then Google search, then maybe an email, before finally converting. You need a unified view that connects these touchpoints.
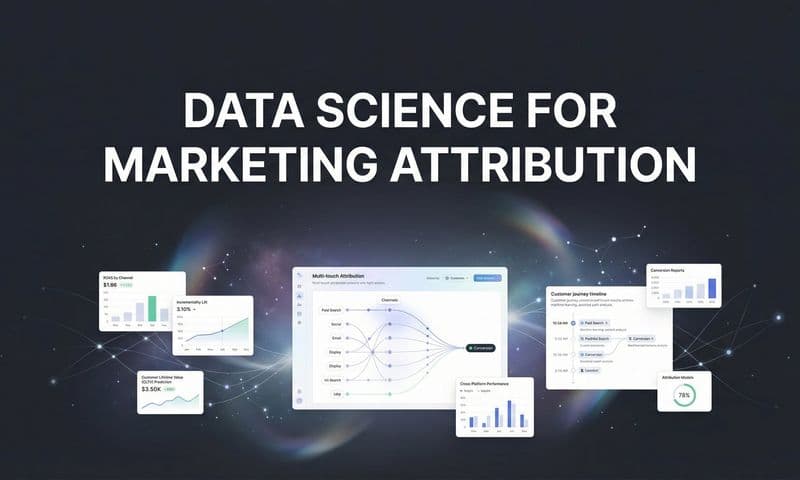
This is where a dedicated attribution platform becomes essential. While ad platforms track their own performance, they can't see the full multi-touch journey. A unified attribution solution connects all your marketing channels, CRM data, and conversion events into a single source of truth.
Start by connecting your attribution platform to all your ad channels. This typically involves API integrations that pull ad spend, impression data, and click data from each platform. The goal is to create a complete timeline of every marketing touchpoint a customer experiences before converting.
Server-side tracking has become increasingly critical as browser privacy changes limit client-side tracking accuracy. iOS privacy updates, cookie restrictions, and ad blockers mean your pixel-based tracking is missing conversions. Implement server-side tracking to capture events that client-side pixels miss.
Here's why this matters: when someone clicks your Meta ad on their iPhone, browses your site, then converts three days later on their laptop, client-side tracking often breaks the connection. Server-side tracking maintains that thread by matching user identifiers across devices and sessions. Implementing cookieless attribution tracking ensures you maintain measurement accuracy despite these privacy changes.
Configure your CRM integration next. Many conversions—especially in B2B—happen offline or through channels your ad platforms can't see. A demo request might come through paid search, but the actual deal closes three weeks later after sales conversations. Your attribution platform needs CRM data to connect these dots.
Set up conversion sync to feed enriched data back to your ad platforms. When your attribution platform identifies a high-value conversion, it can send that signal back to Meta, Google, and other platforms. This improves their algorithms' understanding of what good conversions look like, leading to better optimization over time.
Establish clear rules for how your unified attribution handles multi-touch journeys. Will you use first-touch, last-touch, linear, time decay, or a custom model? Different models answer different questions. First-touch shows what starts the conversation. Last-touch shows what closes the deal. Exploring multi-touch attribution models helps you choose the approach that best fits your business objectives.
Create a single dashboard that shows attribution across all channels using your optimized windows. This becomes your source of truth for marketing performance. When platform reports conflict with each other—which they will—your unified attribution provides the tiebreaker.
Test your setup by tracking a known conversion through the entire system. Verify that your attribution platform captures the touchpoint sequence, applies the correct windows, and assigns credit according to your chosen model. If something looks off, troubleshoot before relying on the data for decisions.
Step 5: Test Window Settings with Controlled Experiments
Theory meets reality in this step. Your analysis suggested optimal window settings, but you need to validate those choices with real performance data. Controlled testing reveals whether your attribution window optimization actually improves decision-making.
Set up parallel tracking with different window configurations. Run your optimized windows alongside the previous settings for a defined test period—typically 30 days minimum to capture full conversion cycles. This lets you compare how different windows attribute the same conversions.
Create a comparison report showing key metrics under both window configurations: total attributed conversions, ROAS by channel, cost per acquisition, and conversion volume by campaign. The differences reveal which campaigns were over-credited or under-credited by your previous settings.
You'll often discover surprising patterns. Campaigns that looked like underperformers with short attribution windows suddenly show strong performance with longer windows. Conversely, campaigns that seemed highly profitable might lose some attributed conversions when you tighten the window to match actual customer behavior.
Focus on campaigns with the biggest variance between window settings. These are the campaigns most affected by your optimization. If a Facebook attribution tracking shows 30% more attributed conversions with a 21-day window versus a 7-day window, that campaign was significantly undervalued before.
Measure how window changes affect your budget allocation decisions. If your previous settings led you to cut budget from a campaign that's now showing strong performance, that's a costly mistake you've just corrected. Quantify the potential revenue impact of these insights.
Test view-through attribution specifically if you use it. Run a comparison with and without view-through windows to see how much it influences your results. If view-through adds 5% more attributed conversions and those conversions are high quality, it's providing valuable signal. If it adds 50% more attributed conversions but they're low quality, it's inflating your metrics without adding real value.
Look for channel-specific patterns. Some channels benefit more from attribution window optimization than others. Top-of-funnel awareness campaigns typically need longer windows to show their full impact. Bottom-of-funnel conversion campaigns often perform similarly across different window settings because they capture customers close to purchase.
Document your findings in a format that drives action. Create a summary showing: campaigns that were undervalued, campaigns that were overvalued, recommended budget shifts, and projected revenue impact. This turns your technical optimization into business outcomes.
Use these learnings to fine-tune your windows further. You might discover that certain product lines need different windows, or that specific audience segments convert on different timelines. Your attribution strategy should reflect these nuances.
Step 6: Build a Continuous Optimization Review Process
Attribution window optimization isn't a one-time project—it's an ongoing discipline. Customer behavior changes, market conditions shift, and your business evolves. Your attribution windows need to evolve with them.
Schedule monthly reviews of attribution window performance. Set a recurring calendar event where you examine key metrics: average conversion timeline, conversion volume by window length, and any significant shifts in customer journey patterns. This regular cadence catches changes before they distort your decision-making.
Create alerts for significant shifts in conversion timeline patterns. If your average time-to-conversion suddenly increases from 14 days to 21 days, that's a signal your attribution windows may need adjustment. Set up automated reports that flag these changes so you can investigate the cause.
Monitor for external factors that impact customer behavior. Economic conditions, seasonal patterns, and competitive landscape changes all affect how quickly customers convert. A recession might extend your sales cycle, requiring longer attribution windows. Holiday shopping might compress it, suggesting shorter windows for specific periods.
Review your attribution windows whenever you launch new products or enter new markets. A new premium product line might have a completely different consideration cycle than your existing offerings. Your attribution strategy should account for these differences.
Conduct quarterly deep dives where you repeat the analysis from Step 2. Pull fresh conversion path data, recalculate your 80th percentile conversion timeline, and compare it to your current settings. If there's a meaningful gap, adjust your windows accordingly.
Document learnings in a centralized knowledge base. When you discover that certain campaign types need different windows, or that specific audience segments have unique conversion patterns, record those insights. Tracking your marketing attribution metrics consistently builds institutional knowledge that makes your attribution strategy increasingly sophisticated.
Share attribution insights with your broader marketing team. When sales cycle changes affect attribution windows, make sure campaign managers understand why you're adjusting settings. This builds team alignment and helps everyone interpret performance data correctly.
Test new attribution models periodically. As your business matures, different models may provide better insights. A startup focused on rapid growth might prioritize first-touch attribution to understand what starts the conversation. A mature business optimizing efficiency might prefer data-driven attribution that weights touchpoints by their actual impact.
Putting It All Together
Attribution window optimization transforms how you understand marketing performance. When your windows align with actual customer behavior, you finally see which campaigns truly drive revenue versus which ones just happen to be present when conversions occur.
Start with the audit—document your current settings across all platforms. You can't optimize what you haven't measured, and most marketing teams discover surprising inconsistencies when they finally map out their attribution landscape.
Let your actual customer journey data guide your decisions. The 80th percentile conversion timeline gives you a scientifically-backed starting point that beats platform defaults every time. Segment by product type, price point, and channel to capture the nuances in how different customer groups behave.
Configure platform-specific windows based on this analysis, document your reasoning, and aim for consistency across channels where possible. Implement unified cross-platform tracking so you can see the full multi-touch journey your customers experience.
Test your optimized settings against previous configurations to validate that you're actually improving decision-making, not just changing settings. The campaigns that show the biggest variance are the ones you were most likely misunderstanding before.
Build attribution window optimization into your regular workflow through monthly reviews and quarterly deep dives. Customer behavior evolves, and your measurement strategy should evolve with it.
Your attribution windows are the lens through which you view marketing performance. When that lens is calibrated correctly, every decision becomes clearer. You know which campaigns to scale, which to optimize, and which to cut. You allocate budgets based on actual impact instead of incomplete data. You build marketing strategies on a foundation of accurate measurement.
Ready to elevate your marketing game with precision and confidence? Discover how Cometly's AI-driven recommendations can transform your ad strategy—Get your free demo today and start capturing every touchpoint to maximize your conversions.