You're running ads across Meta, Google, LinkedIn, and TikTok. Your dashboard shows clicks, impressions, and conversions. But here's the problem: you have no idea which touchpoints actually matter. Did that Facebook ad close the deal, or did it just introduce your brand before a Google search sealed it three days later? Without customer journey mapping for digital advertising, you're making budget decisions based on incomplete stories.
Most marketers see their data in silos. Meta reports 50 conversions. Google claims 35. Your CRM shows 28 actual customers. The numbers don't match because each platform only sees its own piece of the puzzle. They can't tell you that a prospect saw your Instagram ad, clicked a retargeting campaign two days later, searched your brand name, and then converted through an email link.
This fragmentation costs you real money. You might be over-investing in channels that introduce your brand but never close deals. Or cutting budget from touchpoints that play a crucial supporting role in longer sales cycles. Customer journey mapping connects these dots, transforming scattered data points into a clear narrative of how prospects actually become customers.
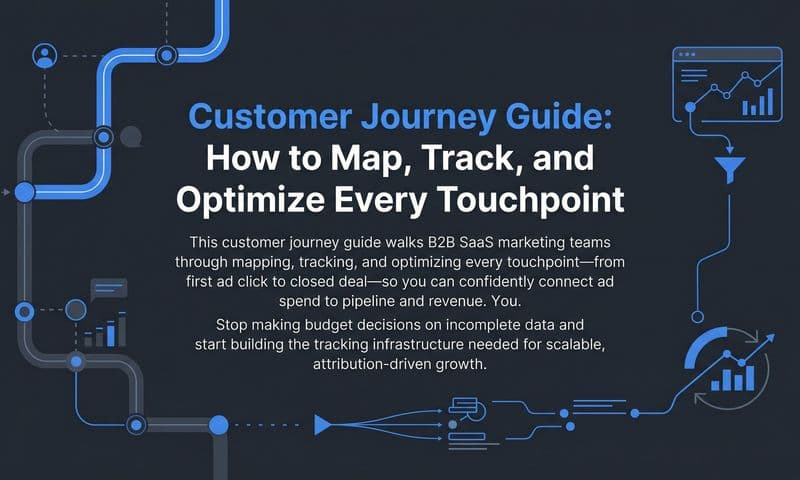
This guide walks you through building a journey map that reveals which ads drive revenue, where prospects drop off, and how to optimize every stage of your funnel. You'll learn to audit your tracking infrastructure, connect data sources across platforms, assign attribution accurately, and make confident optimization decisions. By the end, you'll have a practical framework for tracking the complete path from first impression to closed deal—no more guessing which ads actually work.
Step 1: Define Your Conversion Goals and Key Milestones
Before you can map a journey, you need to know where it ends. Start by identifying your primary conversion event—the action that represents real business value. For e-commerce, that's a purchase. For SaaS companies, it might be a demo booking or paid signup. For lead generation businesses, it could be a qualified form submission that your sales team actually pursues.
Your primary conversion is the destination, but the journey includes crucial stops along the way. These secondary milestones indicate progression through your funnel and help you understand where prospects stall or accelerate. Common milestones include email capture, pricing page visits, cart additions, video watches, or resource downloads.
Think of these milestones as checkpoints that signal buying intent. A prospect who visits your pricing page three times is behaving differently from someone who bounced after reading one blog post. Mapping these behaviors helps you identify which touchpoints move prospects forward versus which just generate traffic. Understanding customer journey touchpoints is essential for this analysis.
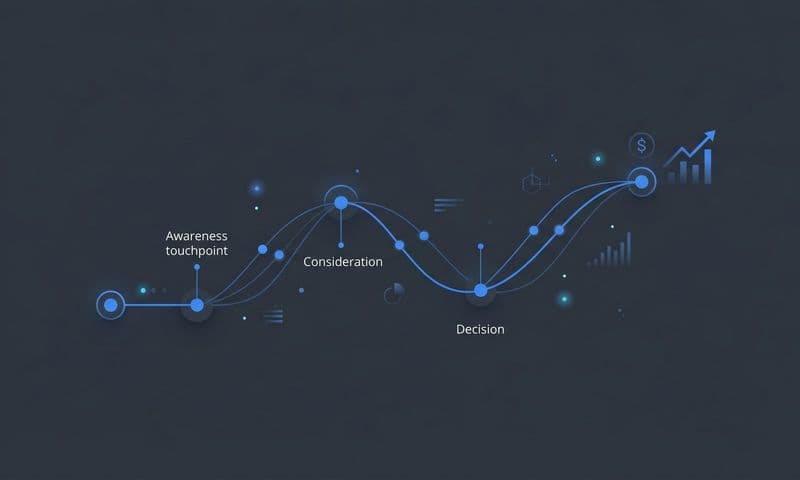
Document what success looks like at each funnel stage. At the awareness stage, success might mean a prospect engages with your content for more than 30 seconds. At consideration, it could be visiting multiple product pages or comparing features. At decision, it's adding items to cart or requesting a quote. These definitions create a shared language for your team and clarify what you're actually optimizing for.
Establish typical timeframes between touchpoints for your business. This context is critical for attribution. If your average sales cycle is 14 days with five touchpoints, you need tracking that captures this entire window. A prospect might see your ad on Monday, research competitors all week, and convert the following Tuesday. If your attribution window only looks back seven days, you'll miss half the story.
B2B companies often have longer cycles with more touchpoints—sometimes 30, 60, or 90 days from first contact to closed deal. E-commerce might see conversions within hours or days. Understanding your timeline helps you set appropriate attribution windows and avoid crediting conversions to touchpoints that happened too far in the past to be relevant.
Write down your primary conversion goal, list 3-5 secondary milestones, and note your typical sales cycle length. This foundation guides every decision you'll make in the following steps. Without clear goals, you're just collecting data—not building a map that drives action.
Step 2: Audit Your Current Tracking Infrastructure
You can't map a journey if you're not capturing the touchpoints. Start by inventorying every ad platform where you're running campaigns. List them all: Meta (Facebook and Instagram), Google Ads, LinkedIn, TikTok, Twitter, Pinterest, YouTube—wherever you're spending money to reach prospects.
For each platform, verify that tracking is properly implemented. Check that pixels are firing correctly on your website. Use browser extensions or platform debugging tools to confirm that events are being captured when users take actions like viewing pages, adding to cart, or completing purchases.
Many marketers discover during this audit that their tracking is broken or incomplete. A pixel might be installed on the homepage but missing from the checkout page. Conversion events might be configured incorrectly, firing multiple times per session or not at all. These gaps create blind spots in your journey map—touchpoints that happened but were never recorded. If you can't track customer journey accurately, your optimization efforts will suffer.
Next, examine your CRM integration. How does lead data flow from your website and ad platforms into your CRM? When someone fills out a form, does that information automatically sync with your sales system? Can you trace a closed deal back to the original ad that introduced the prospect to your brand?
This is where many attribution systems fall apart. Marketing platforms and CRMs often operate as separate universes. Your ads might generate leads that sales converts weeks later, but without integration, you can't connect revenue back to specific campaigns. The result: you make budget decisions based on platform-reported conversions that don't reflect actual business outcomes.
Pay special attention to post-iOS 14.5 challenges. Apple's privacy changes significantly reduced the accuracy of browser-based tracking, especially for Meta ads. If you're relying solely on the Meta pixel, you're likely missing 20-40% of conversions. Prospects who use Safari or have opted out of tracking appear invisible to browser pixels. Learn more about what iOS 14 did to digital advertising and how to adapt.
Identify specific gaps in your tracking infrastructure. Common issues include: missing pixels on key pages, conversion events that aren't firing, lack of server-side tracking to capture data that browser pixels miss, no CRM integration to connect marketing touchpoints to revenue, inconsistent UTM parameters that make it impossible to track campaign sources, and attribution windows that are too short for your sales cycle.
Document everything you find in a spreadsheet. List each platform, note whether tracking is properly implemented, highlight any gaps, and prioritize fixes based on impact. This audit reveals the foundation you're building on—and whether it's solid enough to support accurate journey mapping.
Step 3: Map Every Touchpoint Across Channels
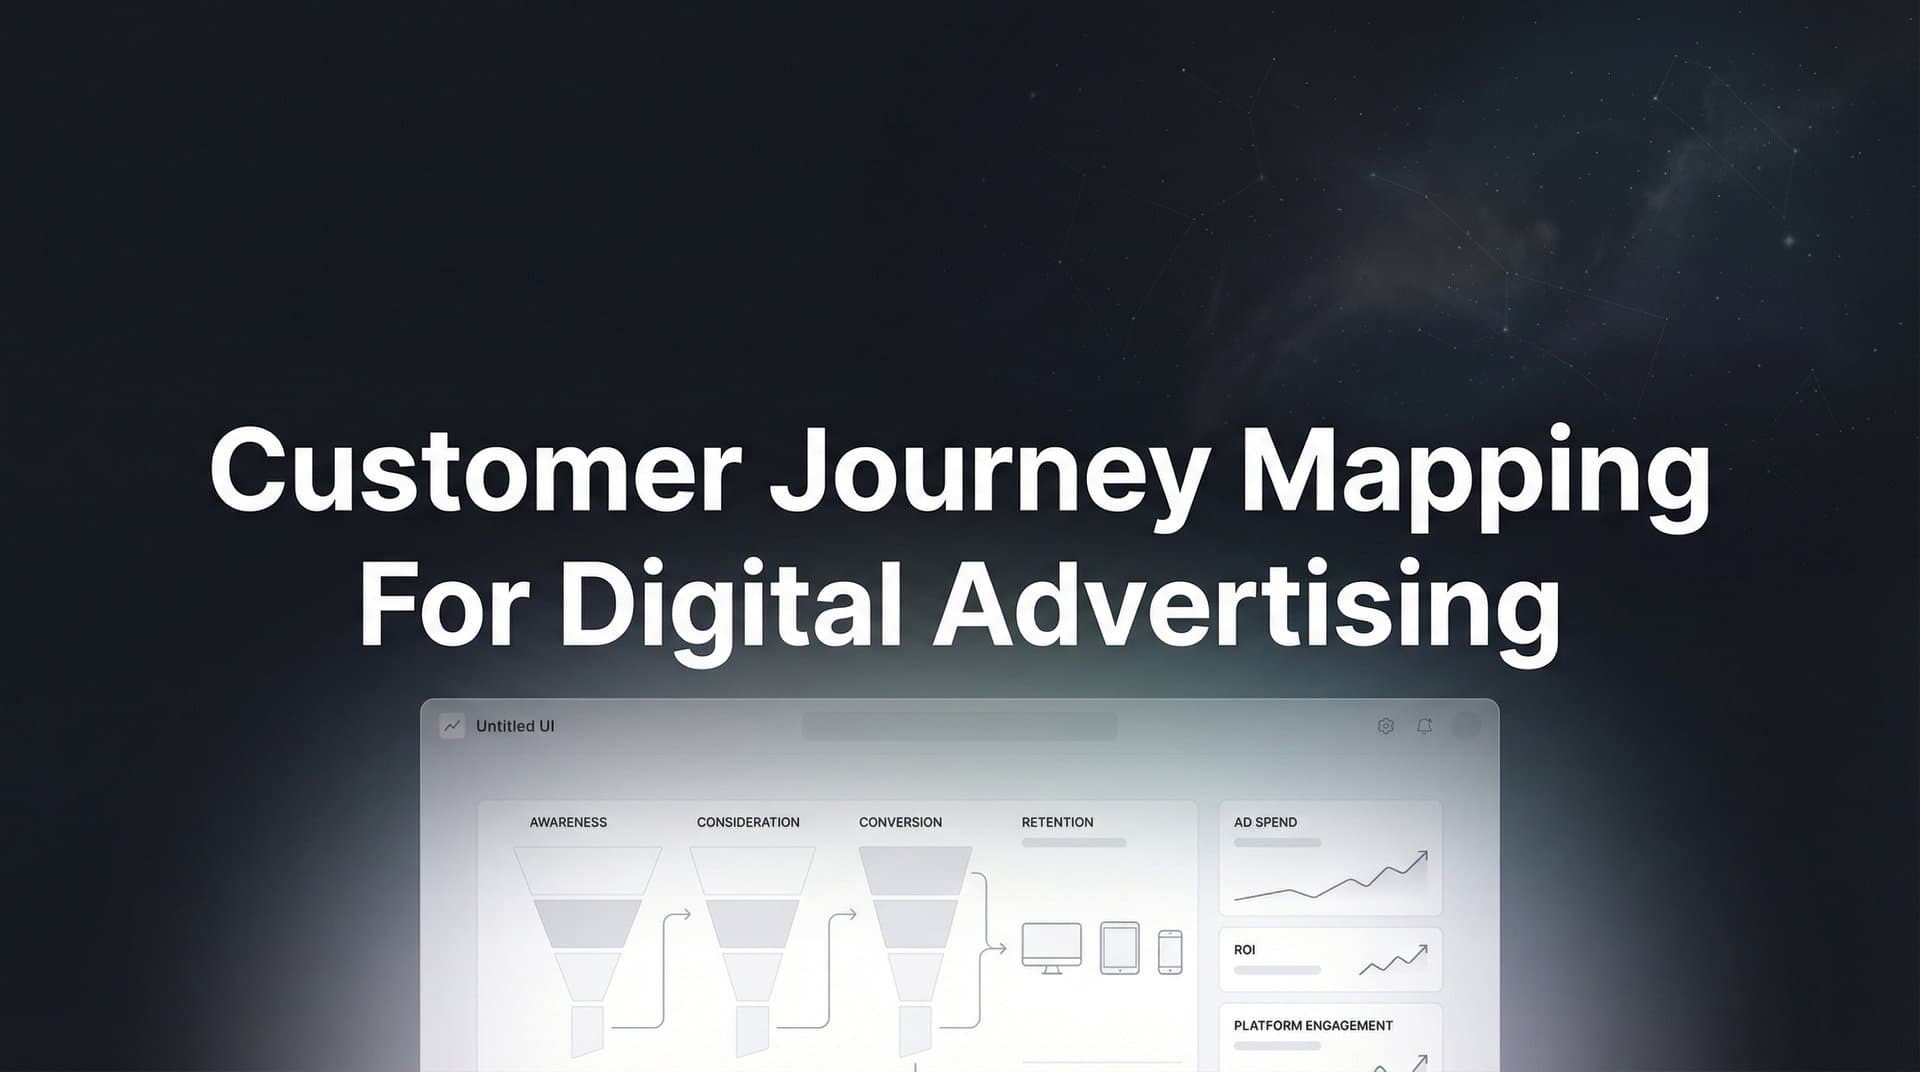
Now that you understand what you're tracking, it's time to visualize the actual journey. Create a diagram that shows all potential customer entry points—every place a prospect might first encounter your brand. This includes paid ads on every platform, organic search results, social media posts, email campaigns, podcast mentions, referrals, and direct traffic.
Start with awareness-stage touchpoints where prospects discover you exist. These might include display ads, social media impressions, content marketing, influencer mentions, or word-of-mouth referrals. Document each channel and the typical first action a prospect takes—clicking an ad, visiting your homepage, watching a video, or downloading a resource.
Move to consideration-stage touchpoints where prospects evaluate whether you're the right solution. Common interactions include retargeting ads that bring them back to your site, email sequences that nurture their interest, comparison pages where they weigh your features against competitors, case studies that build credibility, and pricing pages where they assess value.
Map decision-stage touchpoints where prospects are ready to convert. These final interactions might include cart pages, checkout flows, demo booking forms, sales calls, or free trial signups. Note any friction points—steps where prospects commonly abandon the process or require additional touchpoints to move forward.
Your diagram should show not just individual touchpoints, but the sequences of interactions that lead to conversions. For example, a common path might look like: sees Instagram ad → visits homepage → leaves → sees retargeting ad → returns via Google search → reads case study → visits pricing page → receives email → books demo → converts. The right customer journey mapping software can help you visualize these complex paths.
Include both online and offline touchpoints if your business uses them. A prospect might see a digital ad, attend a webinar, receive a follow-up call from sales, and then convert online. If you only map digital touchpoints, you're missing crucial parts of the journey that influence the final decision.
Pay attention to where prospects commonly enter and exit your funnel. Entry points reveal which channels are best at introducing new prospects. Exit points show where you're losing people—and where optimization efforts will have the biggest impact. If 60% of prospects leave after viewing your pricing page, that's a clear signal that price objections or unclear value propositions need addressing.
Use actual customer data to inform your map, not assumptions about how you think the journey should work. Pull reports from your analytics platform showing common page sequences. Review CRM records to see the touchpoint history of closed deals. Talk to your sales team about what prospects mention during conversations—they often reveal touchpoints that digital tracking misses. Explore how to analyze customer journeys effectively for deeper insights.
The result is a visual representation of every way prospects interact with your brand from first contact to conversion. This map becomes your reference point for understanding which touchpoints matter, which sequences convert best, and where to focus optimization efforts.
Step 4: Connect Your Data Sources for Unified Tracking
Your journey map is only as good as the data flowing into it. This step is about breaking down the silos between your ad platforms, analytics systems, and CRM so you can see the complete picture. Without integration, you're stuck with fragmented reports that can't tell you how touchpoints work together.
Start by integrating your ad platforms with your analytics system. If you're using Google Analytics, connect it to Google Ads, Meta Ads, LinkedIn Campaign Manager, and any other platforms you run. This allows you to see ad performance alongside website behavior in one dashboard rather than jumping between multiple interfaces.
Most analytics platforms offer native integrations with major ad networks. Enable these connections and verify that campaign data is flowing correctly. You should be able to see metrics like ad clicks, impressions, and costs alongside website metrics like sessions, bounce rates, and conversions—all attributed to specific campaigns. A cross platform analytics tool makes this process significantly easier.
Implement server-side tracking to capture data that browser-based pixels miss. Browser pixels rely on JavaScript that loads in a user's browser, which means they're vulnerable to ad blockers, privacy settings, and iOS restrictions. Server-side tracking sends conversion data directly from your server to ad platforms, bypassing these limitations.
Server-side tracking is particularly critical for capturing accurate conversion data post-iOS 14.5. When implemented correctly, it can recover 20-40% of conversions that browser pixels miss. This more complete data improves your attribution accuracy and helps ad platform algorithms optimize more effectively.
Set up UTM parameters consistently across all campaigns. UTM tags are the snippets added to URLs that tell analytics systems where traffic came from. A consistent naming convention ensures you can track performance across channels without confusion. Define standards for source, medium, campaign, content, and term parameters—then enforce them across your team.
Common UTM mistakes include inconsistent capitalization (Facebook vs facebook), vague campaign names that don't indicate content or timing, missing parameters that make it impossible to differentiate between ad variations, and using auto-tagging from ad platforms without verifying what gets captured. Clean, consistent UTMs are the foundation of accurate cross-channel attribution.
Connect your CRM to your marketing systems so you can track the complete journey from first ad click to closed revenue. Most modern CRMs offer integrations with ad platforms and analytics tools. Enable these connections and configure them to sync lead sources, campaign data, and conversion events bidirectionally.
This bidirectional sync is crucial. Not only do you want ad data flowing into your CRM, you also need conversion events syncing back to ad platforms. When you send conversion data back to Meta, Google, or LinkedIn, their algorithms use it to optimize targeting and bidding. The more accurate conversion data they receive, the better they perform.
Platforms like Cometly specialize in connecting these data sources into a unified attribution system. They capture every touchpoint across channels, sync conversion events back to ad platforms, and provide a single source of truth for understanding which marketing activities drive revenue. This eliminates the manual work of trying to reconcile different platform reports and gives you confidence in your attribution data. Learn more about unified marketing reporting for multiple platforms.
Test your integrations by running a conversion through your funnel and verifying that it appears correctly in all systems. Click an ad, complete a conversion, and check that the event shows up in your ad platform, analytics system, and CRM with consistent attribution. If the data doesn't match, troubleshoot the connection before relying on it for decision-making.
Step 5: Assign Attribution to Each Touchpoint
Now that you're capturing the complete journey, you need to decide how to credit conversions across multiple touchpoints. This is where attribution models come in. Different models assign credit differently, which dramatically affects which channels appear to be performing well.
First-touch attribution gives 100% credit to the first interaction that introduced a prospect to your brand. If someone saw a Facebook ad, then later converted through a Google search, Facebook gets all the credit. This model is useful for understanding which channels are best at generating new awareness, but it ignores everything that happened after the first click.
Last-touch attribution does the opposite—giving all credit to the final touchpoint before conversion. In the same scenario, Google would get 100% credit because it was the last interaction. This model highlights which channels close deals, but it undervalues the earlier touchpoints that built awareness and consideration.
Linear attribution distributes credit equally across all touchpoints. If a prospect had five interactions before converting, each gets 20% credit. This approach recognizes that multiple touchpoints contribute to conversions, but it assumes they're all equally important—which rarely reflects reality.
Time-decay attribution gives more credit to touchpoints closer to conversion. The theory is that recent interactions have more influence on the decision to buy. This model can be useful for shorter sales cycles, but it may undervalue early awareness-building efforts that were crucial for getting prospects into your funnel.
Position-based (U-shaped) attribution assigns 40% credit to the first touchpoint, 40% to the last, and splits the remaining 20% among middle interactions. This model recognizes that both introducing a prospect and closing them are critical, while still acknowledging supporting touchpoints. For a deeper dive, explore our multi-touch marketing attribution platform complete guide.
Choose a model that matches your sales cycle and business goals. If you're focused on efficient customer acquisition, first-touch attribution shows which channels bring in new prospects most cost-effectively. If you're optimizing for revenue, last-touch reveals which channels actually close deals. For complex B2B sales with long cycles, multi-touch models like position-based or time-decay provide a more nuanced view.
Compare platform-reported conversions against your actual CRM data. This is where many marketers discover significant discrepancies. Meta might report 100 conversions, Google claims 75, but your CRM shows only 60 actual customers. These differences stem from attribution windows, cross-device tracking limitations, and each platform's bias toward crediting itself.
Ad platforms use view-through attribution, counting conversions that happen after someone saw an ad but didn't click it. They also use attribution windows that may not match your sales cycle—Meta defaults to 7-day click and 1-day view, which misses conversions that happen after those windows. Your CRM, meanwhile, records actual customers regardless of how they arrived.
The goal isn't to pick one number as "truth"—it's to understand why the numbers differ and use that insight to make better decisions. Platform data tells you what's happening within their ecosystem. CRM data shows business outcomes. Attribution models help you connect the two by assigning credit in ways that reflect how your customers actually buy. Understanding marketing attribution and valuing the customer journey is key to making this work.
Identify which channels contribute to conversions versus which close them. This distinction is crucial for budget allocation. A channel might generate few last-touch conversions but play a vital role in introducing prospects who later convert through other channels. Without multi-touch attribution, you'd cut budget from a channel that's actually driving significant value.
Step 6: Analyze and Optimize Based on Journey Insights
Your customer journey map is complete. Now comes the part that drives real results: using these insights to optimize performance. Start by identifying high-performing paths that consistently lead to conversions. Pull reports showing the most common touchpoint sequences for closed customers. These patterns reveal your most effective marketing combinations.
For example, you might discover that prospects who see a Facebook ad, visit your blog, receive an email, and then search your brand name convert at 3x the rate of other paths. This insight tells you to invest more in content marketing and email nurturing, not just top-of-funnel ads. It also suggests testing campaigns that deliberately guide prospects through this proven sequence.
Spot drop-off points where prospects abandon the journey. High exit rates on specific pages or after certain touchpoints signal friction that needs addressing. If 70% of prospects leave after viewing your pricing page, you have a pricing communication problem—either the price is too high, the value isn't clear, or you're attracting the wrong prospects.
Use journey data to diagnose these issues. Look at what happened before prospects reached the drop-off point. Did they come from a specific ad campaign that set wrong expectations? Did they spend time on pages that suggest they're comparing you to competitors? Understanding the context helps you craft the right solution. Leveraging customer journey analytics tools can surface these insights faster.
Reallocate budget toward touchpoints that actually drive revenue. This is where attribution models prove their value. If your multi-touch model shows that LinkedIn ads consistently appear in high-value customer journeys—even if they're not the last click—increase LinkedIn spend. If display ads generate awareness but rarely lead to conversions even with multiple supporting touchpoints, reduce that budget.
Many marketers discover that channels they thought were underperforming actually play crucial supporting roles. Retargeting might not get last-click credit often, but it could be essential for bringing prospects back after they've done research elsewhere. Cutting retargeting budget based on last-touch attribution alone would damage overall performance.
Test variations in messaging and targeting based on journey stage. Prospects at different points in their journey need different messages. Someone seeing your ad for the first time needs education about what you do. Someone who's visited your site three times needs social proof or a compelling offer to push them toward conversion.
Create segmented campaigns that speak to these different stages. Run awareness campaigns with educational content for cold audiences. Deploy retargeting campaigns with case studies and testimonials for warm audiences. Use conversion-focused messaging and offers for hot prospects who've visited high-intent pages like pricing or product comparisons.
Use AI-powered recommendations for digital marketing to identify optimization opportunities you might miss manually. Modern attribution platforms analyze thousands of data points to surface patterns and suggest actions. They might identify that certain ad creatives perform better at specific journey stages, or that budget shifts between channels could improve overall ROI.
Platforms like Cometly provide AI-driven insights that highlight which campaigns are driving revenue, which touchpoints contribute most to conversions, and where budget reallocation would have the biggest impact. This intelligence helps you scale campaigns with confidence rather than guessing which levers to pull.
Set up a regular cadence for reviewing journey data and making optimizations. Weekly reviews keep you responsive to performance changes. Monthly deep dives reveal longer-term trends and inform strategic decisions. Quarterly audits ensure your tracking infrastructure remains accurate as you add new channels or change your website.
Document what you test and the results you see. Over time, this creates an institutional knowledge base about what works for your specific business. You'll discover patterns like "prospects who engage with video content convert 40% faster" or "adding a comparison page to the journey reduced drop-off by 25%"—insights that guide future strategy.
Putting It All Together
Your customer journey map is now a living document that connects every ad click to revenue. You've defined clear conversion goals and milestones that indicate progression. You've audited your tracking infrastructure to ensure you're capturing touchpoints accurately. You've mapped every interaction across channels, revealing how prospects actually move through your funnel.
You've connected your data sources so ad platforms, analytics systems, and CRM speak the same language. You've chosen attribution models that reflect how your customers buy, giving you confidence in which channels deserve credit. And you've established a process for analyzing journey insights and optimizing based on what the data reveals.
This framework transforms how you make marketing decisions. Instead of relying on incomplete platform reports or gut feelings about what's working, you have a complete view of the customer journey. You can see which ads introduce prospects, which touchpoints nurture consideration, and which interactions close deals. You can identify high-performing paths to double down on and drop-off points to fix.
The marketers who understand their complete customer journey don't just run ads—they scale campaigns with precision. They know exactly which touchpoints drive revenue, which channels work together to convert prospects, and where optimization efforts will have the biggest impact. They make confident budget decisions because they're looking at business outcomes, not vanity metrics.
Quick checklist to verify you're ready: conversion goals defined with clear milestones at each funnel stage, tracking infrastructure audited and gaps identified, touchpoints mapped across all channels showing common entry and exit points, data sources connected with server-side tracking implemented, attribution model selected that matches your sales cycle, and optimization process in place for regular review and action.
Remember that customer journey mapping isn't a one-time project—it's an ongoing practice. As you add new channels, launch new campaigns, or change your website, revisit your map to ensure it remains accurate. As you gather more data, refine your understanding of which paths convert best and which touchpoints matter most.
The investment you make in accurate journey mapping pays dividends in every marketing decision you make. You'll stop wasting budget on channels that don't drive results. You'll optimize touchpoints that actually move prospects forward. You'll feed better data back to ad platform algorithms, improving their targeting and performance. Most importantly, you'll scale your campaigns with confidence because you know exactly what's working and why.
Ready to elevate your marketing game with precision and confidence? Discover how Cometly's AI-driven recommendations can transform your ad strategy—Get your free demo today and start capturing every touchpoint to maximize your conversions.