You're three weeks into a $50,000 ad campaign. Facebook Ads Manager shows 847 conversions. Google Analytics reports 612. Your CRM says you closed 423 deals. Which number is real?
This isn't a tracking glitch. It's the reality of fragmented customer journey data—and it's costing you more than you think.
Most marketing teams operate with massive blind spots in their customer journeys. You see the ad click. You see the final purchase. But the 4-7 touchpoints in between? The email they opened at 2 AM. The blog post they read on mobile. The competitor comparison they searched for. Those interactions vanish into the attribution void.
The result? You're making budget decisions based on 60% of the story. You're scaling campaigns that look profitable but actually lose money. You're cutting channels that drive your highest-value customers because you can't see their full contribution.
Here's what makes this particularly painful: the data exists. Every touchpoint is happening. But without a complete customer journey tracking system, you're watching your marketing performance through a keyhole instead of a window.
This guide walks you through building a tracking infrastructure that captures every customer interaction—from first ad impression to final purchase and beyond. You'll learn how to implement server-side tracking that bypasses iOS restrictions, connect your ad platforms to revenue data, and build attribution models that reveal which campaigns actually drive profit.
By the end, you'll have a complete system that answers the questions keeping you up at night: Which ads are worth scaling? Where should you cut budget? What's your true customer acquisition cost? And most importantly—which marketing touchpoints actually drive revenue?
Let's build a tracking system that shows you the complete picture.
Map Your Current Customer Touchpoints
Before you can track a customer journey, you need to know what you're tracking. Most marketers think they know their touchpoints—ads, website, email. But when you actually map every interaction point, you'll discover 10-15 touchpoints you didn't realize existed.
 Customer Journey Tracking: How To Build A System That Captures Every Touchpoint
This isn't about creating a complicated flowchart. It's about spending 15 minutes with a spreadsheet and honestly documenting every place a potential customer could interact with your brand.
The 15-Minute Touchpoint Audit Method
Start with the obvious: paid advertising. Write down every platform where you run ads—Facebook, Instagram, Google Search, YouTube, TikTok, LinkedIn. Each platform is a distinct touchpoint because user behavior differs dramatically between them.
Now add your owned channels: website homepage, product pages, blog, pricing page. Don't forget the hidden ones—your 404 error page gets traffic too. Once you've identified your touchpoints, you'll need a comprehensive marketing tracking system to capture data from each interaction point.
Next, email touchpoints: welcome sequences, promotional emails, abandoned cart reminders, post-purchase follow-ups. Each email type represents a different stage in the customer journey.
Here's where it gets interesting—the touchpoints most marketers miss. Phone calls to your sales team. Live chat conversations. Support ticket submissions. Social media comments and DMs. Review site visits. Competitor comparison searches. These "dark" touchpoints often represent 30-40% of your actual customer journey.
One e-commerce brand discovered they were missing 14 touchpoints in their tracking. They knew about their Facebook ads and website visits. They didn't realize customers were reading Reddit threads about their products, checking Trustpilot reviews, watching YouTube unboxing videos, and calling customer service before purchasing.
Categorizing Touchpoints by Journey Stage
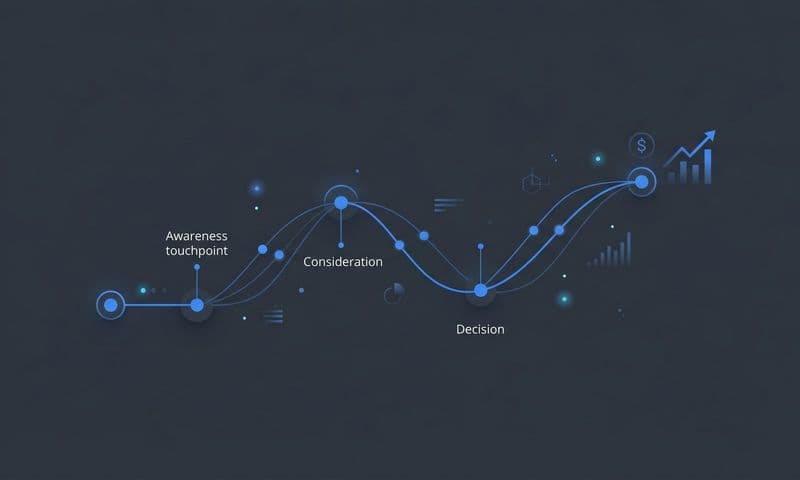
Once you've listed every touchpoint, organize them into four stages: awareness, consideration, decision, and retention.
Awareness touchpoints introduce your brand: social media ads, display advertising, content marketing, podcast sponsorships, influencer mentions. These are typically your highest-volume, lowest-intent interactions.
Consideration touchpoints show active research: website visits, blog post reads, email opens, demo requests, pricing page views. For businesses using Facebook advertising, comprehensive facebook touchpoint tracking reveals how users interact with ads, organic content, and retargeting campaigns across the entire journey.
Decision touchpoints indicate purchase intent: sales calls, proposal reviews, free trial signups, cart additions, checkout page visits. These are your highest-value interactions.
Retention touchpoints happen post-purchase: onboarding emails, product usage, support interactions, upsell offers, renewal reminders. Most marketers ignore these entirely, which is why they can't calculate accurate customer lifetime value.
A B2B SaaS company mapped their touchpoints and discovered they had 12 awareness touchpoints, 8 consideration touchpoints, 6 decision touchpoints, and only 2 retention touchpoints. They were spending 80% of their marketing budget on acquisition while completely ignoring the post-purchase journey that determined whether customers stayed or churned.
The Hidden Touchpoints That Kill Attribution
The most dangerous touchpoints are the ones you can't see in your analytics. A customer sees your Instagram ad, doesn't click. Three days later, they Google your brand name and visit your website. Your analytics show a "direct" visit. You attribute zero value to that Instagram ad.
But that Instagram ad created the awareness that drove the search. Without it, that customer never would have found you. This is why view-through attribution matters—and why most marketers dramatically undervalue their top-of-funnel campaigns.
Document these invisible touchpoints: billboard impressions, podcast listens without clicks, social media scrolls, word-of-mouth recommendations, press mentions. You may not be able to track them perfectly, but acknowledging they exist changes how you interpret your data.
One DTC brand realized their YouTube pre-roll ads had a 2% click-through rate but were driving 40% of their branded search volume. Their initial analysis said YouTube was their worst-performing channel. Their complete touchpoint map revealed it was actually their most valuable awareness driver.
Choose Your Tracking Technology Stack
Your tracking infrastructure determines what data you can collect and how accurately you can measure customer journeys. Most marketers cobble together free tools and wonder why their attribution is broken. The right stack costs money—but it pays for itself in better budget decisions.
You need three layers: data collection, data storage, and data analysis. Each layer serves a specific purpose, and skipping any one creates gaps in your customer journey visibility.
Layer 1: Data Collection Tools
Start with your website tracking. Google Analytics 4 is free and captures basic user behavior, but it has significant limitations. It samples data at high traffic volumes, can't track users across devices reliably, and loses accuracy with iOS 14+ users.
For serious customer journey tracking, you need server-side tracking that bypasses browser restrictions. Tools like Segment, Rudderstack, or Snowplow collect first-party data that isn't affected by ad blockers or privacy restrictions.
Next, implement platform-specific tracking pixels. Facebook Pixel, Google Ads conversion tracking, LinkedIn Insight Tag, TikTok Pixel. Each platform needs its own tracking code to measure ad performance accurately. When implementing facebook pixel tracking, ensure you're capturing both standard events and custom conversions to maximize attribution accuracy.
Don't forget offline tracking. If you have phone sales, implement call tracking software like CallRail or DialogTech. If you have physical locations, use location analytics tools. If you have sales reps, integrate your CRM with your marketing analytics.
A financial services company implemented call tracking and discovered that 60% of their conversions happened over the phone—none of which were being attributed to their marketing campaigns. They were about to cut their Google Ads budget because they couldn't see the calls those ads were generating.
Layer 2: Customer Data Platform
All your tracking tools collect data in silos. Facebook knows about ad clicks. Your website knows about page views. Your CRM knows about purchases. But none of them talk to each other.
A Customer Data Platform (CDP) unifies all these data sources into a single customer profile. When someone clicks your Facebook ad, visits your website, opens your email, and calls your sales team, the CDP connects all four touchpoints to the same person.
Popular CDPs include Segment, mParticle, Treasure Data, and Lytics. For smaller businesses, tools like Cometly or Wicked Reports provide similar functionality at lower price points.
The key feature you need: identity resolution. This is the ability to recognize that the person who clicked your ad on mobile, visited your website on desktop, and purchased on tablet is the same customer. Without identity resolution, you're tracking devices, not people.
One e-commerce brand implemented a CDP and discovered their average customer used 3.2 devices before purchasing. Their previous tracking system counted each device as a separate customer, which meant they were calculating a customer acquisition cost that was 3x higher than reality.
Layer 3: Attribution and Analytics Platform
Raw data doesn't tell you which marketing channels are working. You need an attribution software platform that applies models to your customer journey data and calculates the value of each touchpoint.
Google Analytics offers basic attribution, but it's limited to last-click or first-click models. For multi-touch attribution that shows the contribution of every touchpoint, you need specialized software.
Options include Rockerbox, Northbeam, Triple Whale, Hyros, and Cometly. Each has different strengths—some excel at paid advertising attribution, others at content marketing measurement, others at B2B lead tracking.
The critical feature: revenue tracking. Your attribution platform must connect marketing touchpoints to actual revenue, not just conversions. A conversion might be worth $50 or $5,000—you need to know which campaigns drive high-value customers.
A SaaS company switched from conversion-based attribution to revenue-based attribution and discovered their "best" campaign was actually their worst. It drove the most signups but the lowest-value customers who churned within 60 days. They reallocated $40,000/month in ad spend based on this insight.
The Minimum Viable Tracking Stack
If you're just starting, here's the minimum stack that provides useful customer journey tracking: Google Analytics 4 for website behavior, platform pixels for ad tracking, a basic CDP like Segment Starter, and a simple attribution tool like Cometly or Wicked Reports.
This stack costs roughly $500-1,000/month and provides 80% of the insights of enterprise solutions. You can upgrade individual components as your tracking needs become more sophisticated.
The mistake most marketers make is trying to build a perfect tracking stack before collecting any data. Start with the minimum viable stack, identify your biggest blind spots, then upgrade the specific tools that address those gaps.
Implement First-Party Data Tracking
Third-party cookies are dying. iOS 14+ blocks most tracking by default. Browser privacy features are getting more aggressive. If your customer journey tracking relies on third-party data, you're building on quicksand.
First-party data—information you collect directly from customers—is the only tracking method that's future-proof. It's more accurate, more reliable, and completely under your control.
Set Up Server-Side Tracking
Traditional tracking runs in the customer's browser. When someone visits your website, JavaScript code fires and sends data to your analytics platform. This works fine until the customer has an ad blocker, restrictive privacy settings, or a slow internet connection.
Server-side tracking moves data collection to your server. Instead of relying on browser code, your server captures user actions and sends them directly to your analytics platforms. This bypasses ad blockers, works regardless of browser settings, and provides more accurate data.
Implementing server-side tracking requires technical setup. You'll need to configure a server-side container in Google Tag Manager, set up a tracking server, and modify your tracking code to send data server-side instead of client-side.
For Facebook ads specifically, implementing facebook conversion tracking via server-side methods ensures your conversion data remains accurate despite iOS restrictions and browser privacy features.
The payoff is significant. One e-commerce brand implemented server-side tracking and discovered they were missing 35% of their conversions due to ad blockers and iOS restrictions. Their actual ROAS was 40% higher than their browser-based tracking showed.
Build a First-Party Data Collection Strategy
Beyond technical tracking, you need explicit data collection points where customers voluntarily provide information. Email signups, account registrations, quiz completions, survey responses—each creates a first-party data record you can use for tracking.
The key is value exchange. Customers will share data if they get something valuable in return. A personalized product recommendation. A discount code. Exclusive content. Early access to new features.
One DTC brand added a 30-second product recommendation quiz to their homepage. 40% of visitors completed it. Each completion created a first-party data record with the customer's email, product preferences, and use case. This data powered personalized email campaigns and improved ad targeting.
Every form on your website should collect an email address. Every checkout should create an account. Every content download should require registration. These aren't barriers—they're data collection opportunities that improve your customer journey tracking.
Implement Cross-Domain Tracking
If your customer journey spans multiple domains—your main website, a separate checkout domain, a subdomain for your blog—you need cross-domain tracking to connect the journey.
Without it, a customer who starts on blog.yoursite.com and purchases on shop.yoursite.com looks like two different people. Your attribution breaks, your customer journey fragments, and your data becomes useless.
Set up cross-domain tracking in Google Analytics 4 by adding all your domains to your GA4 property settings. For other platforms, implement consistent user ID tracking across domains using cookies or URL parameters.
A B2B company with separate domains for their blog, product site, and customer portal implemented cross-domain tracking and discovered that 70% of their customers visited their blog before purchasing. They had been treating blog traffic as separate from product traffic, which meant they were dramatically undervaluing their content marketing.
Connect Offline and Online Data
The most valuable customer journeys often include offline touchpoints. A customer sees your Facebook ad, visits your website, calls your sales team, and purchases over the phone. If you only track online actions, you miss the conversion entirely.
Implement call tracking that connects phone calls to marketing sources. Use unique phone numbers for different campaigns, or implement dynamic number insertion that shows different numbers based on how the customer found you.
For in-person sales, train your team to ask "How did you hear about us?" and record the response in your CRM. Then connect your CRM to your marketing analytics platform so offline conversions appear in your attribution reports.
A home services company implemented call tracking and discovered that their Google Ads were driving 3x more revenue than their website tracking showed. The ads were generating phone calls, not form fills, and those calls were converting at 60%. Without call tracking, they would have cut a highly profitable campaign.
Build Multi-Touch Attribution Models
Last-click attribution is a lie. It tells you that the final touchpoint before purchase deserves 100% of the credit. By that logic, your checkout page is your most valuable marketing asset.
Real customer journeys involve 4-7 touchpoints. Multi-touch attribution distributes credit across all the interactions that contributed to a conversion, giving you a complete picture of what's actually working.
Understanding Attribution Model Types
There are six main attribution models, each with different strengths. Last-click gives all credit to the final touchpoint. First-click gives all credit to the initial touchpoint. Linear distributes credit evenly across all touchpoints.
Time-decay gives more credit to touchpoints closer to conversion. Position-based (U-shaped) gives 40% credit to first and last touchpoints, 20% to middle touchpoints. Data-driven uses machine learning to assign credit based on actual conversion patterns.
No single model is "correct." Each answers a different question. Last-click shows what closes deals. First-click shows what creates awareness. Linear shows the full journey. Time-decay emphasizes bottom-funnel tactics.
The smartest approach: compare multiple models. If a campaign performs well in first-click but poorly in last-click, it's an awareness driver. If it performs well in last-click but poorly in first-click, it's a conversion driver. Understanding these differences changes how you optimize.
Implementing Position-Based Attribution
For most businesses, position-based attribution provides the best balance. It recognizes that the first touchpoint (which creates awareness) and last touchpoint (which drives conversion) are both critical, while still giving credit to middle touchpoints.
Set up position-based attribution in your analytics platform by configuring a custom attribution model. Assign 40% credit to first interaction, 40% to last interaction, and distribute the remaining 20% evenly across middle touchpoints.
A SaaS company implemented position-based attribution and discovered their content marketing was driving 3x more value than last-click attribution showed. Blog posts were the first touchpoint for 60% of customers, but they never got credit in last-click models. This insight justified a $100,000 increase in content budget.
Building Custom Attribution Models
Standard attribution models don't account for your specific business model. If you have a long sales cycle, time-decay might undervalue early touchpoints. If you have a short sales cycle, position-based might overvalue awareness campaigns.
Build custom models that reflect your actual customer journey. If your data shows that webinar attendees convert at 10x the rate of regular visitors, weight webinar touchpoints higher. If demo requests predict 80% of purchases, give demos extra credit.
Advanced attribution platforms let you create custom models using your own rules. You can assign specific credit percentages to different touchpoint types, weight certain channels higher, or exclude touchpoints that don't influence decisions.
One B2B company built a custom model that gave 50% credit to demo requests, 30% to first touchpoint, and 20% distributed across other interactions. This reflected their reality: demos were the make-or-break moment in their sales process. The custom model revealed which top-of-funnel campaigns were actually driving demo requests.
The Role of Incrementality Testing
Attribution models show correlation, not causation. Just because a customer clicked your Facebook ad before purchasing doesn't mean the ad caused the purchase. They might have bought anyway.
Incrementality testing measures true causal impact. You run controlled experiments where you show ads to one group and withhold them from another, then compare conversion rates. The difference is your incremental lift—the purchases that wouldn't have happened without your marketing.
Run geo-holdout tests where you turn off advertising in certain regions and measure the impact. Run PSA tests where you replace your ads with public service announcements for a control group. Run brand lift studies that measure awareness changes.
A DTC brand ran incrementality tests and discovered their retargeting campaigns had zero incremental lift. Customers who saw retargeting ads converted at the same rate as customers who didn't. They were spending $50,000/month on ads that generated zero additional revenue. Attribution models showed positive ROAS because they couldn't distinguish correlation from causation.
Connect Revenue to Marketing Touchpoints
Tracking conversions is pointless if you don't know what those conversions are worth. A $10 customer and a $10,000 customer both count as "one conversion" in most analytics platforms. This makes your data useless for budget decisions.
Revenue attribution connects actual dollar values to marketing touchpoints. It shows you which campaigns drive high-value customers, which drive low-value customers, and which drive customers who churn immediately.
Implement Revenue Tracking in Your Analytics
Start by passing purchase values to your analytics platform. When someone completes a transaction, send the order total to Google Analytics, your attribution platform, and your ad platforms.
In Google Analytics 4, enable e-commerce tracking and implement the purchase event with revenue parameters. For lead generation businesses, assign estimated values to different lead types based on historical close rates and average deal sizes.
The critical step most marketers skip: update revenue values over time. A customer who purchases once for $100 might spend $1,000 over their lifetime. If you only track initial purchase value, you're dramatically undervaluing the campaigns that acquire high-LTV customers.
One subscription business tracked only first-month revenue in their attribution. This made their annual plan promotions look unprofitable compared to monthly plans. When they switched to tracking 12-month revenue, they discovered annual plans had 3x higher LTV and should receive 5x more marketing budget.
Build Customer Lifetime Value Models
True marketing ROI requires customer lifetime value (LTV) tracking. You need to know not just what a customer spends initially, but what they spend over their entire relationship with your brand.
Calculate LTV by segment. B2B customers have different LTV than B2C. Customers from paid search have different LTV than customers from social media. Customers who purchase product A have different LTV than customers who purchase product B.
Connect these LTV calculations back to your attribution platform. Instead of optimizing for conversions or initial revenue, optimize for predicted LTV. This changes everything about how you allocate budget.
An e-commerce brand calculated LTV by acquisition channel and discovered that Instagram customers had 40% lower LTV than Google customers despite identical first-purchase values. Instagram customers bought once and churned. Google customers became repeat buyers. This insight shifted $200,000/month from Instagram to Google.
Track Revenue by Customer Journey Stage
Not all touchpoints drive immediate revenue. Awareness campaigns create future customers. Consideration content nurtures prospects. Decision touchpoints close deals. Retention campaigns drive repeat purchases.
Assign revenue credit based on journey stage contribution. An awareness touchpoint that introduces your brand to a customer who purchases six months later deserves credit, even if it's not the last click.
Use time-lag reports to understand how long it takes different touchpoints to generate revenue. If your blog posts typically drive purchases 30-60 days after the first visit, don't judge their performance based on immediate conversions.
A B2B SaaS company analyzed revenue by journey stage and discovered their webinars generated zero immediate revenue but drove 40% of their revenue 60-90 days later. They had almost cut their webinar program because it showed poor last-click attribution. Time-lag analysis revealed it was their most valuable middle-funnel tactic.
Implement Profit-Based Attribution
Revenue attribution is better than conversion attribution, but profit attribution is better than revenue attribution. A $1,000 sale with $900 in costs is worse than a $500 sale with $100 in costs.
Calculate profit margins by product, customer segment, and acquisition channel. Some products have 80% margins. Others have 20% margins. Some channels acquire customers with high support costs. Others acquire self-service customers.
Connect profit data to your attribution platform so you're optimizing for profit, not revenue. This reveals which campaigns actually drive business value versus which just drive top-line numbers.
One DTC brand implemented profit-based attribution and discovered their best-selling product had the worst margins. Marketing was driving tons of revenue but minimal profit. They shifted budget to promoting higher-margin products and increased profit by 60% while revenue stayed flat.
Analyze and Optimize Customer Journey Paths
Once you're tracking complete customer journeys, the real work begins: finding patterns in the data and using them to improve your marketing. The goal isn't just to measure what's happening—it's to discover what works and do more of it.
Customer journey analysis reveals the paths that lead to conversions, the touchpoints that accelerate decisions, and the interactions that cause drop-offs. This intelligence transforms your marketing from guesswork to science.
Map High-Converting Journey Paths
Start by identifying your most common conversion paths. What sequence of touchpoints do most customers follow before purchasing? Is it Facebook ad → website visit → email signup → purchase? Or blog post → product page → demo request → sales call → purchase?
Use path analysis reports in your analytics platform to visualize these journeys. Look for patterns in the data. Do customers who visit your pricing page before your product page convert at higher rates? Do customers who read three blog posts convert better than customers who read one?
One SaaS company discovered their highest-converting path was: blog post → case study → pricing page → demo request. Customers who followed this exact sequence converted at 40%, compared to 8% for all other paths. They restructured their website navigation to guide visitors through this optimal journey.
Identify Drop-Off Points
Journey analysis also reveals where you're losing customers. At what point do prospects stop engaging? Which touchpoint causes the biggest drop in progression to the next stage?
Look at your funnel visualization reports. If 1,000 people visit your homepage but only 100 visit a product page, you have a homepage problem. If 500 people add items to cart but only 50 complete checkout, you have a checkout problem.
But go deeper than surface-level funnel analysis. Look at the specific customer journeys that end without conversion. What was the last touchpoint before they disappeared? What content did they view? What actions did they take?
An e-commerce brand analyzed drop-off points and discovered that customers who viewed their shipping policy page had a 70% cart abandonment rate. The shipping costs were too high. They tested free shipping thresholds and reduced abandonment by 40%.
Test Journey Variations
Once you know which journeys convert best, test variations to improve them. If blog → case study → demo works well, test blog → video → demo. If email → webinar → sales call converts, test email → product tour → sales call.
Use A/B testing to compare journey variations. Send half your traffic through path A and half through path B. Measure which generates more conversions, higher revenue, and better customer LTV.
The key is testing one variable at a time. Don't change the entire journey—change one touchpoint and measure the impact. This lets you isolate what's actually driving improvement.
A B2B company tested adding a product demo video to their consideration stage. Customers who watched the video were 2.3x more likely to request a sales demo. They made the video prominent on all product pages and increased demo requests by 60%.
Optimize Touchpoint Sequence and Timing
The order of touchpoints matters. Showing a discount offer before explaining your value proposition kills conversions. Sending a sales email before nurturing content feels pushy. Requesting a demo before building trust fails.
Analyze the timing between touchpoints. How long do customers typically wait between first visit and purchase? Between email signup and first purchase? Between demo request and close?
Use this data to optimize your follow-up timing. If customers typically purchase 7-10 days after their first visit, don't send a discount offer on day 2. If they typically request demos 3-4 weeks after downloading a whitepaper, don't call them the next day.
One SaaS company discovered their customers took an average of 23 days from first visit to purchase. They had been sending aggressive sales emails starting on day 3, which was annoying prospects. They restructured their email sequence to match the natural 23-day journey and increased conversion rates by 35%.
Build Automated Journey Tracking Dashboards
Manual customer journey analysis is valuable but unsustainable. You can't spend three hours every day pulling reports and connecting data sources. You need automated dashboards that show you real-time journey performance at a glance.
The right dashboard answers your most important questions in 30 seconds: Which campaigns are driving revenue? What's your true customer acquisition cost? Which touchpoints are underperforming? Where should you increase or decrease budget?
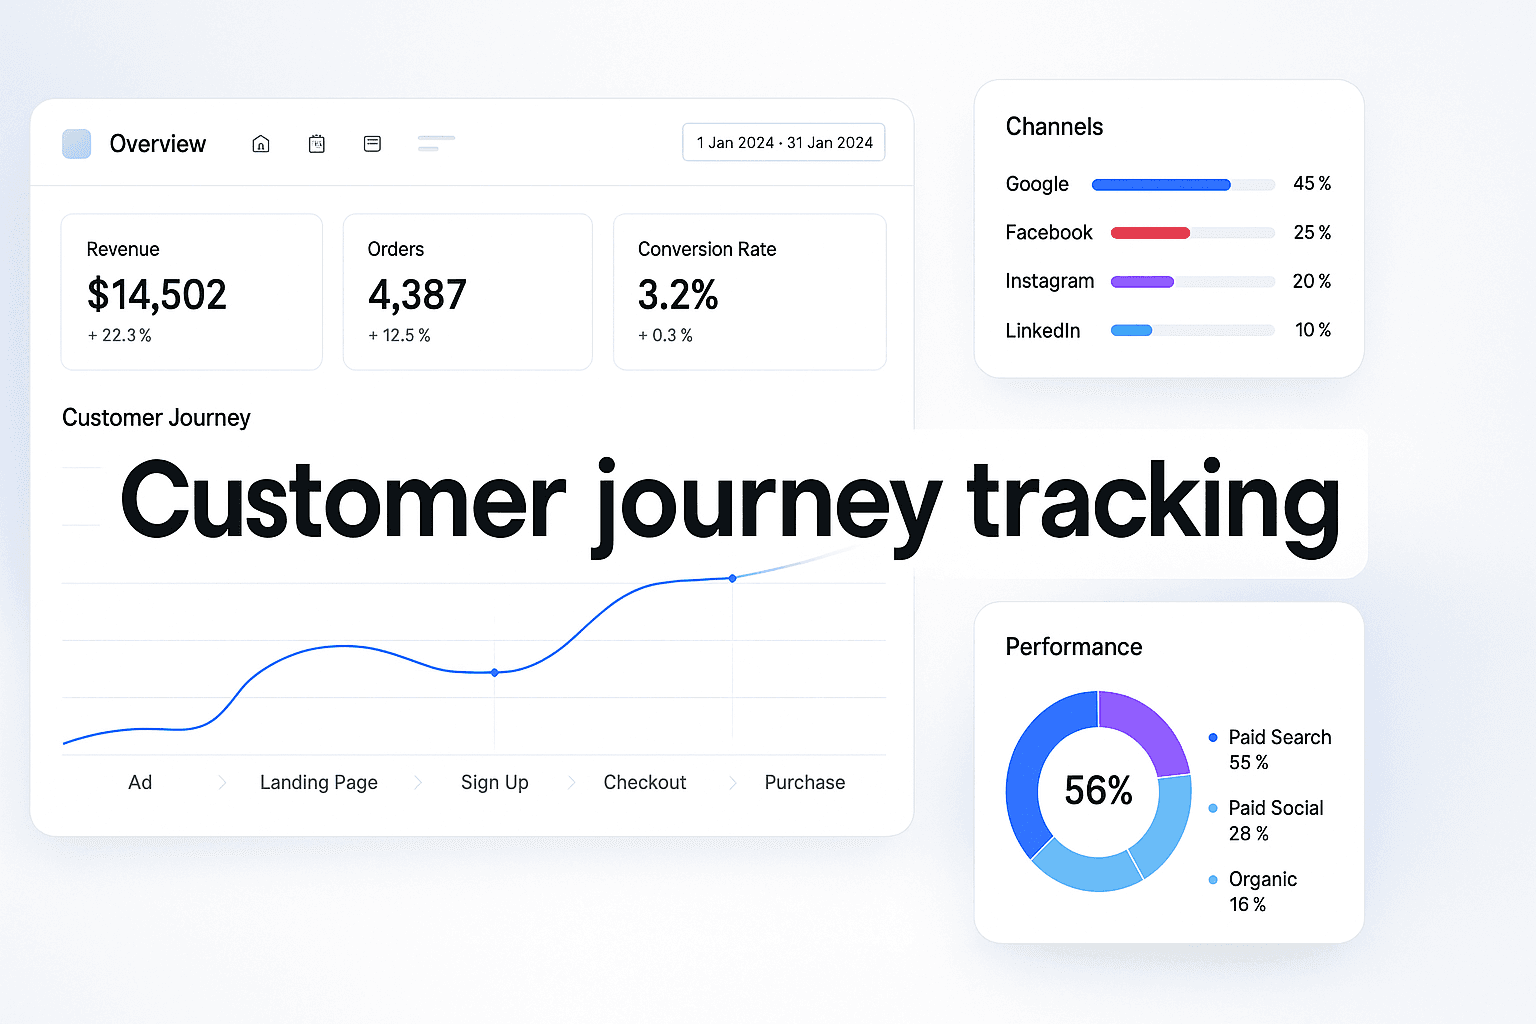
Design Your Journey Tracking Dashboard
Start with your key metrics. For most businesses, these include: total conversions, revenue by channel, customer acquisition cost, return on ad spend, customer lifetime value, and conversion rate by journey stage.
Organize your dashboard into sections: overview metrics at the top, channel performance in the middle, journey path analysis at the bottom. Each section should answer a specific question about your marketing performance.
Use visualization that makes patterns obvious. Line charts for trends over time. Bar charts for channel comparisons. Funnel visualizations for journey progression. Sankey diagrams for path analysis.
The mistake most marketers make is building dashboards with 50 metrics that require a PhD to interpret. Your dashboard should be simple enough that anyone on your team can look at it and immediately understand what's working and what's not.
Set Up Real-Time Alerts
Dashboards are reactive—you have to remember to check them. Alerts are proactive—they notify you when something important happens.
Set up alerts for significant changes in your customer journey metrics. If your conversion rate drops by 20%, you need to know immediately. If your cost per acquisition spikes by 50%, you need to investigate. If a specific journey path stops converting, you need to fix it.
Use your analytics platform's built-in alerting or connect it to Slack, email, or SMS notifications. Configure thresholds that indicate real problems, not normal fluctuations.
One e-commerce brand set up an alert for cart abandonment rate increases. When abandonment spiked by 30% one afternoon, they investigated immediately and discovered their payment processor was down. They fixed it within an hour instead of discovering it the next day when they checked their dashboard.
Create Custom Reports for Stakeholders
Your CEO doesn't need to see every touchpoint in every customer journey. Your CFO cares about revenue and ROI. Your CMO wants channel performance. Your paid media manager needs campaign-level data.
Build custom reports for each stakeholder that show the metrics they care about. Automate these reports to send weekly or monthly via email. Include commentary that explains what the numbers mean and what actions you're taking.
The goal is making your customer journey data accessible and actionable for everyone who needs it, without requiring them to learn your analytics platform or interpret complex reports.
Integrate Journey Data Across Tools
Your customer journey data lives in multiple platforms: Google Analytics, your attribution tool, your CRM, your ad platforms, your email marketing software. Manually pulling data from each tool and combining it is tedious and error-prone.
Use data integration tools like Supermetrics, Windsor.ai, or Funnel.io to automatically pull data from all your sources into a single dashboard. This gives you a unified view of customer journeys without manual data exports.
For more advanced needs, build a data warehouse using tools like BigQuery, Snowflake, or Redshift. This lets you store all your customer journey data in one place and run custom queries to answer specific questions.
A marketing agency managing 50 clients built a centralized data warehouse that pulled customer journey data from all their clients' platforms. This let them identify patterns across clients, benchmark performance, and share best practices. It turned their customer journey tracking from a client-by-client effort into a systematic competitive advantage.
Maintain and Improve Your Tracking System
Customer journey tracking isn't a one-time setup—it's an evolving system that requires continuous refinement as your marketing channels and customer behaviors change. The touchpoints that matter today might shift as new platforms emerge or as your audience adapts their research habits.
Ready to elevate your marketing game with precision and confidence? Discover how Cometly's AI-driven recommendations can transform your ad strategy—Get your free demo today and start capturing every touchpoint to maximize your conversions.